


Introduction
The geochemistry of authigenic (both neoformed and transformed; Pozo & Calvo, Reference Pozo and Calvo2018) clay minerals, particularly oxygen (δ18O) and hydrogen (δ2H some time referred to as δD) isotopic compositions, is a potential tool for quantitative reconstruction of past climates (Andrzejewski & Tabor, Reference Andrzejewski and Tabor2020; Bukalo et al., Reference Bukalo, Ekosse, Odiyo and Ogola2019; Gilg, Reference Gilg2000; Gilg et al., Reference Gilg, Girard and Sheppard2004; Girard et al., Reference Girard, Freyssinet and Chazot2000; Oyebanjo et al., Reference Oyebanjo, Ekosse and Odiyo2018; Tabor & Montañez, Reference Tabor and Montañez2005). Complete removal of organic matter from the soil/sediment samples without affecting the mineral phase is a prerequisite for studying the structure, physicochemical properties, and, most importantly, isotopic composition of clay minerals for paleoclimate study. The incomplete removal of organic matter from phyllosilicates hinders the determination of their mineralogy (Tributh & Lagaly, Reference Tributh and Lagaly1991), and isotope values (mainly δ2H, Hyeong & Capuano, Reference Hyeong and Capuano2000) may also affect inferences based on infrared (IR) and differential thermal analysis (Mitchell & Farmer, Reference Mitchell and Farmer1962). The well known organic matter-removal methods include treatment with hydrogen peroxide (H2O2, Jackson, Reference Jackson2005), disodium peroxodisulfate (Na2S2O8) combined with various neutral buffers (Menegatti et al., Reference Menegatti, Frueh-Green and Stille1999), sodium hypochlorite (NaOCl, Anderson, Reference Anderson1963), ozone, Br2, low-temperature plasma ashing, and stepped-heating (for a summary see Gilg et al., Reference Gilg, Girard and Sheppard2004; Sheppard & Gilg, Reference Sheppard and Gilg1996). Among these methods, H2O2 treatment is the most popular and is used commonly during sample preparation for δ2H analysis (Andrzejewski & Tabor, Reference Andrzejewski and Tabor2020; Bechtel & Hoernes, Reference Bechtel and Hoernes1993; Bechtel et al., Reference Bechtel, Savin and Hoernes1999; Jackson, Reference Jackson2005; Mizota & Longstaffe, Reference Mizota and Longstaffe1996; Oyebanjo et al., Reference Oyebanjo, Ekosse and Odiyo2018). However, the efficacy of organic matter-removal by H2O2 has been questioned, especially for samples containing >1 wt.% total organic carbon (TOC; Hyeong & Capuano, Reference Hyeong and Capuano2000). Further, Hyeong and Capuano (Reference Hyeong and Capuano2000) also suggested that H2O2 can alter significantly the δ2H values of clays, e.g. from ~−8‰ in pure smectites (e.g. smectite reference material H26) to ~−13‰ in smectite-rich shale samples (Hyeong & Capuano, Reference Hyeong and Capuano2000). Studies have shown that treating clays with Na2S2O8 combined with various kinds of neutral buffers is more effective at organic-matter removal (>98 wt.% of the initial TOC, Meier & Menegatti, Reference Meier and Menegatti1997) than H2O2 (Mikutta et al., Reference Mikutta, Kleber, Kaiser and Jahn2005). An easier method of Na2S2O8 treatment (using sodium bicarbonate as a buffer) showed that the δ2H values remained unchanged after leaching (with Na2S2O8 only) for less susceptible illite and kaolinite but smectite was altered by up to ~−28‰ (Meier & Menegatti, Reference Meier and Menegatti1997; Menegatti et al., Reference Menegatti, Frueh-Green and Stille1999). No data exist on the effects of various organic matter-removal treatments for kaolinite, the most widely used clay mineral for paleoclimate studies. A possibility exists that H2O2 treatment may alter the δ2H values of kaolinite, as has been found for smectite (Hyeong & Capuano, Reference Hyeong and Capuano2000).The purpose of the present study was to investigate the effect of commonly used H2O2 and Na2S2O8 treatments on δ2H values of kaolinite separated from the late Paleocene/early Eocene (~ 56–52 Ma) Cambay Shale samples.
Geology of the Study Area
The Cambay Shale sediments were deposited in India’s western margin rift basin. The rift basin formed when India was being separated from Madagascar between the early Jurassic and late Cretaceous. The late Paleocene–early Eocene (~56–52 Ma) Cambay Shale sediments, deposited in a marginal marine setup with an abundant terrestrial organic matter supply, directly overlie the late Cretaceous Deccan Trap flood basalt (see Samanta et al., Reference Samanta, Bera, Ghosh, Bera, Filley, Pande, Rathore, Rai and Sarkar2013, Reference Samanta, Bera and Sarkar2016 for a detailed geological setup). The sediments were derived mostly from weathering of the Deccan Trap basalts, occurring below the thick canopy of the late Paleocene–early Eocene tropical rainforest (Bansal et al., Reference Bansal, Morley, Nagaraju, Dutta, Mishra, Selveraj, Kumar, Niyolia, Harish, Abdelrahim and Hasan2022; Prasad et al., Reference Prasad, Farooqui, Tripathi, Garg and Thakur2009). Despite their old depositional age, the Cambay Shale sediments were never buried deeply and remained close to the subsurface (<1–1.5 km depth), which is evident from the: (1) exceptionally well preserved original aragonitic shells of bivalves with intact outermost organic layer (periostracum); (2) low thermal maturity index (T max values ranging between 400 and 423°C); and (3) preserved angiosperm biomarkers (see Dutta et al., Reference Dutta, Bhattacharya, Mallick, Shukla and Mann2012 for details).
Materials and Methods
Sediment samples were obtained from a well drilled near the village of Valia (latitude: 21°35′50″ N; longitude: 73°12′2″ E; see Samanta et al., Reference Samanta, Bera, Ghosh, Bera, Filley, Pande, Rathore, Rai and Sarkar2013 and references therein for depositional age assignment). Shale samples from four discrete depths of the Cambay Shale were selected for kaolinite clay separation and hydrogen isotopic analysis. The shale samples were selected primarily based on their color (grayscale color) so that they cover a range of TOC values.
Separation of bulk clay from the sediment samples requires a few pretreatment steps to remove carbonate, iron (oxyhydr)oxide phases, and organic matter, which may act as binding agents (Mehra & Jackson, Reference Mehra, Jackson and Swineford1960). Sediment samples were treated successively with HCl (37%; Merck, India, EMPARTA® ACS grade), citrate-bicarbonate-dithionite (trisodium citrate [> 99%, Merck, India], NaHCO3 [Merck, India, EMPLURA® grade], and sodium dithionite [purified, > 85%, Lobachemie, India], following Mehra & Jackson, Reference Mehra, Jackson and Swineford1960), and H2O2 (30%; Merck, India, EMPLURA®ISO grade) with repeated rinsing, centrifuging for removal of carbonate, iron (oxyhydr)oxide phases, and organic matter, respectively. Apart from the usual cleaning using neutral pH detergent (Extran®) and Elix® (Merck, 10—12 Mohm cm at 25°C) water, all laboratory glassware was cleaned with Milli-Q® (18.2 Mohm cm at 25°C) water before use, and the same water was used in sample and reagent preparation at various stages. The freshly prepared Milli-Q® water was used during the wet chemistry and never stored for >2–3 days.
Approximately 5 g of gently crushed samples (samples were not lithified) were treated with >100 mL of 0.5 N HCl at ~60°C in 250 mL borosilicate glass beakers until effervescence stopped. This de-carbonation process generally took a few hours, depending on the presence of carbonate types (Ca, Ca-Mg, Fe, or Mn). Once effervescence stopped, the samples were washed repeatedly with Milli-Q® water by centrifuging 4 or 5 times at 4000 rpm (15 cm rotor diameter, 2683 × g) for 10 min. The neutralized samples were then dried in a microprocessor-controlled hot air-circulation oven at 60°C, where the actual temperature never exceeded the set temperature by >2°C. A portion of each of the dried samples was then transferred to a clean 500 mL borosilicate glass beaker and treated with citrate-bicarbonate-dithionite (CBD) solution to remove iron (oxyhydr)oxide phases. The CBD solution was freshly prepared by adding 45 mL of 0.3 M sodium citrate solution, 5 mL of 1 M sodium bicarbonate solution, and 2 g of sodium dithionite to each 0.5 g sample. The whole CBD solution containing the samples was kept in a water bath at 80°C for a maximum of ~2 h with intermittent stirring. The color change of the sample from black/dark-gray to light gray was a good indicator of the completeness of the reaction; the time taken increased from ~2 to 4 h depending on the amount of iron (oxyhydr)oxide present in the samples (Meier & Menegatti, Reference Meier and Menegatti1997; Menegattiet al., Reference Menegatti, Frueh-Green and Stille1999; Mikutta et al., Reference Mikutta, Kleber, Kaiser and Jahn2005). The samples were then allowed to cool to room temperature and centrifuged four or five times with Milli-Q® water at 4000 rpm (2683 × g) for 10 min. A portion of the dried sample was then treated with 30% H2O2 at room temperature (~25°C) to remove the organic matter. In doing so, a 250 mL beaker was wrapped in multiple layers of aluminum foil to prevent direct exposure to light and kept for a minimum period of 2 h, an intermediate period of 24 h, and a maximum period of 48 h, with intermittent shaking. The varied-time (2 to 48 h) H2O2 treatment was only conducted for the kaolinite internal laboratory reference materials. The core samples were treated for a total of 48 h.
As discussed above, several studies have suspected that H2O2 treatment may alter the δ2H values of the clay samples. Therefore, a portion of each of the CBD-treated samples was treated with sodium peroxodisulfate (Na2S2O8, >95%, Merck, India) in combination with sodium bicarbonate (NaHCO3 [Merck, India, EMPLURA® grade]) used as a buffer, in parallel with H2O2 treatment to remove organic matter. In doing so, each sample was dispersed in Milli-Q® water (70 mL of water for each 200 mg sample). A total of ~1:50 Na2S2O8:OM mass ratio was slowly added to it, keeping the pH of the solution >7 by intermittently adding small aliquots of NaHCO3 (NaHCO3:Na2S2O8 mass ratio ≈1.1) when the pH dropped below 5. This procedure was conducted at ~80°C for a maximum of ~1 h (see Meier & Menegatti, Reference Meier and Menegatti1997; Menegatti et al., Reference Menegatti, Frueh-Green and Stille1999 for details). However, except for the internal laboratory reference materials and one dark-colored sample (244 m), which were treated for ~1 h, the rest of the samples stopped changing color after ~20–30 min and were removed from the bath after ~30–40 min. After centrifuging four or five times at 4000 rpm (2683 × g) to remove sulfates, a few mL of 0.5 N HCl was added to the samples to remove any carbonates that formed during the reaction. The samples were again centrifuged at 4000 rpm (2683 × g) to remove any excess acid and salts.
After completion of HCl, CBD, and H2O2 or Na2S2O8 treatments, the samples were transferred to a 250 mL beaker, and 5.5 g L–1 sodium hexametaphosphate (Merck, India, 96%) was added to the samples for dispersion (Sperazza et al., Reference Sperazza, Moore and Hendrix2004). A small amount of dispersed sample was poured into a 1 L borosilicate graduated cylinder with 1000 mL of Milli-Q® water for gravity settling. The depth of the water column, containing a particular size fraction, was calculated by ‘Stokes Law’ using Sedicalc (Krumm, Reference Krumm2006) software and later concentrated by a centrifuge method for making oriented glass slides. To check whether the grain size (in the clay size range) has any effect on the clay mineralogy, various size fractions of one Cambay Shale sample, i.e.: (1) bulk sample (having all size fractions between 2 and 0.2 μm); (2) 2 to 1 μm; (3) 1 to 0.5 μm; (4) 0.5 to 0.2 μm; and (5) < 0.2 μm were analyzed in a Rigaku desktop X-ray diffractometer operating with CuKα radiation between 2 and 60°2θ with a step size of 0.02°2θ and count time per step of 1 s (Fig. 1). The bulk clay samples containing the 2–0.2 μm size fractions were selected for the δ2H analysis. In addition, two kaolinite internal laboratory reference materials (BDLK2 and BDLK3) collected from a kaolinite deposit formed over a Precambrian basement rock were also processed. As mentioned, the reference materials were subjected to H2O2 treatment for a minimum of 2 h and a maximum of 48 h to assess its effect on δ2H values, if any. About 1–2 mg of vacuum-dried (70°C for 24 h) clay samples were packed into tin capsules and analyzed immediately by placing them onto the automated carousel atop a Temperature Conversion Elemental Analyzer (TC-EA; Thermo Scientific, Bremen, Germany; Fig. 2a; following Sharp et al., Reference Sharp, Atudorei and Durakiewicz2001). The sample capsule was plunged inside the graphite crucible housed in a glassy carbon reactor surrounded by a ceramic insulator tube under a continuously He-flushed (purity 99.999%, flow rate of ~100 mL min–1) condition. The lower part of the reactor was filled with glassy carbon granules, pre-conditioned at ~1450°C. The base of the reactor was plugged with silver wool, which also adsorbed sulfur and other halogen gases produced during the pyrolysis. Gases produced by the high-temperature reduction were then allowed to pass through a gas chromatographic column (molecular sieve 5 Å) maintained at 80°C to separate other trace gases from the target H2. The purified H2 was introduced into a DeltaplusXP mass spectrometer (Thermo Scientific, Bremen, Germany) via a ConFlo interface housed at the National Facility for Stable Isotope Geochemistry, Department of Geology and Geophysics, Indian Institute of Technology (IIT) Kharagpur. Only ~10% of the H2 from the reaction tube went into the open split (maintained at ~2 mL min–1 He), which dilutes and sends the gas to the mass spectrometer, and the remaining ~90% of the gas was expelled through the vent. The ConFlo interface also generated reference H2 pulses, so individual sample H2 peaks could be measured against those of a reference gas (Fig. 2b). This procedure is comparatively fast, requires a small amount of sample, and provides 100% yield for hydrogen. Routine H3 +-correction was employed before analyzing each set of samples. Raw delta (δ) values were calculated with respect to a laboratory tank of H2. The tank H2 was used as a primary reference gas. Raw δ values were calculated using the following relationship:
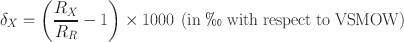
where
 = D/H ratio in the sample and
 = D/H ratio in the reference (the δ2H of the laboratory tank was assumed to be 0‰).
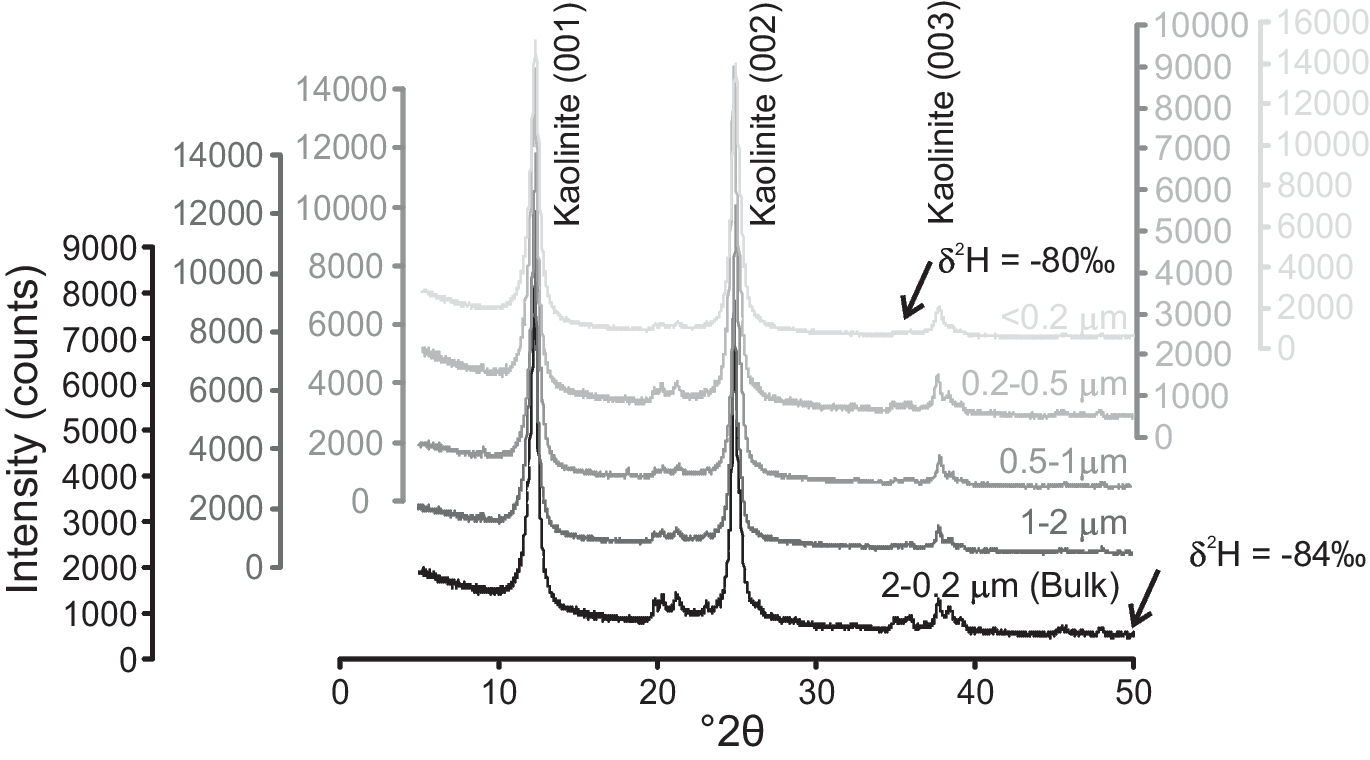
Fig. 1 XRD data (CuKα) showing the presence of kaolinite only in all size fractions of a single Cambay Shale sample and δ2H values of bulk and the finest (<0.2 µm) size fractions treated with H2O2; note no appreciable difference in δ2H values between the size fractions studied
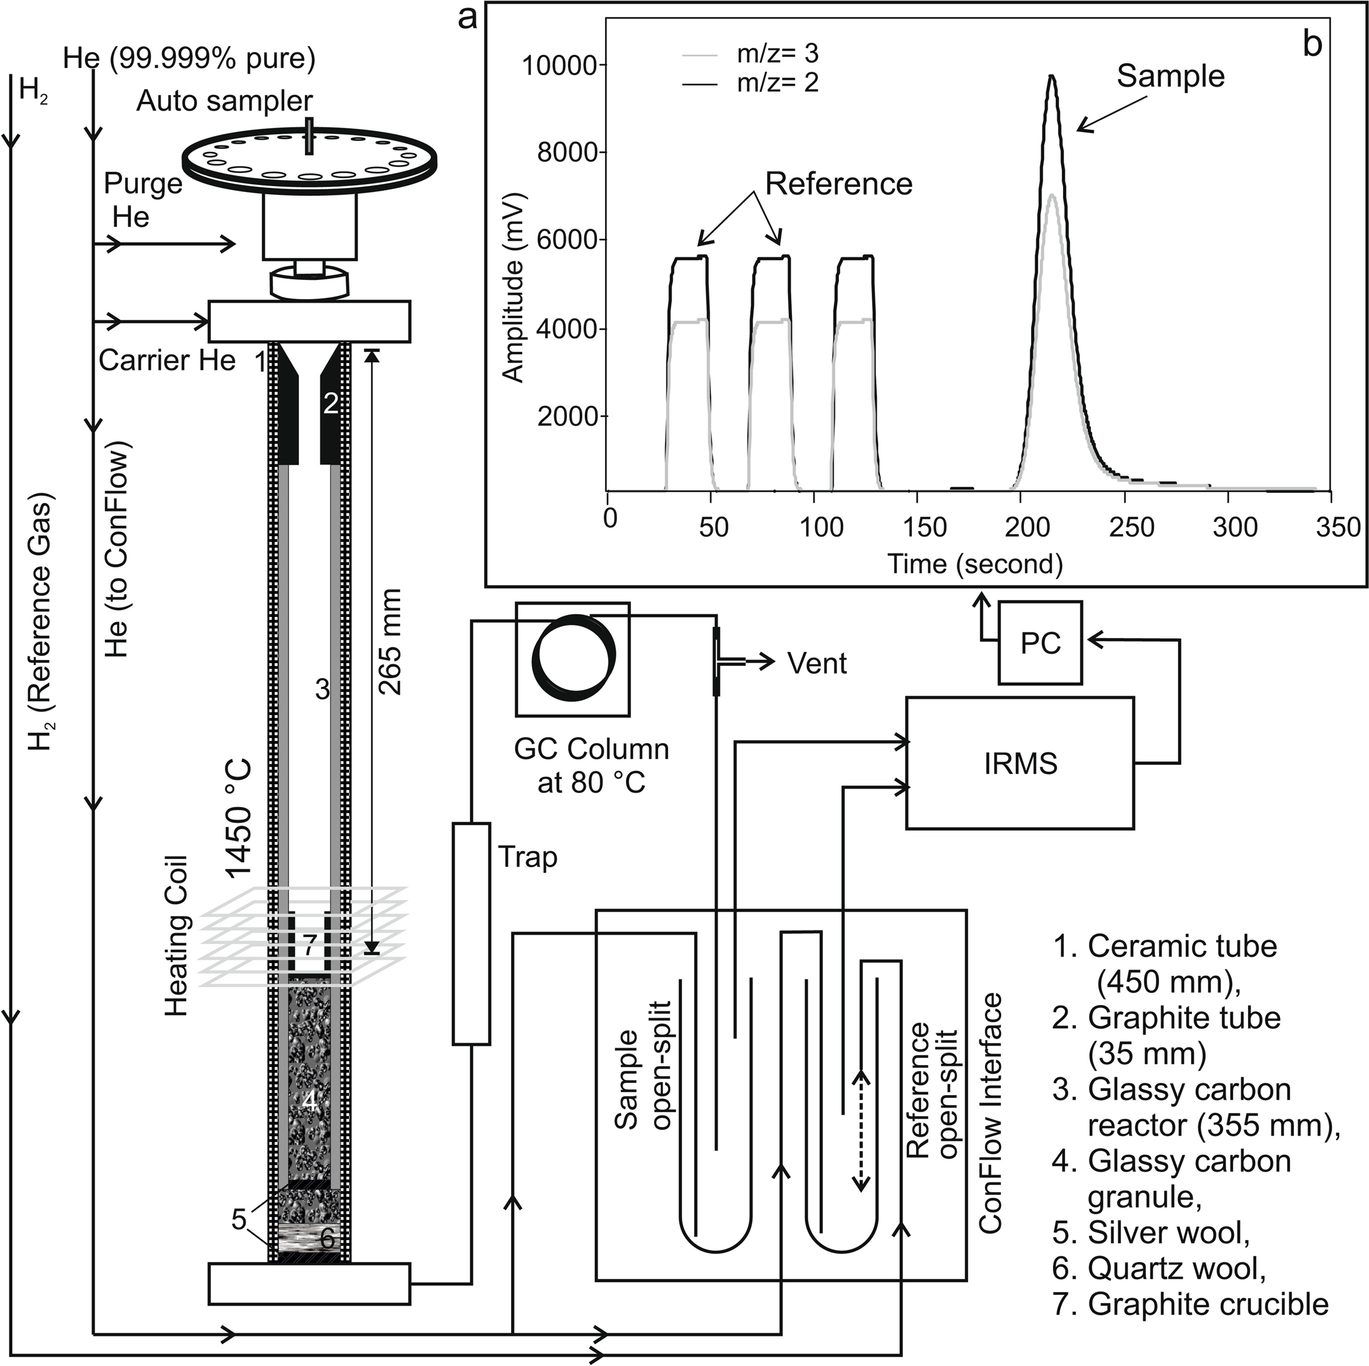
Fig. 2 a Schematic diagram of the high-temperature TC-EA reactor showing the flow of He carrier gas through the GC column into the mass spectrometer. b Typical chromatograms of the H2 reference and sample gases
Before routine analysis of the clay samples, the reproducibility of the TC-EA-DeltaplusXP mass spectrometer system was monitored by analyzing the NBS-22 (oil) certified reference material. In doing so, many aliquots of NBS-22 were measured over a large range of H+ ion beam amplitude (mV), and the raw δ2H (vs. tank H2) was estimated (Table 1; Fig. 3a). The raw δ2H values of NBS-22 exhibited good reproducibility (± 2‰) over a very large range of beam amplitude (mV) varying between ~2000 and ~31,000 mV, which is similar to those obtained elsewhere by both dual inlet and online continuous flow techniques (Sanyal et al., Reference Sanyal, Sarkar, Bhattacharya, Kumar, Ghosh and Agrawal2010; Sharp et al., Reference Sharp, Atudorei and Durakiewicz2001). Such good reproducibility of the NBS-22 δ2H values indicated the system’s stability over a wide range of ion currents. The reproducibility becomes better (~0.8‰) with a restricted/narrower range of H+ ion beam amplitude (mV), as was shown by Coplen and Qi (Reference Coplen and Qi2010).
Table 1 Amplitude of the H+ ion beam and raw δ2H values vs. values from tank H2 (raw)
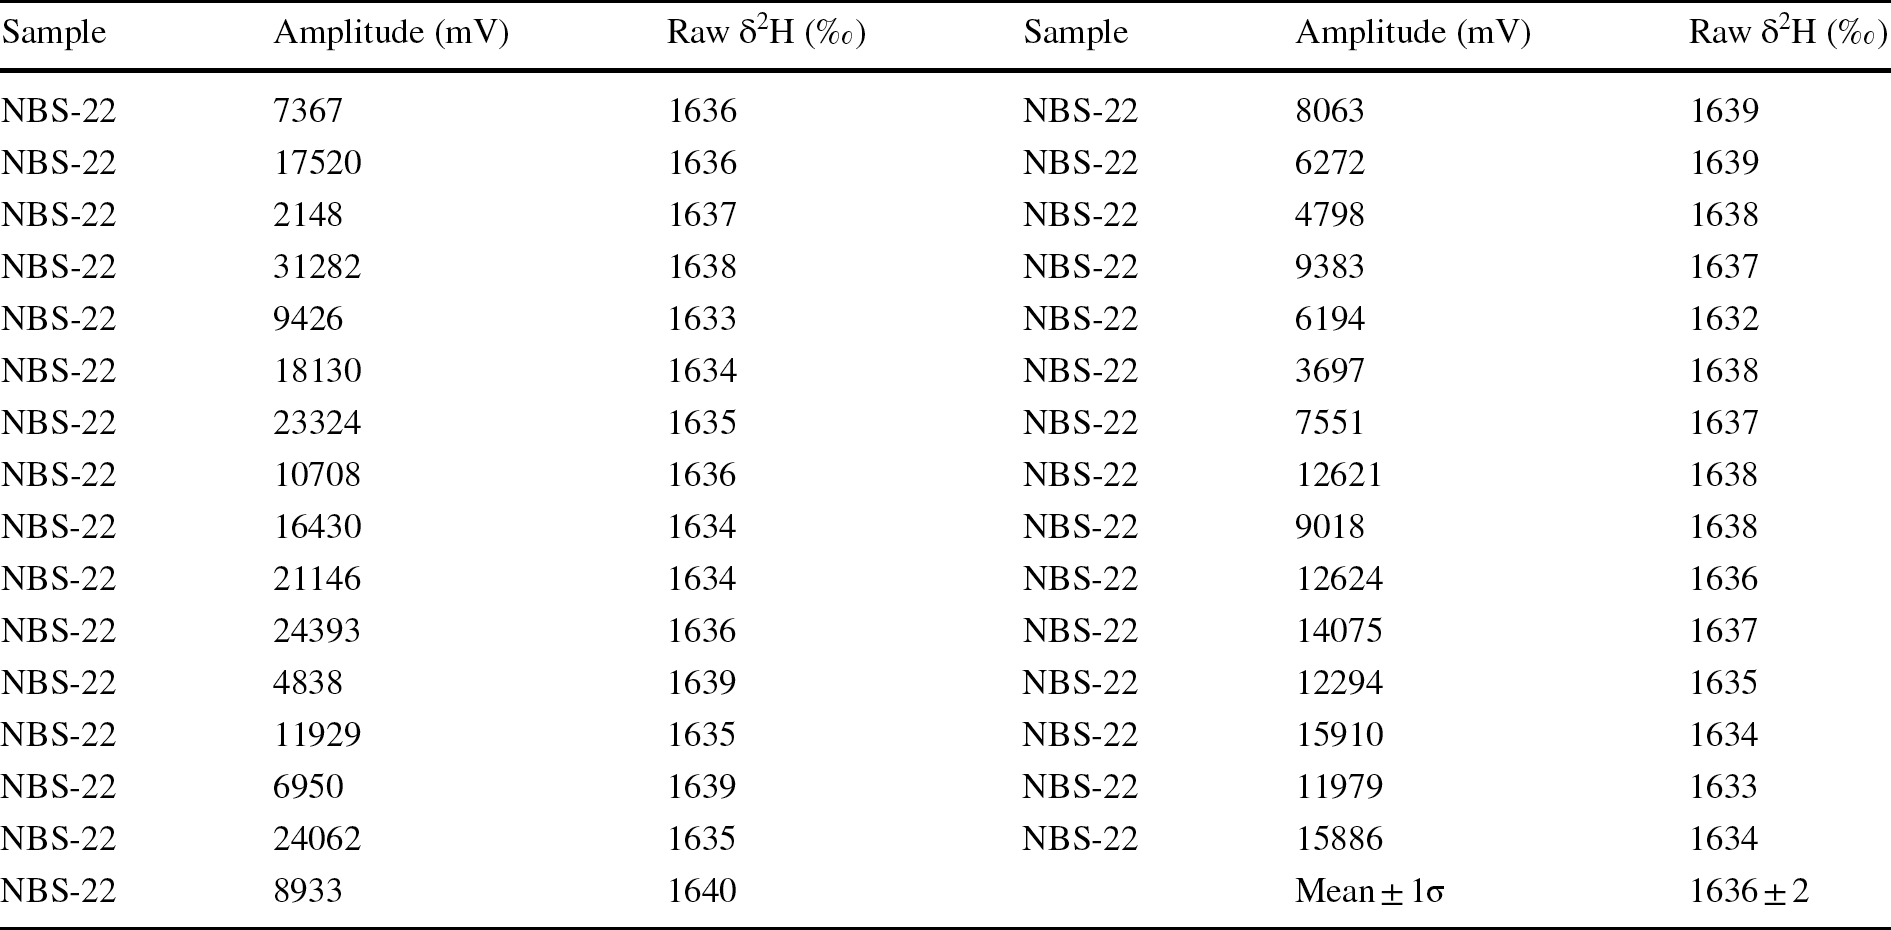
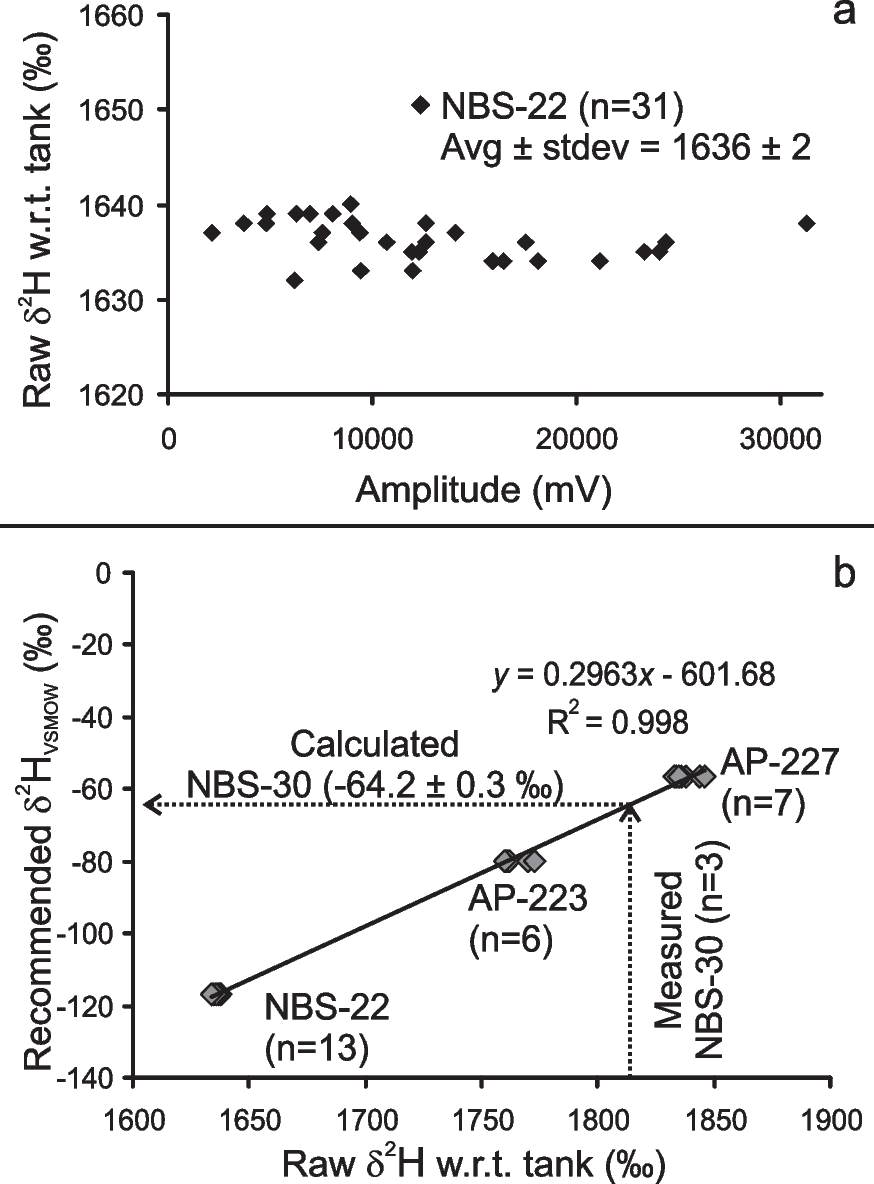
Fig. 3 a The stability of the Elemental Analyzer-DeltaplusXP mass spectrometer system over a large range of ion-current (represented as collector voltage). b Results of δ2H stretching experiment using three reference materials having widely different δ2H values. Measured and calculated values for NBS-30 Biotite reference material treated as an unknown are also shown using dotted lines (see text for details; w.r.t. = with respect to)
Natural clays can have a wide range of δ2H values depending on the meteoric/environmental water hydrogen isotopic composition with which the clay had equilibrated. While glacial meltwaters at high altitudes or latitudes can be extremely depleted in deuterium, tropical waters, affected by evaporation, may be significantly enriched in deuterium (Dansgaard, Reference Dansgaard1964). Because the resistance of the amplifier of the mass spectrometer does not behave linearly with minor ion current, the system is required to be referenced with respect to reference materials of widely varying isotope compositions before measurement of any unknown samples (Coplen & Qi, Reference Coplen and Qi2010; Qi et al., Reference Qi, Coplen, Olack and Vennemann2014). During the present work, this was obtained by analyzing three reference materials having widely different δ2H values (Fig. 3b). These are NBS-22VSMOW oil (− 116.9 ± 0.8‰; Coplen & Qi, Reference Coplen and Qi2010), AP-223VSMOW (− 80‰), and AP-227VSMOW (−49‰; internal cellulose nitrate reference materials obtained from Physical Research Laboratory, Ahmedabad). Using the slope and intercept obtained from recommended and measured δ2H values of the reference materials, NBS-22 − AP-223 − AP-227 (Fig. 3b), the final δ2H values (VSMOW) of multiple aliquots of ground biotite certified reference material NBS-30 were calculated as unknown samples. The δ2H values of the kaolinite samples were calculated in the same way as mentioned above. The accuracy of the analysis was checked by comparing the measured and recommended δ2H values of the primary NBS-30 certified reference material. Because δ2H values of NBS-30 show a grain-size dependency (see Qi et al., Reference Qi, Coplen, Olack and Vennemann2014 and references therein for details), the NBS-30 was powdered with the help of an agate mortar and pestle before being introduced into the TC-EA for high-temperature reduction. As observed by previous workers, the δ2H values of NBS-30 crystals showed a clear grain size-dependent trend, and the measured δ2H values became closer to recommended δ2H values (− 65.7 ± 2‰; Qi et al., Reference Qi, Coplen, Olack and Vennemann2014) only when the grain size was <74 µm (− 64‰, Qi et al., Reference Qi, Coplen, Olack and Vennemann2014). The measured values of NBS-30 (n = 3), as an unknown sample, yielded a δ2H value of −64.2 ± 0.3‰ (VSMOW) which agreed well with the recommended value of −65.7 ± 2‰ (see Qi et al., Reference Qi, Coplen, Olack and Vennemann2014). Hereafter, all δ2H values are reported with respect to VSMOW unless otherwise mentioned specifically.
Total organic carbon (in wt.%) of all decarbonated (HCl-treated), H2O2-treated, and Na2S2O8-treated bulk clay samples (size fraction 2–0.2 μm) were measured in a Flash 2000 Elemental Analyzer (Thermo Scientific, Bremen, Germany) attached to a Thermo Delta V Advantage continuous flow isotope ratio mass spectrometer (Thermo Scientific, Bremen, Germany) at the Department of Geology and Geophysics, IIT Kharagpur, India (see Samanta et al., Reference Samanta, Bera, Ghosh, Bera, Filley, Pande, Rathore, Rai and Sarkar2013, for details).
Results
The X-ray diffraction (XRD) data of all size fractions, i.e. (1) bulk sample (having all size fractions between 2 and 0.2 μm), (2) 2 and 1 μm, (3) 1 and 0.5 μm, (4) 0.5 and 0.2 μm, and (5) <0.2 μm suggested that irrespective of size, all size fractions represent kaolinite only (Fig. 1). The δ2H values of the bulk clay and the finest fraction (<0.2 μm) did not show an appreciable difference even when treated with H2O2.
Two samples of organic matter-free (below detection limit), pure kaolinite internal laboratory reference materials BDLK2 and BDLK3 showed similar δ2H values of −77 ± 2‰ and −80 ± 2‰, respectively, for H2O2-treated, Na2S2O8-treated, and untreated samples (Table 2). No significant difference was observed even when H2O2 treatment duration was varied from a minimum of 2 h to a maximum of 2 days. The δ2H values of kaolinite extracted from the Cambay Shale using H2O2 treatment exhibited a range between −73 and −78‰ (average ~−75‰), whereas kaolinite extracted from the same samples using Na2S2O8 treatment showed larger values, varying from −48 to −56‰ (average ~−53‰; Table 3; Fig. 4).
Table 2 δ2H values of kaolinite internal laboratory reference materials (BDLK2 and BDLK3) using various organic matter-removal techniques
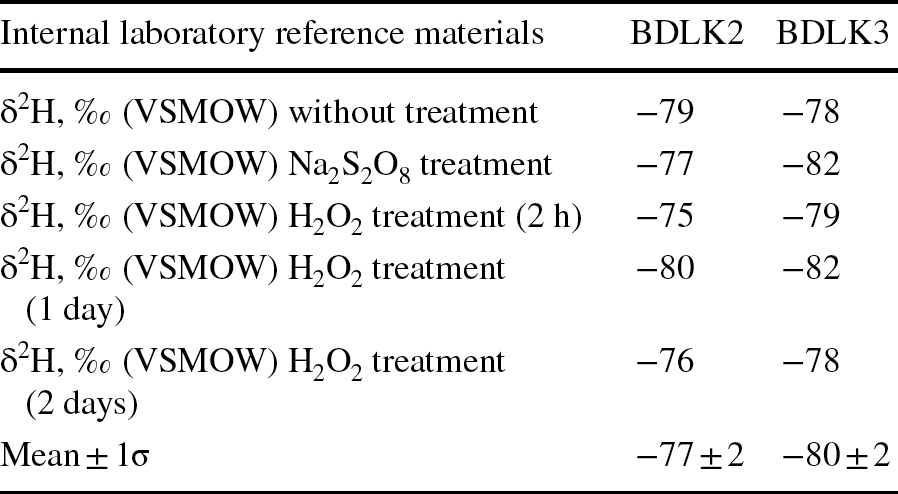
Table 3 δ2H values (all values with respect to VSMOW) of kaolinite separated from Cambay shale using various organic matter-removal techniques and calculated meteoric water δ2H values under assumed equilibration temperatures of 28°C
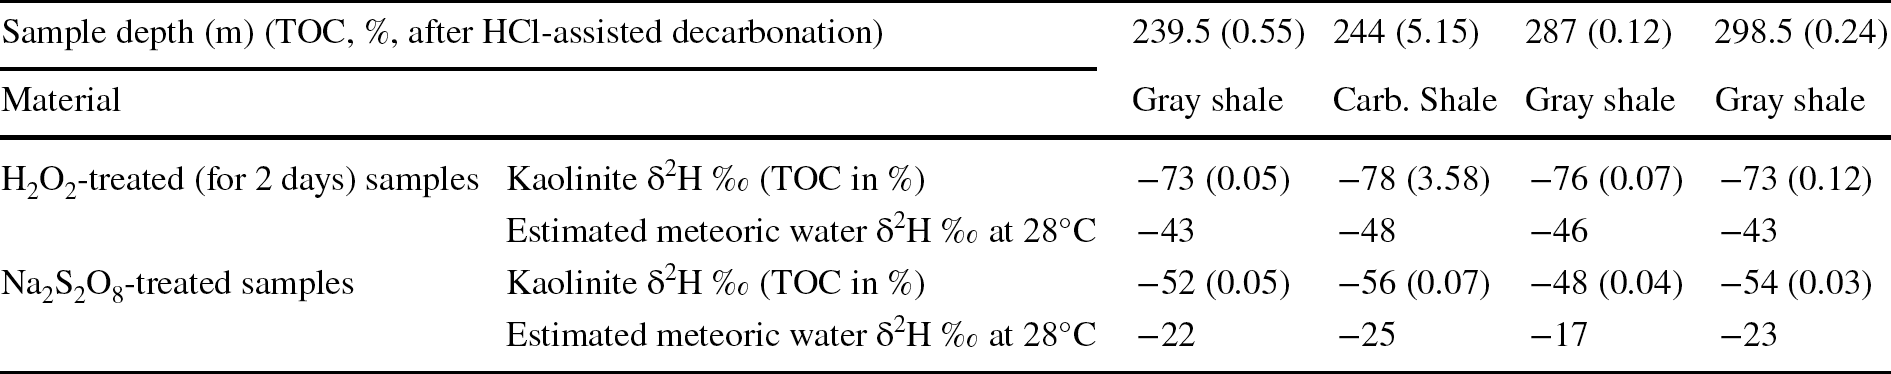
The TOC, in % after HCl-assisted decarbonation, and Na2S2O8 and H2O2 treatments are also provided
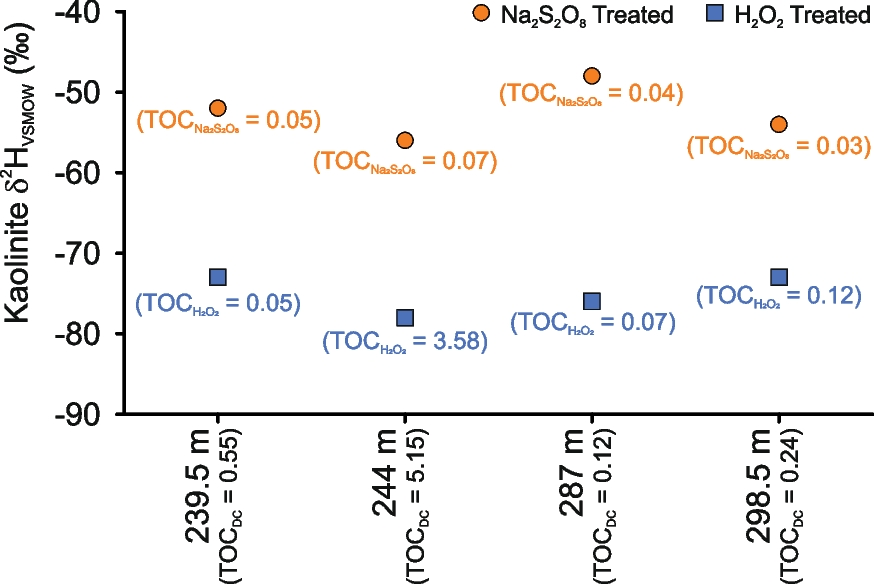
Fig. 4 Comparison of kaolinite δ2HVSMOW (‰) values after treatments with H2O2 and Na2S2O8. The total organic carbon (%) after HCl-assisted decarbonation (
 ), H2O2 (
 ), and Na2S2O8 (
 ) treatments are also shown for comparison
The TOC of the decarbonated samples varied from 0.12 to 5.15 wt.%. However, after organic-matter removal/oxidation, the TOC varied from 0.05 to 3.58 wt.% for the H2O2-treated samples and 0.03 to 0.07 wt.% for Na2S2O8-treated samples (Table 3; Fig. 4).
Discussion
The δ18O and δ2H values of both detrital (having a nearby source; Oyebanjo et al., Reference Oyebanjo, Ekosse and Odiyo2018) and authigenic (formed during the early diagenesis; Girard et al., Reference Girard, Freyssinet and Chazot2000) clay minerals found in sediments can be excellent recorders of the ambient climate. However, depending on the source and mineralogy, the δ2H values of the clay minerals can show large variability. The general assumption is that the finer fraction (< 0.2 µm) of the clay represents the authigenic minerals formed during early water–rock interaction, whereas the coarser fraction generally represents the detrital fraction (Andrzejewski & Tabor, Reference Andrzejewski and Tabor2020; Bukalo et al., Reference Bukalo, Ekosse, Odiyo and Ogola2019; Oyebanjo et al., Reference Oyebanjo, Ekosse and Odiyo2018; Tabor & Montañez, Reference Tabor and Montañez2005). Therefore, a detailed size-fraction analysis of one representative sample was performed before the δ2H measurements to check whether the clays studied represent a mixture of both detrital and authigenic populations. All size fractions were characterized by kaolinite only (Fig. 1) and showed no appreciable difference in δ2H values between the bulk (2–0.2 μm) and finest (>0.2 μm) fraction, even when treated with H2O2. Hence, the 2–0.2 μm size fraction (i.e. bulk clay fraction) was selected for δ2H analysis for the rest of the samples.
Hyeong and Capuano (Reference Hyeong and Capuano2000) and Menegatti et al. (Reference Menegatti, Frueh-Green and Stille1999) showed that both H2O2 and Na2S2O8 treatment alter the δ2H values of their smectite reference materials. The authors suggested that this may be due to the exchange of H+ ions, adsorbed primarily on interlamellar surfaces of smectite, with H+ coming from H2O2 (intermediate cation in Fenton-like reactions, Mikutta et al., Reference Mikutta, Kleber, Kaiser and Jahn2005 and references therein). The δ2H values of two pure kaolinite internal laboratory reference materials (BDLK2 and BDLK3) were measured without any pretreatment as well as after the H2O2 (after 2 h, 1 day, and 2 days of reaction time) and Na2S2O8 treatments to evaluate the effect, if any, of the treatment, on the δ2H values (Table 2). No appreciable difference in δ2H values was observed between the treated and untreated kaolinite reference materials. The δ2H values obtained for these pure kaolinite reference materials subjected to these two treatments were −77 ± 2 and −80 ± 2‰, respectively, and are very similar within experimental error (Table 2). Even H2O2 treatment for 2 days did not alter the kaolinite δ2H values. Also important to note is that, before H2O2 and Na2S2O8 treatment, the kaolinite internal laboratory reference materials were subjected to routine HCl and CBD treatment. One may assume, therefore, that, apart from H2O2 and Na2S2O8, the HCl and CBD treatments did not alter the hydrogen isotopic composition of these kaolinite internal laboratory reference materials. The possibility exists that not enough free H+ was present during the HCl reactions (0.5 N HCl) to cause hydrogen isotopic exchange, i.e. all H+ may have been consumed during carbonate dissolution or the reaction rate was too slow to show any significant effect on the δ2H values.
When subjected to different pretreatment methods, however, a substantial difference in δ2H values was observed for the kaolinites separated from Cambay Shale. When comparing δ2H values of H2O2- and Na2S2O8-treated kaolinite from these shale samples, H2O2-treated samples were ~20–30‰ less than the Na2S2O8-treated aliquots (Fig. 4). TOC data highlight that the Na2S2O8 treatment was more efficient for organic-matter removal (Table 3; Fig. 4). The δ2H values of the investigated shale samples, along with their TOC data, suggested that for sediment samples with high TOC (carbonaceous shale 244 m), the H2O2 treatment is not sufficient, resulting in partial retention of the organic phases, which may eventually contaminate the samples during their δ2H measurement. The present observation concerning the inefficient removal of organic matter during the H2O2 treatment has also been reported by many previous workers, e.g. Hyeong and Capuano (Reference Hyeong and Capuano2000), Meier and Menegatti (Reference Meier and Menegatti1997), Menegatti et al. (Reference Menegatti, Frueh-Green and Stille1999), and Mikutta et al. (Reference Mikutta, Kleber, Kaiser and Jahn2005). Three possible reasons for the observed difference in the average δ2H values of ~22‰ between H2O2 and Na2S2O8-treated samples could be: (1) the presence of residual organic matter after H2O2 treatment; (2) hydrogen isotopic exchange between H2O2 and kaolinite’s ‘outer hydroxyl’ group (Fig. 5; Ledoux & White, Reference Ledoux and White1964); and (3) dissolution (and possible reprecipitation) of kaolinite during the H2O2 treatment (Fig. 5; Cama & Ganor, Reference Cama and Ganor2006; Chin & Mills, Reference Chin and Mills1991; Mikutta et al., Reference Mikutta, Kleber, Kaiser and Jahn2005; Yang & Steefel, Reference Yang and Steefel2008). So, a simple mass-balance estimation was performed to understand whether the presence of residual organic matter can cause the observed ~22‰ difference between H2O2- and Na2S2O8-treated samples. In doing so, it was estimated from the chemical formula that kaolinite has a hydrogen mass fraction of 1.56 wt.% and organic matter (CH2) has a hydrogen mass fraction of 14.29 wt.%. The organic-matter chemical formula, i.e. CH2, was chosen on purpose to estimate the maximum possible depletion to be expected in δ2H values when samples are contaminated with organic matter. Any other natural soil/sedimentary organic matter, e.g. cellulose, lignin, etc., contains a much smaller amount of hydrogen, ~6%. If the clay δ2H value is ~−53‰ (average of the Na2S2O8-treated samples) and the organic matter δ2H value is ~−120‰ (
 ~−120‰, Leaney et al., Reference Leaney, Osmond, Allison and Ziegler1985; (
 ~−80 to −110‰, Schimmelmann et al., Reference Schimmelmann, Sessions and Mastalerz2006), the presence of 1 wt.% organic matter in the treated clay can shift the δ2H values by ~5–6‰. The observed difference of ~20‰ between H2O2- and Na2S2O8-treated samples requires ~5 wt.% organic matter in the H2O2-treated samples. The TOC (wt.%) data suggested that the TOC of the H2O2-treated samples was < 1 wt.% (except for one sample), however. The presence of residual organic matter after H2O2 treatment cannot explain the observed difference in δ2H values. Interestingly, a study by Barnette et al. (Reference Barnette, Lott, Howa, Podlesak and Ehleringer2011) showed that a linear relationship exists between δ2H and δ18O values of H2O2 solutions purchased across the United States and in Mexico, which nearly parallels the Local Meteoric Water Line (LMWL) and the δ2H values can be as low as −235‰. So, a possibility exists that 2H-depleted H2O2 can cause a significant depletion in the clay δ2H values through hydrogen isotopic exchange of the kaolinite’s ‘outer hydroxyl’ group (Fig. 5a). However, the small ratio (~1:130; see Supplementary Material for detailed calculations) of the ~0.2 µm size kaolinite’s ‘outer hydroxyl’ and ‘inner hydroxyl’ groups can only cause a minimal shift (~−1.4‰) during the isotopic exchange between highly 2H-depleted H2O2 (−235‰), and most 2H-enriched Na2S2O8-treated kaolinite (~−53‰). Therefore, following Mikutta et al. (Reference Mikutta, Kleber, Kaiser and Jahn2005), H2O2 treatment was suspected possibly to promote the organic-assisted dissolution of poorly crystalline minerals at low pH. During this dissolution (± reprecipitation) process, isotope exchange between mineral and H2O2 may cause the lowering of the δ2H values of kaolinite clays. Previous studies have shown that oxidation of organic matter (coal/lignite) using H2O2 produces a large quantity of low-molecular-weight organic acids, e.g. formic acid, acetic acid, glycolic acid, succinic acid, and malonic acid (Fig. 5; Doskočil et al., Reference Doskočil, Grasset, Válková and Pekař2014; Miura et al., Reference Miura, Mae, Okutsu and Mizutani1996). Because the low-molecular-weight organic acids are more efficient at dissolution and sometimes reprecipitation of silicates or kaolinite compared to the inorganic acids, even at low temperatures (Cama & Ganor, Reference Cama and Ganor2006; Chin & Mills, Reference Chin and Mills1991; Yang & Steefel, Reference Yang and Steefel2008), the organic-assisted dissolution (± reprecipitation in selected cases) during the H2O2 treatment may be the reason for this discrepancy (Fig. 5). Na2S2O8 treatment, on the other hand, is likely to be less harmful to the minerals (Mikutta et al., Reference Mikutta, Kleber, Kaiser and Jahn2005) as it is performed at a neutral to basic pH and thus lacks free H+ to affect the δ2H of kaolinite..

Fig. 5 Schematic diagram showing a the projection of the kaolinite crystal structure on the (100) plane (modified after Ledoux & White, Reference Ledoux and White1964) and b the proposed mechanism for the H2O2 oxidation of Brown coal and formation of low-molecular-weight organic acids (modified after Miura et al., Reference Miura, Mae, Okutsu and Mizutani1996). Two important processes, i.e. hydrogen isotopic exchange between H2O2 and kaolinite’s “outer hydroxyl” group and dissolution (and possible reprecipitation) of kaolinite in the presence of low molecular-weight organic acids produced during the H2O2 treatment, are also shown
In a further attempt to understand which of the average kaolinite δ2H values (i.e. H2O2-treated [−75‰] or Na2S2O8-treated [−53‰]) is more realistic, soil/environmental water δ2H values were estimated using a branched glycerol dialkyl glycerol tetraether-based paleotemperature estimation of ~28°C (Naafs et al., Reference Naafs, Rohrssen, Inglis, Lähteenoja, Feakins, Collinson, Kennedy, Singh, Singh, Lunt and Pancost2018) from nearby early Eocene lignite deposits at Matanomadh and Panandhro, and a hydrogen isotope fractionation factor of the kaolinite–water system provided by Gilg and Sheppard (Reference Gilg and Sheppard1996; Table 3). The calculated soil/environmental water δ2H values for the H2O2 and Na2S2O8 treated kaolinite were −45 and −22‰, respectively (Table 3). Using the relationship between the δ18O and δ2H values of global precipitation water, i.e. the global meteoric water line (Dansgaard, Reference Dansgaard1964), the estimated early Eocene equatorial precipitation δ18O for the H2O2- and Na2S2O8-treated kaolinite are −7 and −4‰, respectively. Bera et al. (Reference Bera, Bhattacharya, Sarkar, Samanta, Kumar and Sahni2010) reported a phosphate δ18O value of 18.1‰ from fish vertebrae recovered from the equivalent stratigraphic horizon (i.e. above the characteristic carbon isotopic excursion of the Paleocene–Eocene Thermal Maximum) of nearby Vastan Mine (see Samanta et al., Reference Samanta, Bera and Sarkar2016 for detailed stratigraphic correlation). Following the revised phosphate–water fractionation equation for biogenic apatite (Pucéat et al., Reference Pucéat, Joachimski, Bouilloux, Monna, Bonin, Motreuil, Morinière, Hénard, Mourin, Dera and Quesne2010), the environmental (lagoonal) water δ18O value of −3.3‰ was estimated from the phosphate δ18O value (at 28°C). The estimated environmental water δ18O values from these two independent proxies, i.e. Na2S2O8-treated kaolinite δ2H values (−4‰) and fish vertebrae phosphate (−3.3‰), agree well with each other. Alternatively, the environmental water δ18O value of − 7‰, obtained from the H2O2-treated kaolinite, requires an abnormally small d-excess (= δ2H – 8*δ18O; Dansgaard, Reference Dansgaard1964) value of ~−19‰. As such a low d-excess value is unrealistic for the equatorial marginal marine precipitation, the Na2S2O8-treated kaolinite δ2H values are proposed to be more realistic.
An important observation is that such a difference in δ2H values between H2O2- and Na2S2O8-treated samples was not seen for the kaolinite internal laboratory reference materials. The possibility exists that: (1) the very small organic matter content of these kaolinite reference materials was insufficient to cause organic-assisted dissolution (± reprecipitation); and/or (2) a better crystallinity (greater structural order) of the kaolinite internal laboratory reference materials, obtained from a kaolinite deposit formed over a Precambrian basement rock (Aparicio & Galan, 1999), prevented organic-assisted dissolution at low pH and possible disintegration/transformation (following Mikutta et al., Reference Mikutta, Kleber, Kaiser and Jahn2005).
Based on these observations and also on the data of pretreatment experiments on kaolinite reference materials, the conclusion is that Na2S2O8 treatment is a better method for both complete removal of organic matter and preservation of pristine δ2H values for paleoclimate analysis compared to H2O2 treatment.
Conclusions
The present study showed that the commonly used H2O2 pretreatment for extracting clay minerals from organic matter-rich sediments (e.g. carbonaceous shales) is inefficient at removing organic matter. The Na2S2O8 treatment was more efficient. Further, the smaller δ2H values of the H2O2-treated aliquots compared to the Na2S2O8-treated aliquots raised suspicion about the possible alteration of the pristine δ2H values during H2O2 treatment. Because H2O2 treatment of organic material-bearing sediment produces low-molecular-weight organic acids, which have the potential to cause organic-assisted dissolution (± reprecipitation) of the clay minerals, the possibility exists that H2O2 treatment can lead to alteration of the pristine isotopic composition. The excellent agreement between the estimated environmental water δ18O values from two independent proxies, i.e. biogenic phosphate and Na2S2O8-treated kaolinite, further suggested that Na2S2O8 treatment is less harmful to the clay minerals as the treatment is performed under neutral to mildly basic pH condition that helps to retain the pristine isotopic composition. The present study, therefore, recommends Na2S2O8 treatment for clay mineral separation for isotopic study.
Supplementary Information
The online version contains supplementary material available at https://doi.org/10.1007/s42860-023-00221-z.
Acknowledgements
The present work was initiated by A. Samanta during her Ph.D. studies; she thanks IIT Kharagpur for the fellowship. A. Samanta is also grateful to Asutosh College for providing the necessary permission to carry out further research. A. Sarkar acknowledges the Department of Science and Technology (DST), New Delhi, for funding a research project on Paleogene sediments of western and northwestern India, under which the fieldwork was conducted and samples were procured. All isotope data were generated in the Diamond Jubilee Stable Isotope Mass Spectrometer Laboratory at IIT Kharagpur. All of the authors thank R. Ramesh (PRL, Ahmedabad) and P. Sengupta (Jadavpur University) for providing the cellulose nitrate and kaolinite reference materials. An in-depth review by an anonymous reviewer, by Prof. J. M. Wampler, by Prof. Peter Ryan (Associate Editor), and by Prof. Joseph W. Stucki (Editor in Chief) helped improve the manuscript significantly.
Authors’ contributions
All authors equally contributed to conceiving the problem, sample collection, experiment design, data interpretation, and MS writing. A. Sarkar arranged the funding. All authors confirm that they have seen the manuscript and agree to its submission to Clays and Clay Minerals.
Funding
The Department of Science and Technology (DST) and the Indian Institute of Technology Kharagpur, India.
Data availability
All of the data used in the manuscript are provided in the tables and supplementary material.
Code availability
Not Applicable.
Declarations
Conflicts of interest/Competing interests
The authors declare that they have no known competing financial interests or personal relationships that could have appeared to influence the work reported in this paper.


