


Policy Significance Statement
This paper discusses efforts to harness the power of information by private compagnies such as banks, which are recognized as being of public benefit to citizens and which work closely with regulatory and legal authorities on criminal acts such as fraud or money laundering. In this context, the transparency of algorithms and the interpretability of their results, pointing to suspicions of fraud, could be a critical issue: it goes beyond questions of statistical accuracy to address societal choices.
1. Introduction
Fraudsters are adapting and circumventing increasingly sophisticated barriers erected in particular by banking institutions, which must take quick action to avoid losses while ensuring customer satisfaction. Faced with an increasing flow of transactions, banks’ efficiency relies on data analysis to support established risk control processes, but also on understanding the underlying fraud mechanism. Furthermore, there is no escaping the search for evidence (Ryman-Tubb et al., Reference Ryman-Tubb, Krause and Garn2018): customers with erroneously suspended transactions ask for explanations, anti-laundry authorities, such as TRACFIN in France, expect argued reporting on suspicious deposits or transfers, and legal authorities need concrete facts, in particular to distinguish between criminal and civil liability (Fraud Act, etc.). These legal, operational, strategic, and even ethical constraints lead to compromises on the means to be implemented for fraud management. This paper first focuses on the practical issues raised by fraud management and the specificities of measurement when developing fraud detection models (FDM) that address the trade-off between accuracy and interpretability of detection. Secondly, it provides a state-of-the-art (SOTA) review of the different machine learning based approaches to process these data. Finally, it examines how concrete approaches can provide pragmatic and short-term responses to banks and policy makers without forcing economically and ethically constrained stakeholders into a technological race.
2. Fraud Detection Activities
Fraud management process is a flow of tasks, tainted by a level of human intervention and by economic issues, specific to the nature of controlled banking operations. It cannot be reduced to a binary fraud detection automatic device, and the device must be adapted to the particularities of the process, especially in terms of metrics to optimize through an algorithmic approach. In this first part, we put in perspective the operational questions and needs in order to specify the concept of performance dear to modeling.
2.1. Overview of fraud types in banking industry
Fraud can be defined as all acts of cheating carried out by deceit and in bad faith for the purpose of obtaining an advantage. Fraud damages an individual, a company, an association, the State, and other. Beyond the psychological and moral impacts (Alexopoulos et al., Reference Alexopoulos, Kafentzis, Benetou, Tagaris and Georgolios2007), financial losses due to fraud represent a serious risk for private and public domains, such as tax collection, insurance, telecommunications, or banking industry. This last sector is a target of choice for perpetrators as the volume of banking operations and the diversity of channels increase. Given the specificities of the banking sector and the various crises that have marked it in recent decades, the Basel commission identified fraud, and particularly external fraud, as a major operational risk in 2004. This risk then impacts the calculation of the minimum solvency ratio for banks (McDonough ratio), which is increasingly restrictive and is in the process of being standardized. Thus, the subject of fraud remains of first importance for any banking company: fraud losses are not only suffered in the immediate term but have consequences over time and are under close surveillance.
This supervision is often declined through the various banking products (credit or debit cards, cheques, private or corporate accounts, different types of loans, trading financial instruments, etc.), by type of operations (transfers, payments, direct debit, deposits, money withdrawal, etc.) or channels (physical network, ATM, paper documents, internet, mobile applications, etc.), and by fraudster’s purposes (money laundering, financing of terrorism, personal or organized gang enrichment, etc.). These dimensions are strongly linked to local or national market specificities and trends, such as regulations, competition between banks and with new entrants, or customer behavior patterns in terms of bank product consumption or channel preferences. For instance, OSMP reports in 2018 that the volume of online transactions is quickly rising, and customers require near instantaneous bank response, even for international payments, whereas cheques are slowly decreasing in volume, or have even disappeared in some countries, and can be treated with a longer delay of several hours. A bank’s capacity to satisfy specific customer needs and face competition are critical.
Beyond these business issues, each type of bank product, operation, channel, and fraudster’s purpose can be characterized by its own data, internal (past operations, third party characteristics, internal processes or documents, etc.) or external to the bank (fraudsters behavior outside the bank or online, international blacklists, regulation and guidelines, etc.). In addition, fraud detection devices face new challenges not only in terms of growing operation volumes, but also in terms of data diversity, especially when these dimensions have to be combined. Indeed, the variety of banking services offers an increasingly wide range of opportunities for this illegal activity, and each intersection or combination of dimensions can present its own sophisticated modus operandi, including phishing, malwares, impersonation, payment theft or forgery, account takeover, and so on. The diversity of these multi-dimensional and combined tactics (see Figure 1) is enhanced with a rapid and unpredictable change: fraudsters create new approaches, test security and prevention barriers and quickly adapt. In this context, strong and dynamic fraud management is paramount for the banking industry.
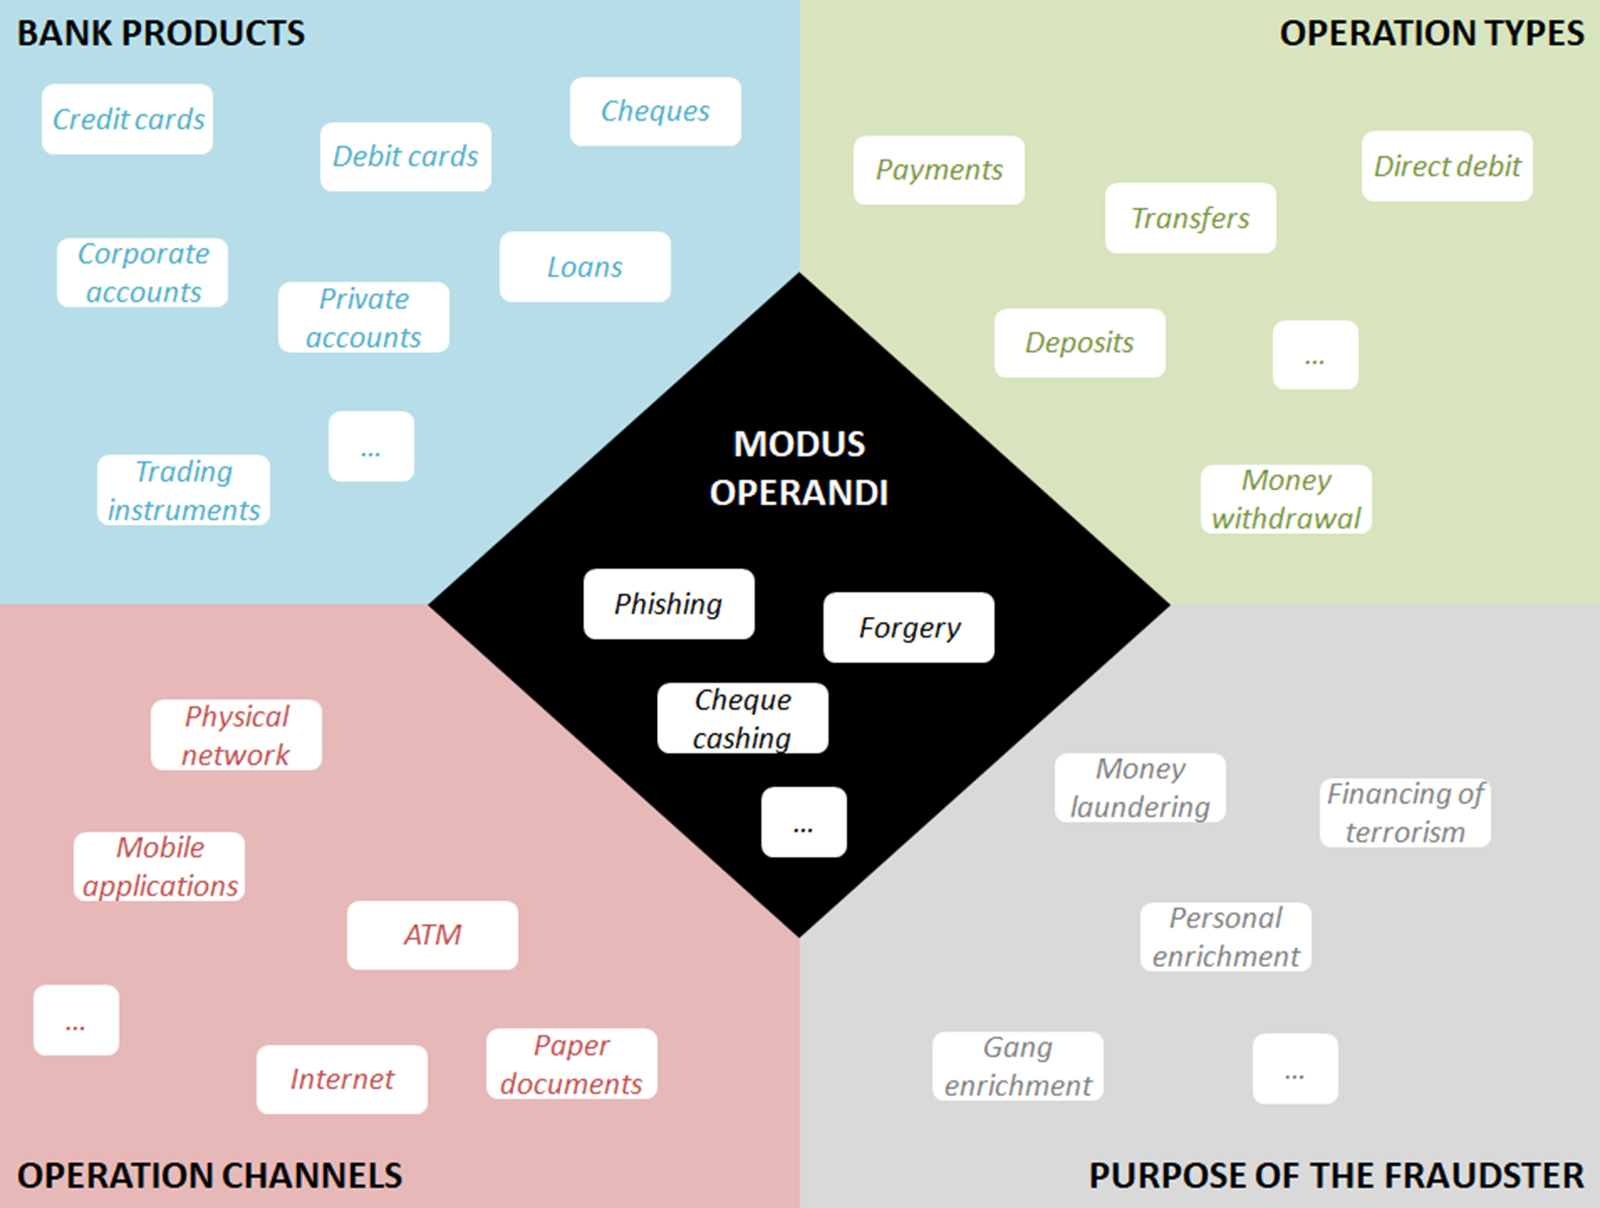
Figure 1. Illustration of fraud dimensions.
2.2. Description of different tasks in fraud management
The global fraud management lifecycle has been described (Wilhelm, Reference Wilhelm2003) as a set of seven steps: deterrence, prevention, detection, mitigation, analysis, policy, investigation, and prosecution. With the pressure from regulators, customers, and cost reduction objectives, the mitigation step must be realized as quickly as possible without slowing down most of the usual operations. This acceleration of the process tends to break down the steps into automatable and human tasks, which can themselves be accelerated by appropriate devices. In the retail banking industry, the process can be simplified to a set of four main tasks (see Figure 2) linked to banking operations: the alerting for operations at risk of fraud, the investigation of issued alerts, the action against suspected fraudsters, and the a posteriori fraud monitoring.

Figure 2. Simplified process of fraud management, its associated tasks and actors.
2.2.1. Task 1: Alerting
The first task is aimed at detecting as fast and precisely as possible a potentially fraudulent operation. Today, as most operations are too voluminous to be processed by hand, the main issue of the alerting is its automation in order to suspend or free the potential fraudulent operation without slowing down the usual operations. For most of them, such as cash withdrawal, credit card payments, check deposit, or online transfers, this task is usually automated as a set of fixed and manually adjustable business rules, and results in the suspension of the operation and the issuing of an alert. However, the accuracy of these alerts for such rare events is often insufficient: the business filters are too tight (fraud passes through the barrier) or too loose (too many operations are suspended, creating customer risk and alert treatment charge).
2.2.2. Task 2: Investigation
The task of investigation, often carried out manually by the back office for each alert, leads to accept the operation despite the alert, or to confirm a suspicion of fraud. The major issue of this task is the acceleration of the human investigation process: the control must concentrate on the riskier operations and quickly confirm the suspicion with explicit arguments, or, inversely, free rapidly less suspicious suspended operations. Fraud experts need for this task to have access to the right and interpretable information for each investigated operation in order to justify the suspicion and the resulting action. The task is strongly constrained by available human resources: the number of alerts that can be properly controlled is limited, and prioritization is very welcome.
2.2.3. Task 3: Action
Upon a suspicion, action must be taken against the potential fraudster: this third task is carried out by the bank or by the appropriate legal authority in order to quickly avoid or limit the impact of a fraud (financial loss, image, etc.). The action can also be needed following the disclosure of a fraud on a transaction that has fallen through the cracks of the previous steps: in fact, most cases of fraud are revealed once they succeeded, but the recorded loss can sometimes be retrieved (litigation, legal action) or recidivism prevented (customer account cancellation, etc.). The action must be ethically justified not only in terms of accusations proving fraud or a strong suspicion, but also in terms of consistency between the potential loss due to a given operation and the cost of the action and previous tasks: in this context, costly action for many low-impact frauds is not acceptable. If this task remains manual, its constraints strongly impact the previous tasks, and some subtasks can appear to be good candidates for moving up the process to accelerate mitigation and avoid manual action.
2.2.4. Task 4: Monitoring
The fourth and final task requires post-hoc analysis to understand the evolution of fraudsters’ behavior and fraud management failures in order to better dissuade and prevent future frauds and to feed a process of continuous improvement of previous tasks: fine tuning the detection model, increasing productivity on the investigation and enhancing actions against the future fraudsters to limit the impact in terms of financial losses, moral, and image prejudice for citizens and for banks. The main issue of this monitoring task, usually remaining manual, is to be flexible enough to adjust to bank product consumption and to capture the quickly changing fraud patterns, particularly when these patterns were not detected on time.
2.2.5. Other tasks
The other tasks related to the FDM consist of usual operation processes as the operation request, acceptance and follow up. These tasks include physical, accounting, managerial, or legal processes, and are tainted by their own specificities in terms of paths and issues depending on the operation dimensions. The main link with the FDM is the opportunity to learn about fraudster behavior in order to better secure the operations for fraud deterrence or prevention (authentication processes, communication, regulation, etc.): this opportunity is an important alternative to the fine tuning of the FDM itself and can be reflected by other automation innovations, excluded from this paper.
2.2.6. Process issues
The total cost of fraud is the sum of the losses associated with criminal operations and false alerts, and investment to guard against them. This investment, technical or human, must remain lower than the expected gains, whether it is preserving margins or not losing customers. According to LexisNexis’ “True Cost of Fraud Study,” fraud costs in financial services from 2017 to 2018 have grown 9.3%, which is more than the revenue growth, especially with the explosion of online and mobile channels. As the problem of task 1 can be recast as a learning problem, numerous approaches (Abdallah et al., Reference Abdallah, Maarof and Zainal2016; Ryman-Tubb et al., Reference Ryman-Tubb, Krause and Garn2018) have been developed to build models that optimize the precision of FDM to enhance or replace business filtering rules. However, the same study underlines that alerting solutions are still underperforming with too many false alerts: one-fourth of fraud costs remain dedicated to manual review, usually measured in full time equivalent (FTE) representing human intervention. In the meantime, these human tasks create the need for model interpretability in order to treat each alert or understand globally the evolution of fraudsters’ behavior. In this context, minimizing false positives in the occurrence of the frauds goes hand in hand with the capacity to take into account the fraud specificities (evolving products on multiple channels, new behaviors and fraud vectors, human processes, legal and ethical issues, etc.) under profit constraint, and the use of machine learning to build the FDM raises several key questions for stakeholders and practitioners. Should the community learn the most explainable models to support tasks 2–4 at the risk that they may be less accurate than the SOTA black box model at task 1, or should the community learn the most accurate black box models before using post-hoc methods to interpret them? Clarifying the trade-off between predictive and descriptive accuracy (Murdoch et al., Reference Murdoch, Singh, Kumbier, Abbasi-Asl and Yu2019; Rudin, Reference Rudin2019) is of major importance in order to provide pragmatic, short-term responses to the actual needs of banks and policy makers.
2.3. Modeling fraud detection and assessing performance
The general principle of an artificial intelligence (AI) for detecting frauds is to either detect them because their characteristics differ from that of most operations (nonfraudulent ones) or to learn a model of fraudulent operations from labeled operations (called examples). From an AI point of view, the first problem may be addressed using unsupervised learning or anomaly detection, the second one using supervised machine learning. But some key issues, consistent with the constraints of the bank products and tasks described above, emerge from various surveys on machine learning for fraud detection. Before describing the SOTA of the methods used to support the automation of these tasks (see next section), we first detail how the quality assessment of an AI-based FDM from a business perspective is linked to performance measure of the associated machine learning tasks, in particular regarding five main issues: the relative rarity of fraud compared to normal operations, the importance of the cost of the fraudulent operations, the difficulty of labeling operations as fraudulent with certainty, the continuously changing nature of fraud, and finally the need of interpretability.
2.3.1. Fraud remains a “rare” event
Among transactions, bank accounts, exchanges or any other fraud targets, most operations will be legitimate (nonfraudulent). Because fraud is so rare, datasets will be extremely biased in favor of nonfraud, which can seriously bias the models that are built from these data sets. The management of imbalanced classes generally requires data or algorithm transformation and the adjustment of precision measures. To illustrate the problem, let us consider that 3% of the transactions are fraudulent (positive). An algorithm that classifies by default all transactions as negatives (nonfraudulent) will have an accuracy of 97% although it does not detect a single fraudulent transaction. To address this issue of imbalanced data, there are various approaches. Confusion matrix, for instance, supports a more appropriate assessment of performances in an imbalanced setting. For a closer look at misclassification different metrics exist that combine the true positives (TP), false positives (FP), and false negatives (FN), ignoring the true negatives (TN) component that drowns out fraud information. These latter are mainly based on Precision (evaluation of the ratio of correct alerts) and Recall (evaluation of the number of fraudulent observations put on alert). Among other metrics, F1-Score, Geo-Mean, or Precision–Recall curve are used to balance the trade-off between both Precision and Recall. The receiver operating characteristic (ROC) curves is also a very popular metric in the field of fraud analytics. A way to compare ROC curves is the area under the ROC curve (AUC) which computes the AUC (Davis and Goadrich, Reference Davis and Goadrich2006). However, Precision–Recall curve and the AUC associated tends to generally better fit imbalanced data (Davis and Goadrich, Reference Davis and Goadrich2006; Saito and Rehmsmeier, Reference Saito and Rehmsmeier2015).
2.3.2. Fraud costs may vary
Frauds account for only a small percentage of operations, and the cost of analysis of each alert can be significant, not to mention the customer risk of erroneously suspending normal operations. This leads to using metrics in machine learning that are cost-sensitive, meaning that they associate different weights to TP, FP, TN, and FN examples. However, in the case of fraud detection, the situation can be much more complex because the fraud cost includes also the financial risk of each operation. Indeed, frequent but low amount frauds, in case of a long-tailed distribution, may not be worth analyzing. Moreover, the fraud financial cost can be defined not only by the operation amount, but also by other criteria, such as a card limit reached after several low operations (Sahin et al., Reference Sahin, Bulkan and Duman2013) or a cash withdrawal amount after a fraudulent cheque deposit. Machine learning approaches rarely distinguish costs of the error according to these varying characteristics of the observations, while this aspect of misclassification can be critical to avoid drowning the signal of high impact frauds by the patterns of more frequent low impact frauds.
2.3.3. Fraud is difficult to label
To learn a model (be it a set of rules, or decision trees or a black box model) from examples, a dataset of examples of both fraudulent and nonfraudulent operations is required. However, because of the difficulty to assert the fraudulent status of operations, the label of the examples used in the associated machine learning task must be used with caution. Some of the operations might be labeled as “not fraudulent” although they are: the fraud will be revealed much later (see unanticipated fraud in Figure 2), or simply no one will ever know because the fraud has gone undetected. In machine learning, this issue of having examples that are wrongly labeled is known under the term of “noise.” From a practical point of view, it means that assessing the error of classification of FDM will require some attention. When a model makes predictions on the label of unseen operations (e.g., labeling Positive the fraudulent and Negative the nonfraudulent), the confidence on both the TN and FP in the confusion matrix is clearly much lower than that of the TP and FN. It impacts the performance measure of the associated learning tasks.
2.3.4. Fraud patterns may quickly change
Fraud management is a fight against professionals who actively seek to subvert the system at its weakest points. They imitate the characteristics and evolution of good customer behavior to make fraudulent operations undetectable (SamanehSorournejad et al., Reference Zojaji, Atani and Monadjemi2016; Choi and Lee, Reference Choi and Lee2018; Dhankhad et al., Reference Dhankhad, Mohammed and Far2018; Achituve et al., Reference Achituve, Kraus and Goldberger2019; Sadgali et al., Reference Sadgali, Sael and Benabbou2019; Shah et al., Reference Shah, Shah, Shetty and Mistry2019; Walke, Reference Walke, Alfaries, Mengash, Yasar and Shakshuki2019), and constantly test for loopholes in the fraud detection system. For the system, it means that the statistical properties of fraudulent and nonfraudulent operations evolve over a certain time. Most of the time, the system adaptation is processed manually: refinement of the rule is triggered when a specialist discovers a new type of fraud modus operandi in his bank or in a concurrent bank (change in input operations), or when he analyses the global FDM performance (global model monitoring). As legacy fraud detection systems often depend on fixed criteria or rules which hardly adapt to complex or new attack patterns (Ryman-Tubb et al., Reference Ryman-Tubb, Krause and Garn2018), AI presents a true interest. However, for an automatic approach, particularly with a traditional supervised algorithm, recognizing old fraud behaviors that have appeared in the learning base is easy, but adapting to new behaviors as they occur is a real challenge: without retraining, the model performance declines rapidly. Furthermore, for voluminous or fast operations, such as credit card transactions, efficient automatic adaptation strategy is essential. A key question for the bank is to balance the frequency of re-training the model with its cost while considering the speed and impact of changes in both the standard and fraudulent behavior.
2.3.5. Fraud must be explained
After the alert is raised, the investigation task (see Figure 2) is required and a justification is needed to help the human to investigate and justify action against the fraudster. This requirement explains why FDM interpretability is expected. The quality with which a model can explain its decision is referred to as “descriptive accuracy” and although more difficult to measure than “predictive accuracy” it represents a key assessment of the quality of the FDM. There are different ways to attain a high descriptive accuracy, either building interpretable models or develop post-hoc procedure that explains decisions from black box models (Yu and Kumbier, Reference Yu and Kumbier2020).
3. SOTA Review of Fraud Detection
Supervised algorithms are commonly applied to predict any given phenomenon. Although they are often applied for fraud detection as the most efficient solution, they should be used with caution in this context because of the specificities of fraud. In this section, we propose the SOTA methods that have been used in machine learning to address specifically the constraints of fraud tasks and associated performance metrics: imbalance data, lack of labeled data, concept drift, and the need for both accuracy and interpretability.
3.1. Dealing with imbalanced data
As seen in Section 2.3.1, one of the specificities of fraud datasets is the strong class imbalance, the “fraud” class representing sometimes less than 1% of the whole dataset. Moreover, there is an overlap of both classes (see Section 2.3.3). These two phenomena therefore make classical supervised machine learning algorithms ineffective. The clue is to give more weight to the minority class either by modifying the data itself or the algorithm used through three possibilities: under-sampling negative observations, over-sampling positive observations, or hybrid methods allowing to combine under- and over-sampling (see Figure 3 and Table A1 in the Appendix for more details).

Figure 3. Summary of solutions to deal with imbalanced data.
Under-sampling consists in removing part of the observations from the majority class. The most basic method consists in removing elements of the majority class in a random way (Batista et al., Reference Batista, Prati and Monard2004). Other methods try to better separate the classes to facilitate the learning of the models. This is the case of near miss and condensed nearest neighbor (CNN; Hart, Reference Hart1968), selecting observations to keep. On the other hand, methods such as Tomek links (Tomek, Reference Tomek1976) and edited nearest neighbors (ENN; Wilson, Reference Wilson1972) try to select observations to remove. The latest methods combine both latter methods. For instance, one sided selection (OSS; Kubat and Matwin, Reference Kubat and Matwin1997) mixes CNN and Tomek links. The neighborhood cleaning rule method (NCL; Laurikkala, Reference Laurikkala, Quaglini, Barahona and Andreassen2001) improves OSS thanks to the ENN method. However, these methods are controversial and have poorer performance than oversampling methods (Batista et al., Reference Batista, Prati and Monard2004).
Conversely, over-sampling aims to generate artificial observations of the minority class. The most basic method consists in duplicating some randomly chosen observations (Batista et al., Reference Batista, Prati and Monard2004), but this method generates overfitting because of the duplicates. The synthetic minority over-sampling technique (SMOTE) method (Chawla et al., Reference Chawla, Bowyer, Hall and Kegelmeyer2002) generates new observations. There are several methods which inherits from SMOTE such as BorderlineSMOTE, KMeansSMOTE, SVMSMOTE, or the well-known adaptive synthetic (ADASYN; He et al., Reference He, Bai, Garcia and Li2008). Finally, new innovative neural networks called generative adversarial networks (GANs) have proven to be effective in over-sampling data of all kinds, including fraudulent data (Fiore et al., Reference Fiore, Santis, Perla, Zanetti and Palmieri2019; Shehnepoor et al., Reference Shehnepoor, Togneri, Liu and Bennamoun2020). As recommended, hybridizing methods can combine both over-sampling and under-sampling, Smote-ENN and SMOTE-Tomek being two main examples (Batista et al., Reference Batista, Prati and Monard2004).
On the other hand, algorithm modification consists in giving more weight to the minority. Firstly, as explained in Section 2.3, it is crucial to adapt performance metrics in order to optimize parameters and assess the validity of the algorithm considering the imbalance of the class. Furthermore, some algorithms (mainly tree structures) take into account the imbalance of the classes as, for instance, SMOTE Boost (Chawla et al., Reference Chawla, Lazarevic, Hall and Bowyer2003), MetaCost (Domingos, Reference Domingos1999), and AdaCost (Fan et al., Reference Fan, Stolfo, Zhang and Chan1999). Another approach is to give more weight to fraudulent observations than to normal observations. This changes the cost function and it is named cost-sensitive learning (Elkan, Reference Elkan2001). The cost of misclassifying fraudulent observations is here globally modified. Hence it cannot respond to the issue of long-tailed costs (see Section 2.3.2) linked to the amount of the operation (local modification of the cost), should it be simple or combined to other factors. One possible solution is to under-sample the dataset thanks to business knowledge, such as: “In general, isolated fraudulent contactless payments of less than 10€ are not worth treating.” This business under-sampling allows us to only focus detection on costly frauds.
When dealing with fraud data, using data level balancing techniques, like SMOTE, tends to be preferred instead of modifying the algorithm (Brennan, Reference Brennan and Hofmann2012; Dal Pozzolo et al., Reference Dal Pozzolo, Caelen, Le Borgne, Waterschoot and Bontempi2014).
3.2. Dealing with the lack of fully trusted labels
Beyond the limits of supervised models on imbalance data, they prove to be even less efficient on poorly labeled phenomena. Indeed, a characteristic of successful fraud is that it has gone unnoticed in history. This means that real fraud datasets often have frauds among the “nonfraudulent” observations. It is therefore recommended, in the case of not fully trusted labeled data, to use anomaly detection methods that are semi-supervised or unsupervised. Figure 4 presents the main algorithms (see full description in Table A2 in the Appendix).

Figure 4. Summary of methods used for anomaly detection.
Semi-supervised algorithms are trained on nonfraudulent observations and then detect abnormal, and therefore potentially fraudulent observations, during the test phase. Among them, the best known is One-class SVM (Schölkopf et al., Reference Schölkopf, Platt, Shawe-Taylor, Smola and Williamson2001). With the advent of neural networks, many neural approaches to semi-supervised learning, such as models based on auto-encoders (Hawkins et al., Reference Hawkins, He, Williams, Baxter, Kambayashi, Winiwarter and Arikawa2002; Aggarwal, Reference Aggarwal2017) have been developed for fraud detection.
Several categories of unsupervised methods coexist. Most methods are linked to the neighborhood of the observations, and can be distance-based, such as k-nearest neighbors (k-NN; Knorr and Ng, Reference Knorr and Ng1998; Ramaswamy et al., Reference Ramaswamy, Rastogi and Shim2000), or density-based, attempting to identify isolated points as anomalies. Among density-based methods, local outlier factor (LOF; Breunig et al., Reference Breunig, Kriegel, Ng and Sander2000) is a local method which was improved to connectivity-based outlier factor (COF; Tang et al., Reference Tang, Chen, Fu, Cheung, Chen, Yu and Liu2002), and isolation forest (Liu et al., Reference Liu, Ting and Zhou2012) uses tree algorithms. Most recent methods are based on other clustering methods aiming to detect anomalies, such as cluster-based local outlier factor (CBLOF; He et al., Reference He, Xu and Deng2003) or density-based spatial clustering of applications with noise (DBSCAN) algorithm (Campello et al., Reference Campello, Moulavi, Zimek and Sander2015). Finally, some well-known categories of unsupervised methods are also used for anomaly detection, including former methods using statistical tests (Rousseeuw and Driessen, Reference Rousseeuw and Driessen1999) or the robust principal component analysis (r-PCA; Candès et al., Reference Candès, Li, Ma and Wright2011), based on dimension reduction.
According to surveys (Kou et al., Reference Kou, Lu, Sirwongwattana and Huang2004), anomaly or outlier detection was one of the main techniques used in credit card fraud detection in 2004 and it was still the case in 2016 (Abdallah et al., Reference Abdallah, Maarof and Zainal2016). This can be explained by the fact that this kind of algorithm can easily handle not only the lack of trusted labels, but also partly answer to the problem of constant fraud evolution: a so-called concept drift problem.
3.3. Dealing with the drifting of frauds
As fraudsters adapt their behavior according to the product and control techniques evolution, the fraud patterns change: this phenomenon, called concept drift, appears when the underlying distribution of target concept depends on hidden contexts (Widmer and Kubat, Reference Widmer and Kubat1994), and results in the need to re-train the model.
Besides anomaly detection described above and manual adaptations through operations or model analysis, seen in Section 2.3.4, partly dealing with the phenomenon, the classifier in supervised models can be continuously updated when new fraudulent operations become available, for example through regular relearning on a sliding window (Dal Pozzolo et al., Reference Dal Pozzolo, Boracchi, Caelen, Alippi and Bontempi2015). For gradually drifting environments, such as bank cheque operations, it is possible then to choose a specific frequency or threshold to re-train the model. It is named offline learning mode (Gama et al., Reference Gama, Žliobaitė, Bifet, Pechenizkiy and Bouchachia2014). However, in contexts of risk of abrupt changes or voluminous and swift operations, such as for credit card transactions, new stakes arise adapt to concept drift, be robust to noise and able to treat recurring contexts (Tsymbal, Reference Tsymbal2004). It is known as stream data and it involves developing online learning solutions (Gama et al., Reference Gama, Žliobaitė, Bifet, Pechenizkiy and Bouchachia2014). All the above re-learning modes are illustrated in Table 1 before developing this last technique.
Table 1. Procedures addressing the concept drift issues in fraud detection.

The easiest way to deal with online learning is to process incremental models. However, those methods, such as Hoeffding trees (Domingos and Hulten, Reference Domingos and Hulten2000), require adapting the model for each new example. In order to use less calculation memory and time, several methods propose to work on a window containing the most recent examples, of fixed or adaptive size, as in FLORA2 (Widmer and Kubat, Reference Widmer and Kubat1994).
To decide whether to learn the model again or not, it is necessary to detect drifts. A lot of statistical tests consist in comparing the statistical distributions such as cumulative sum (CUSUM) (Bissell, Reference Bissell1986) inspired by sequential probability ratio test (SPRT) or former methods such as Shiryae–Roberts test (Shiryaev, Reference Shiryaev1961; Roberts, Reference Roberts1966). More recent models tend to adapt the size of window to compare distributions, ADWIN is one of these examples (Bifet and Gavaldà, Reference Bifet and Gavaldà2007). Afterwards, when the concept drift has been detected, there are several possibilities: learn again the model on complete historical data or on new observations, or use an old context model as in FLORA3 (Widmer and Kubat, Reference Widmer and Kubat1994).
This subject is at stake as more and more areas requisite to work with stream data, and several solutions combining online learning and drift detection have been generally developed (Žliobaitė, Reference Žliobaitė2010; Gama et al., Reference Gama, Žliobaitė, Bifet, Pechenizkiy and Bouchachia2014; Webb et al., Reference Webb, Hyde, Cao, Nguyen and Petitjean2016; Žliobaitė et al., Reference Žliobaitė, Pechenizkiy, Gama, Japkowicz and Stefanowski2016; Lu et al., Reference Lu, Liu, Dong, Gu, Gama and Zhang2019) and adapted to fraud detection (Dal Pozzolo et al., Reference Dal Pozzolo, Caelen, Le Borgne, Waterschoot and Bontempi2014; Dal Pozzolo et al., Reference Dal Pozzolo, Boracchi, Caelen, Alippi and Bontempi2015).
3.4. Dealing with the need of interpretability
As the three latter parts deal with analytical constraints, the last operational requirement, described in Section 2.3.5, is still unresolved: practitioners need interpretable results to act. We identify three main approaches in this direction, as shown in Figure 5: intrinsically interpretable models and post hoc specific or agnostic methods.

Figure 5. Summary of approaches addressing interpretability issues.
Intrinsically interpretable models, such as linear regression, logistic regression, decision trees, general additive models, or combinations of business decision rules, are characterized by their transparency and by a self-explainable structure. They are generally applied for use cases with legal or policy constraints (Zhuang et al., Reference Zhuang, Wang, Bendersky, Grushetsky, Wu, Mitrichev, Sterling, Bell, Ravina and Qian2020), but they may well be not accurate enough for tasks such as fraud detection, which have high financial stakes. This explains why more accurate black box models look appealing as soon as a post hoc interpretability method is applied to provide explanations on either how they work or on their results.
Among these methods, some, called post-hoc specific, are specific to a type of model. Examples of such methods when dealing with sets of decision trees are the classification aggregation tablet scan (CAT scan) (Rao and Potts, Reference Rao and Potts1997) or the feature importance permutation metric (Breiman, Reference Breiman2001). For support vector machines (SVM), nomograms (Jakulin et al., Reference Jakulin, Možina, Demšar, Bratko and Zupan2005) were a new visualization approach. Finally, for neural networks, known for better performances on some problems but also for their interpretation complexity, several specific techniques have been developed such as deep learning important features (DeepLIFT; Shrikumar et al., Reference Shrikumar, Greenside and Kundaje2017) or layer-wise relevance propagation (Bach et al., Reference Bach, Binder, Montavon, Klauschen, Müller and Samek2015). The main disadvantage of the latter is that their use is restricted to a single type of model and it is therefore complicated to compare performances and explanations of several different models.
To counter this disadvantage, post-hoc model-agnostic methods can be used. They can be macro (or global) in order to obtain an overall view of the model to understand it in its entirety, or finer (or local) to study a particular case or observation.
As visualization is one of the most useful tools for interpreting models, visual interpretation approaches have been implemented. The main ones are partial dependence plot (PDP) curves (Friedman, Reference Friedman2001) and accumulated local effect plots (ALE) curves (Apley and Zhu, Reference Apley and Zhu2019) for macro approaches and individual conditional expectation curves (ICE; Goldstein et al., Reference Goldstein, Kapelner, Bleich and Pitkin2014) for local approaches. These methods reveal the effect of a variable within a model. In order to better choose which variables to plot, it is necessary to know which variables have the greatest influence on the prediction and are therefore the most important for the model. For this, the model reliance measure (Fisher et al., Reference Fisher, Rudin and Dominici2019) is the agnostic version of permutation feature importance measure (Breiman, Reference Breiman2001). Moreover, if variables interact with each other in a model, visualizing their effects separately is not enough. Methods, such as interaction strength (Friedman and Popescu, Reference Friedman and Popescu2008) or variable interaction networks (VIN; Hooker, Reference Hooker2004) allow to analyze and interpret the effects of interactions between variables.
Another classic interpretation technique is to use, after a black box model, another more interpretable model. These are the surrogate models, also known as approximation models or metamodels. The best-known local surrogate models are local interpretable model-agnostic explanation (LIME; Ribeiro et al., Reference Ribeiro, Singh and Guestrin2016), model-agnostic hierarchical explanations (MAHE; Tsang et al., Reference Tsang, Sun, Ren and Liu2018), and Shapley additive explanations (SHAP; Lundberg and Lee, Reference Lundberg and Lee2017) as well as all its derivatives: KernelSHAP, SHAP features importance, SHAP summary plot, and SHAP dependence plots (Lundberg et al., Reference Lundberg, Erion and Lee2019). There are also methods based on counter-factual reasoning (Bottou et al., Reference Bottou, Peters, Quiñonero-Candela, Charles, Chickering, Portugaly, Ray, Simard and Snelson2013): “counterfactual examples” that have been shown to be useful (Wachter et al., Reference Wachter, Mittelstadt and Russell2018) and can be easily understood, directly facilitate decisions for a user. They aim at answering the question “how is the prediction modified when the observation changes?” Finally, let us mention the knowledge distillation approach a process that consist in transferring knowledge from a large model (e.g., a deep learning one) to a smaller one, more interpretable (e.g., a decision tree; Hinton et al., Reference Hinton, Vinyals and Dean2015).
In the context of fraud detection, some authors believe that it is necessary to strengthen interpretable models to increase accuracy (Rudin, Reference Rudin2019), while others prefer to use advanced black box models and then apply post-hoc interpretability methods (Weerts et al., Reference Weerts, Ipenburg and Pechenizkiy2019). This opposition brings us to the last issue related to dealing with fraud tasks.
3.5. Dealing with accuracy under constrains
Fraud detection is characterized by financial and operational constraints requiring both precision, and interpretability of the results of the models. This trade-off between precision and interpretability is a key issue in the field of machine learning (Shukla and Tripathi, Reference Shukla and Tripathi2011), where both concepts are considered as “contradictory.” In particular, the most recent techniques such as deep neural networks, are facing “the barrier of explainability” (Arrieta et al., Reference Arrieta, Díaz-Rodríguez, Del Ser, Bennetot, Tabik, Barbado, Garcia, Gil-Lopez, Molina, Benjamins, Chatila and Herrera2020). The opposition between accuracy and interpretability appears in several application fields (Yang and Bang, Reference Yang and Bang2019), and the performance of the most representative models is subject to comparative tests (Sahin, Reference Sahin2020), even if these tests are still being debated (Morde, Reference Morde2019). Indeed, as mentioned in the introduction of this SOTA review, in many cases, traditional supervised models outperform other combinations of methods designed to overcome the specificities of fraud. For instance, random forest (a boosting method based on decision trees), or XGBoost (a gradient boosting type of method), adding layers of boosting to this structure by giving more weight to poorly learned observations, often performs better on fraud data. This trade-off is often schematized as a ranking of the main models along two axes: one accounting for accuracy (x-axis) and the other for interpretability (y-axis; see Figure 6, inspired by the above papers).
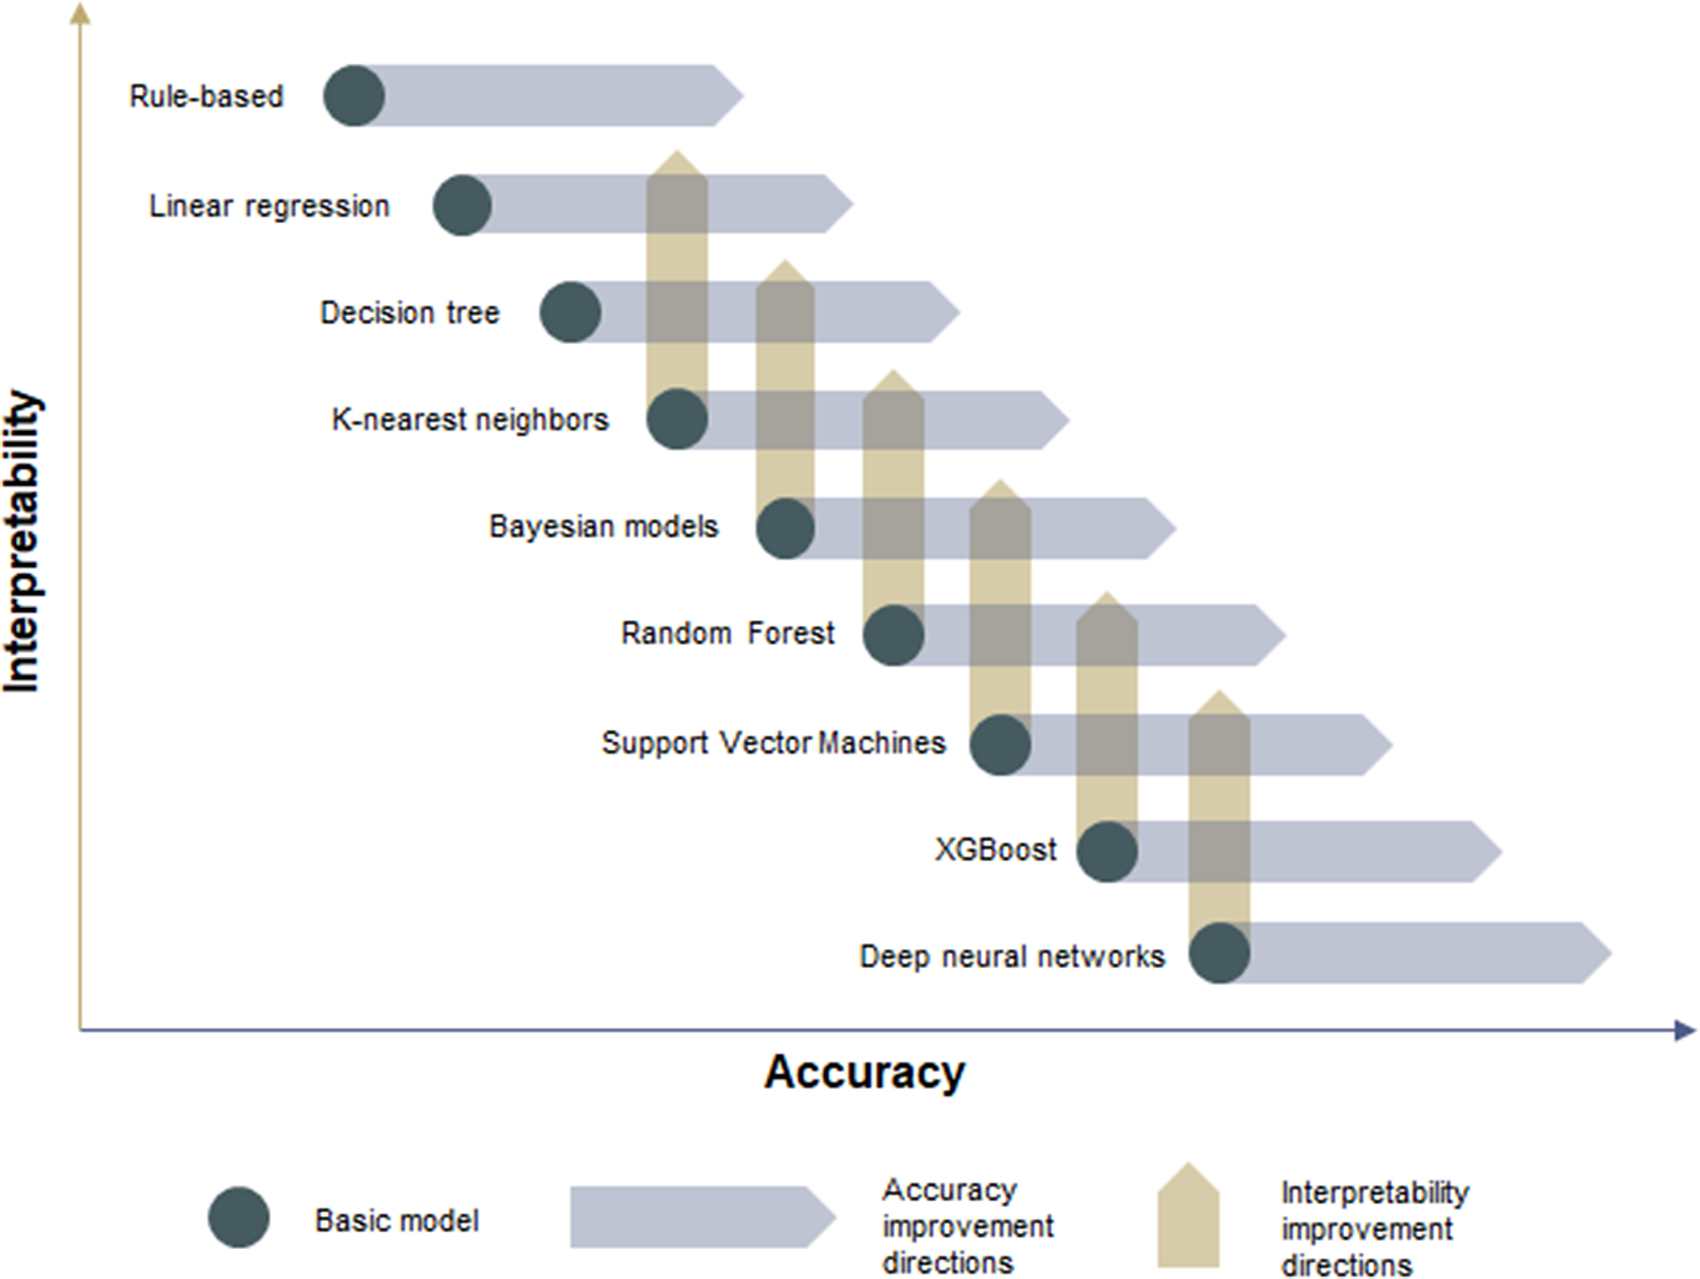
Figure 6. Interpretability vs accuracy trade-off: main models and their improvement directions.
The improvement directions for basic models in Figure 6 illustrate the race between different machine learning tribes (Domingos, Reference Domingos2015), where advocates of black box models (such as deep learning, from the tribe of Connectionnists) try to gain interpretability (yellow arrows), while advocates of interpretable models (Symbolists, Bayesians and Analogyzers), try to gain precision (blue arrows). Only most advanced researchers in both tribes have recently started to call for hybrid methods development (Fridman, Reference Fridman2019). In addition to this possible future reconciliation in the field of machine learning, the comparison between the first generations of automated systems in industry, mainly rule-based, and recent approaches to machine learning have begun to highlight the need for interdisciplinary research in order to better integrate human factors considerations (Lau et al., Reference Lau, Fridman, Borghetti and Lee2018). In the next section, we present a concrete industrial application to deploy FDM in which all constraints mentioned above, including human factors, are considered.
4. Experimentation
The SOTA shed some light on a race for the best technology between black box machine learning models improved by post-hoc interpretation and intrinsic interpretable models boosted to gain accuracy, and the mains analytical streams to deal with other specificities of fraud detection. In this section, we concentrate on a real-world application to experimentally illustrate the differences between these two approaches under operational constraints.
4.1. Experimentation context
The experimentation takes place in the framework of a European project financed by the ERDF, called Cerberus, where two private AI actors had to cooperate to propose innovative solutions for fraud management. The project resulted in the deployment of two solutions, closely related to their application characteristics.
First, an anti-fraud software, carried by the publisher Bleckwen, is developed for instant cash transfer fraud, characterized by high operation frequencies and limited human involvement. This software is based on the improvement of a black box scoring model (XGBoost), resulting in a fraud probability score, completed with a local interpretative overlay: all operations over a given optimal threshold are suspended and must be investigated.
The second solution is an adaptation of the intrinsic interpretable analysis methods based on the Q-Finder algorithm, with proven results in medicine (Amrane et al., Reference Amrane, Civet, Templier, Kang and Figueiredo2015; Zhou et al., Reference Zhou, Watada, Tajima, Berthelot, Kang, Esnault, Shuto, Maegawa and Koya2019), to the world of fraud by consulting firm Quinten. This method generates automatically from historical data optimized business decision rules, as limited combinations of patterns, and classifies the new operations into two categories (fraud or not) as a binary alert. It allows to optimize cheque fraud management, which is characterized by lower volumes and slower human processes (instant operation is not needed as customers accept a several hours delay for this operation). In this second context, an operational combination of both of models (rules generation and fraud scoring) is implemented to explore the benefit of a hybrid approach of the FDM. In the following section, we present the detailed description of this second solution, including the performance achieved and the deployment issues of this promising hybridization.
4.2. Description of the experimentation
The experiment on cheque fraud management followed six main steps, typical of data mining processes such as CRISP_DM (Shearer, Reference Shearer2000; Wirth and Hipp, Reference Wirth and Hipp2000).
4.2.1. Business understanding
The constraint of interpretability emerged quickly in the first step of experimentation. Besides the need to justify action (account suspension, declaration of suspicion to authorities, etc.) and to help human investigation (experts analyze easily a limited number of fraud factors), the process of cheque fraud detection implied different human teams at each step: these teams had to collaborate and share a common understanding of the fraud suspicion factors. The exact business rules applied on the first automated alerting task were known only by three persons: these domain experts modified manually the alert criteria according to their perception of fraud drifting and kept the rules confidential in order to avoid leaks to fraudsters. The process was already operational, with an anti-fraud department able to handle no more than 30 daily alerts with the existing FTE. However, the business rules were still not precise enough: the frauds represented several millions of euros lost per year. The aim of the experimentation was then to optimize the business rules under human resource constraints and fluidify the entire process, from alerting to monitoring.
4.2.2. Data understanding
The data collected for the experimentation included the customer characteristics, the cheque deposit characteristics and their dynamic, the other main transactions dynamics, the historical frauds and several other confidential data sources. The collected data represented 85 tables from 5 different sources and covered the period from October 2018 à September 2019. This represented over 16,000,000 historical cheques. All the collected variables, that is more than 200, were clarified in terms of meaning and structure, and qualified following the documentation framework Databook (Nesvijevskaia, Reference Nesvijevskaia2021). After this qualification work, the scope of the data was filtered to only those cheques that were usable and suitable for the analyses.
4.2.3. Data preparation
The data sources were iteratively and collaboratively structured into a matrix through feature engineering representing 343,609 historical cheque deposits characterized by 300 patterns calculated from the source variables. Only 130 of these patterns were considered relevant after discussions with the business experts and removal of redundancies. These patterns were used in the modeling phase and classified into 12 categories to facilitate the interpretation of the results. Historical frauds with confirmed financial impacts were manually reconstructed for the analyses. Moreover, all operations under a certain business-defined amount were excluded at this preprocessing stage as not worth investigating: this treatment avoids drawing the characteristics of heavy frauds by those of frequent frauds, and, simultaneously, generates an under-sampling of nonfraudulent operations. The rare fraud phenomenon represented 0.1% of the cheque deposits. The final learning matrix was split into 9 months of historical data to train the models and 3 months to have a test set. The train test was divided into three folds stratified on fraudulent clients in order to optimize random forest model.
4.2.4. Modeling
The hybrid method targets the completing or replacement of business rules by optimized rules, and the combination of this optimized rules with an online-learning scoring.
For this, Quinten’s method using the Q-Finder algorithm generates many intersected rules to detect the phenomenon of costly fraud. The advantages are that the fraud coverage by the rules is very good and that the variables involved in each rule are co-constructed through features engineering with the business experts to ensure easy interpretability. However, at this stage the approach generates a set of rules with too many false positives, which can lead to customer dissatisfaction and to an inability to deal with all the alerts by the anti-fraud department. Thus, an optimal combination of rules is created in order to reduce the number of false positives and maintain good coverage: for this, an F-beta score is used with, for example, beta equal to 3 to give more weight to the Recall.
This rule generation model is hybridized in a second step with a black box score model developed in parallel on all the operations. This scoring model is intended to be applied after the rules, so that all alerts can be prioritized by the score. This prioritization speeds up the work of the fraud experts without deteriorating the intelligible explanation of the fraud. If the number of alerts punctually creates an investigative workload that is even less than the capacity of the dedicated human resources, the set of rules can be completed with an additional rule corresponding to the operations with a score over a very high threshold: in this case, only this part of alerts, as a complementary “scoring rule,” is harder to interpret, but the coverage of the fraud is enhanced for available human resources.
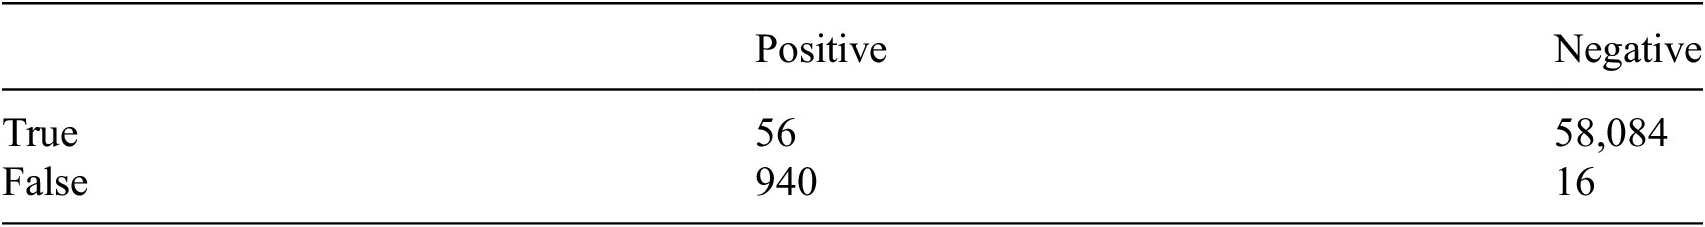
At this stage, the statistical assessment of the accuracy of the model was a Precision of 5.6% and a Recall of 77.8% on the test set, calculated on the basis of the confusion matrix presented in Table 2.
Table 2. Confusion matrix on the test set.

Furthermore, as one of the main characteristics of fraud is the concept drift, the rules may no longer be accurate after a certain time of changes in fraudsters behavior. To get around this problem, the black box model is enhanced with online learning, thus the addition of a rule based on the score model threshold maintains the efficiency of the FDM by detecting new fraudster behaviors. Most of the operations in alert will then have an explanation given by the business rules, the others will correspond to new fraud techniques not learned yet by the rules. These alerts will require more investigation time from the fraud experts because they will not have a business explanation that can be quickly understood. When the number of alerts not explained by the business rules starts to be too high, new optimized rules must be learned from on the recent data: this statistical-economic equilibrium is closely followed as part of the monitoring task. A new business investigation will help to understand where these new frauds come from thanks to the new rules created, optimize fraud deterrence and prevention if possible, and finetune the FDM. During all the lifecycle, only exceptional frauds would have passed under the radar: these outliers did not appear to be economically pertinent to detect. At this stage, the articulation of the optimized rules and the online-learning score is ready for business evaluation.
4.2.5. Evaluation
As the decision to deploy the solution is based more on business performance indicators than on statistical ones, here are some synthetic results obtained using data from Quinten’s partner about cheque fraud. For reasons of confidentiality, only the numbers of fraud cases detected will be reported, although the amounts were part of the analysis. On Figure 7, we can see that most of the fraudulent operations detected each month by a score with a threshold at 50% are also detected by the rules, so the use of interpretable models can be easily privileged for operational reasons: prioritize by the scoring model and explained by the rules. Moreover, the combination of the two models gives better results while adding only a limited number of daily alerts, as shown on Figure 8. In this example, the last month’s frauds are not observed for the moment: the rules are still functional alone.

Figure 7. Number of true fraud cases detected over 1 year.

Figure 8. Average number of alerts per day over 1 year.
This hybridization thus answers key issues defined during the business understanding and was judged as immediately operational and very promising by the first banking partners.
4.2.6. Deployment
The solution, covering all the tasks of fraud management mentioned in Section 2.2 and resumed in Table 3, is being deployed in association with two user interfaces designed for the collaborative investigation and the monitoring tasks. If further model optimization seems tempting, such as the interpretative overlaying model on the “score rule” alerts or a complementary outlier model for new fraud trends, other considerations appear as much more pragmatic, such as fraud perimeter enlargement, an automatic link to the bank accountability in order to accelerate the action task (treatment of the most suspicious operations and release of the less suspicious suspended operations), or simply data skills transfer to fraud experts. Under investment constraints, these pragmatic considerations remind that the “performance” of such AI devices are far from being solely statistical.
Table 3. Synthesis of the answers of the hybrid fraud detection model (FDM) to fraud management task issues.

5. Conclusion
Humans are in the loop in many business processes in banking, as is fraud detection. Just as the task of classifying a tumour is only one aspect of a dermatologist’s work, identifying a potential fraud is only one step in a more complex fraud management process. Human processes of evaluation and action against the fraudster makes it difficult to simply compare machine learning algorithms on their performance or explanatory power outside of their use by the practitioner. In the field of fraud detection, although rule-based approaches remain the standard in banks, data-based rule learning approaches can be used to reach much better performance. Furthermore, some tasks of the fraud management can be optimized with black box models, as soon as an explanation of the decision is not required for the investigation or for a legal action against the fraudster. While the question of which approach will give the best answer is still open, we showed on a practical example that it is possible in the meantime to hybridize both approaches to develop improved solutions for the complete fraud management process.
Abbreviations
- FDM
-
fraud detection model
- FN
-
false negatives
- FN
-
false negatives
- FP
-
false positives
- FTE
-
full time equivalent
- SOTA
-
state-of-the-art
- TN
-
true negatives
- TP
-
true positives
Acknowledgments
The authors are grateful for the support provided by Quinten, for colleagues’ reviews and for the careful rereading of the final English version, as well as for the long collaboration with Bleckwen, ERDF, and our partner Banque Populaire Rives de Paris who shared their data and business expertise. We would also like to thank the Data for Policy organization team for their kind advices for the conference preparation (submission #35, DOI:10.5281/zenodo.3967821).
Funding Statement
This research was supported by ERDF under research grants, exclusively covering the mobilized human resources, in the framework of a European project to propose innovative solutions for fraud management. The funder had no role in study design, data collection and analysis, decision to publish, or preparation of the manuscript.
Competing Interests
Anna Nesvijevskaia, Sophie Ouillade, and Pauline Guilmin are employed at company Quinten, part of a consortium with Bleckwen who received grant from ERDF. Jean-Daniel Zucker declares none.
Data Availability Statement
The data that support the findings of this study are available from Quinten’s partner Banque Populaire Rives de Paris. For reasons of confidentiality, we cannot provide these data.
Author Contributions
Conceptualization, A.N. and J.-D.Z.; Methodology, A.N. and J.-D.Z.; Investigation, A.N., J.-D.Z., S.O., and P.G.; Validation, A.N.; Writing-original draft, A.N., J.-D.Z., S.O., and P.G.; Writing-review & editing, A.N., J.-D.Z., S.O., and P.G.; Visualization, A.N., S.O., and P.G.; Supervision, A.N.; Funding acquisition, A.N.; Project administration, A.N. and S.O.; Software, S.O. and P.G.; Formal analysis, S.O. and P.G.; Data curation, S.O. and P.G. All authors approved the final submitted draft.
Appendix
Table A1. Solutions to deal with imbalanced data.

Abbreviations: ADASYN, adaptive synthetic; CNN, condensed nearest neighbor; ENN, edited nearest neighbors; GAN, generative adversarial network; NCL, neighborhood cleaning rule; OSS, one sided selection; SMOTE, synthetic minority over-sampling technique.
Table A2. Methods used for anomaly detection.

Abbreviations: CBLOF, cluster-based local outlier factor; COF, connectivity-based outlier factor; DBSCAN, density-based spatial clustering of applications with noise; k-NN, k-nearest neighbors; LOF, local outlier factor; r-PCA, robust principal component analysis; SVM, support vector machines.


 Open access
Comments
No Comments have been published for this article.