


Policy Significance Statement
The study provides granular insights into the prevalence of gender and racial disparities in federal procurement and offers two key recommendations for the U.S. federal government. First, the empirical findings identify specific product and service categories of contracts in which additional efforts are needed to increase the representation of WOBs, MOBs, and different types of MOBs. Second, the findings emphasize the need to move away from the practice of grouping different types of MOBs under a single category and establish more granular socioeconomic contracting goals that takes into account within-minority disparities in federal procurement.
1. Introduction
The U.S. federal government is the world’s largest buyer and spends billions of dollars annually to purchase a variety of products and services, ranging from paper clips to military aircraft. In fiscal year 2021, the federal government awarded USD 637 billion as contracts to purchase products and services from external businesses (GAO, 2022). Given the magnitude of this spending, federal contracts provide a unique opportunity to invest in the nation’s businesses, particularly in women-owned businesses (WOBs) and minority-owned businesses (MOBs).
Despite the presence of legislative mandates to award a certain percentage of federal contracting dollars to WOBs and MOBs, these businesses have traditionally received a smaller share of federal contracts (The White House, 2021; McSwigan, Reference McSwigan2022), in comparison to their overall representation in the U.S. economy. Of the USD 637 billion that were awarded as federal contracts in fiscal year 2021, WOBs and MOBs received only USD 26.2 billion (4.11%) and USD 62.4 billion (9.79%) in federal contracts, respectively, despite comprising almost one-fifth of the total number of businesses in the U.S. economy (US Small Business Administration, 2021; US Census Bureau, 2022).
In this regard, existing studies analyzing the representation of WOBs and MOBs in federal procurement are at the individual agency level (SBA, 2023b). Yet, most decisions that impact the representation of these businesses in federal procurement happen at the contract level. Therefore, agency-level analyses may provide inadequate insights about materially actionable differences into the representation of WOBs and MOBs across different types of federal contracts.
Our study undertakes a data-driven approach to provide a more granular examination of the under-representation of WOBs and MOBs in federal contracts. In particular, we examine the representation of WOBs, MOBs, and different types of MOBs (namely, American Indian/Alaskan Native [AI/AN], Asian, Black, and Hispanic) in contracts with varying levels of science, technology, engineering, and mathematics (STEM) intensive work and across 19 categories of products and services purchased by the federal government.
The extent to which contracts include STEM-intensive work is interesting for the following reasons. First, although the under-representation of women and racial minorities in STEM occupations is well-documented (Baird et al., Reference Baird, Ko, Gahlawat, Lara and Hood2023; National Academies of Sciences, Engineering and Medicine, 2023; NSF, 2023), whether businesses owned by these demographic groups are underrepresented in STEM-intensive contracts remains an under-explored topic. Our study represents a concerted effort in this direction. Second, as the median annual wage of STEM occupations (USD 97,980) is more than double that of non-STEM occupations (USD 44,670) (Bureau of Labor Statistics, 2023), uncovering potential gender and racial disparities in STEM-intensive contracts represents an important first step toward building wealth in these underserved demographic groups. Finally, STEM-intensive contracts represent an important source of innovation and technological progress for the federal government, and an examination of the representation of WOBs and MOBs in these contracts deepens our understanding of the contributions of these business types in advancing the federal government’s scientific and technological goals.
2. Data and sample
2.1. Data collection
To conduct the empirical analysis, we collect data on the characteristics of federal contracts and the businesses that receive these contracts from USAspending.gov (USAspending, 2021). This website contains detailed information on every federal contract, grant, loan, or other financial assistance that is awarded by the federal government and its primary purpose is to “show the American public what the federal government spends every year and how it spends the money.” We obtain information on our dependent variables (namely, WOB, MOB, and different types of MOB), independent variable (namely, product or service category), and contract-level control variables (namely, contract value, duration, number of offers, set-aside status, oversight level, agency awarding a contract, state where a contract is awarded, year and month of awarding a contract) from USAspending.gov.
The data on federal contracts are merged with four other data sources. First, the Occupational Employment and Wage Statistics survey (Bureau of Labor Statistics, 2021) provides information on the proportion of employees in STEM occupations in an industry which is used to measure the independent variable STEM Intensity. This dataset also provides information on each industry’s median pay level. Second, the American Community Survey (ACS; ACS, 2021) provides information on county-level socioeconomic characteristics (namely, a county’s median household income, median age, labor force participation rate, proportion of a county’s population that is female, non-U.S. citizens, AI/AN, Asian, Black, Hispanic, White, and has bachelors degree). We control for these socioeconomic characteristics in our regression models as county-level socioeconomic characteristics may influence a contract’s likelihood to be awarded to WOBs and MOBs. Third, the MIT Election Lab (MIT Election Data and Science Lab, 2021)Footnote 1 provides information on county-level Biden margin in the 2020 U.S. Presidential elections. We control for this variable as a county’s political leaning may influence a contract’s likelihood to be awarded to WOBs and MOBs. Finally, the PSC Manual (GSA Federal Acquisition Service, 2022) provides information to map Product and Service Codes (PSC) to a contract’s product and service category. The data and code used for data cleaning and analysis are available at https://osf.io/n34ur/?view_only=b993d805907e4827b8a584cf29d3acac.
2.2. Data processing
From USAspending.gov (USAspending, 2021), we downloaded information on 1,798,864 federal contracts that were awarded between January 2019 and September 2021 and for which we could identify the unique contractor firm receiving the contract. We downloaded contract data from January 2019 as information on the independent variable, STEM Intensity, was available only from 2019 (Bureau of Labor Statistics, 2021). As the federal government’s fiscal year begins in October of a calendar year and ends in September of the next calendar year, we downloaded data on contracts that were awarded until September 2021. We merge data on federal contracts with the ACS and election outcome data using the county where a contract was awarded, with the STEM employment data using 4-digit North American Industry Classification System (NAICS) code associated with a contract, and with the PSC manual using a contract’s product or service category.
From this initial sample of 1,798,864 contracts, we excluded (a) 27,385 contracts (1.52%) that were not fixed-price contracts, (b) 75,841 contracts (4.2%) with a missing contract-level control variable, (c) 4,827 contracts (0.27%) that were awarded outside 50 U.S. states and the District of Columbia (DC), (d) 76,707 contracts (4.3%) that were awarded to another federal or state or county or city government agency, (e) 22 contracts that were awarded in re-classified Alaska counties for which we were unable to retrieve the socioeconomic county characteristics from the ACS 5-year estimates (ACS, 2021) and Biden margin (MIT Election Data and Science Lab, 2021), (f) 1 contract with missing contract start date, (g) 5,785 contracts (0.32%) with negative contract amount values,Footnote 2 (h) 20,441 contracts (1.1%) with a planned duration of 0 or less, and (i) 7,278 contracts (0.4%) that were in a county, and/or were associated with a 4-digit NAICS code, and/or were awarded by an agency with fewer than 30 observations in the sample. The final sample contains 1,551,610 contracts.
3. Regression model
All the dependent variables in our study are binary in nature (0/1). As a linear regression model assumes a linear relationship between independent variables and the dependent variable and may provide predicted values of the dependent variable beyond the (0,1) range, we use a logistic regression model which is better suited to handle binary dependent variables.Footnote 3 Specifically, we estimate a logistic regression model of the form:
 $$ {DV}_i=f\left({\beta}_1 STEM\ Intensity+\gamma PSC+{X}_i+{\alpha}_j+{\eta}_s+{\delta}_t^M+{\delta}_t^Y+{\unicode{x025B}}_i\right), $$
where
 $ f $
is the logistic function,
$ f $
is the logistic function,
 $ DV $
is one of six dependent variables as explained in Section 3.1,
$ DV $
is one of six dependent variables as explained in Section 3.1,
 $ STEM\ Intensity $
and
$ STEM\ Intensity $
and
 $ PSC $
are focal independent variables as described in Section 3.2,
$ PSC $
are focal independent variables as described in Section 3.2,
 $ {X}_i $
represents a number of contract- and county-level control variables as described in Sections 3.3.1 and 3.3.2, and
$ {X}_i $
represents a number of contract- and county-level control variables as described in Sections 3.3.1 and 3.3.2, and
 $ {\alpha}_j, $
 $ {\eta}_s $
,
$ {\eta}_s $
,
 $ {\delta}_t^M $
, and
$ {\delta}_t^M $
, and
 $ {\delta}_t^Y $
are dummy variables at the agency, state, month, and year levels as explained in Section 3.3.3. Standard errors are clustered at the county level.
$ {\delta}_t^Y $
are dummy variables at the agency, state, month, and year levels as explained in Section 3.3.3. Standard errors are clustered at the county level.
3.1. Dependent variables
As noted in Section 2.2, USAspending.gov provides us with detailed information on the businesses that receive contracts from the U.S. federal government. As we are interested in examining the representation of WOB, MOB, and different types of MOBs in federal contracts, our study includes the following six dependent variables:
-
1. Women-Owned Business or WOB. Coded as 1 if a business is 51% or more owned by women, and as 0 otherwise.
-
2. Minority-Owned Business or MOB. Coded as 1 if a business is 51% or more owned by Alaskan Native/American Indian (AI/AN), Asian, Black or Hispanic identifying individual(s), and as 0 otherwise.
-
3. AI/AN-Owned Business. Coded as 1 if a business is 51% or more owned by AI/AN identifying individual(s), and as 0 otherwise.
-
4. Asian-Owned Business. Coded as 1 if a business is 51% or more owned by Asian identifying individual(s), and as 0 otherwise.
-
5. Black-Owned Business. Coded as 1 if a business is 51% or more owned by Black identifying individual(s), and as 0 otherwise.
-
6. Hispanic-Owned Business. Coded as 1 if a business is 51% or more owned by Hispanic identifying individual(s), and as 0 otherwise.
3.2. Independent variables
We examine two key independent variables in this study, namely, STEM Intensity and Product or Service Category of a contract. Below, we discuss the measurement of each variable:
-
1. STEM Intensity. Each contract awarded by the federal government is associated with a NAICS industry code. The proportion of employees that are employed in STEM-designated occupations in each NAICS industry code is obtained from Occupational Employment Statistics survey of the Bureau of Labor Statistics (2021). Using a contract’s NAICS industry code, we identify the proportion of employees in the contract’s industry who are employed in STEM-designated occupations and use this variable to measure for each contract’s STEM intensity. This data on the proportion of employees in STEM-designated occupations in an industry are available only from 2019.
-
2. Product or Service Category. Each federal contract is associated with one of the 19 different categories of product or service that the federal government purchases. These product or service categories include (a) research and development, (b) information technology, (c) miscellaneous supplies and equipment, (d) sustainment supplies and equipment, (e) professional services, (f) human capital, (g) weapons and ammunition, (h) security and protection, (i) aircraft, ships/submarines, and land vehicles, (j) electronic and communication equipment, (k) office management, (l) electronic and communication services, (m) medical, (n) industrial products and services, (o) equipment related services, (p) facilities and construction, (q) transportation and logistics services, (r) clothing, textiles and subsistence supplies and equipment, and (s) travel and lodging. Furthermore, each product or service category is associated with one or more than one NAICS industry code.
3.3. Control variables
In all our regression models, we control for several different contract-level characteristics and socioeconomic characteristics of the counties where a contract is awarded. We also control for the Biden margin in the 2020 Presidential elections and include federal agency, state, year, and month fixed effects. Below, we discuss the measurement of each control variable:
3.3.1. Contract-level control variables
-
1. Contract Value. Measures the planned cost (in USD) to execute a contract.
-
2. Contract Duration. Measures the planned duration (in days) to execute a contract. Specifically, contract duration is measured by subtracting a contract’s planned start date from its planned end date.
-
3. Oversight Level. Measures the level of oversight associated with a contract. For example, a contract’s oversight level may be high if the federal government engages in proactive monitoring of the contract’s performance through periodic audits and reviews. This variable is coded as 1 if the contract is subjected to a high oversight level, and as 0 otherwise.
-
4. Number of Offers. Measures the number of businesses that competed for a contract.
-
5. Set-Aside Status. Indicates whether a contract is awarded as a part of the set-aside program. Only small businesses or specific categories of small businesses can compete for contracts awarded through the set-aside program. This variable is measured as 1 if the contract was awarded as a part of the set-aside program, and as 0 otherwise.
3.3.2. County-level control variables
-
1. Median Household Income. Measures the median household income (in USD) of the county where a contract is awarded.
-
2. Median Age. Measures the median age (in years) of the county where a contract is awarded.
-
3. Population with Undergraduate Degree. Measures the proportion of the county’s population with an undergraduate degree.
-
4. Labor Force Participation Rate. Measures the proportion of the total 16 years and over population that is in the labor force in the county where a contract is awarded.
-
5. Proportion U.S. Citizens. Measures the proportion of the county’s population that are U.S. citizens either by birth or by naturalization.
-
6. Racial Composition. Measures the proportion of the county’s population that identify as AI/AN, Asian, Black, and Hispanic.
-
7. 2020 Biden Margin. Measures the percentage difference in the proportion of votes received by Biden and his nearest rival in the 2020 Presidential elections in the county where a contract is awarded.
3.3.3. Fixed-effects (included as dummy variables)
-
1. Federal Agency. Represents the 58 different federal government agencies that award a contract in our sample.
-
2. State. Represents the 50 U.S. states and DC where a contract is awarded.
-
3. Year. Represents the year in which a contract is awarded.
-
4. Month. Represents the month in which a contract is awarded.
4. Results
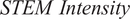
Our analysis uses granular data on 1,551,610 contracts awarded by 58 federal government agencies between 2019 and 2021 across 50 U.S. states and DC. Figure 1 presents model-free evidence showing that both WOBs and MOBs receive a lower proportion of contracts with higher levels of STEM intensity. A similar pattern can also be observed across the four types of MOBs.
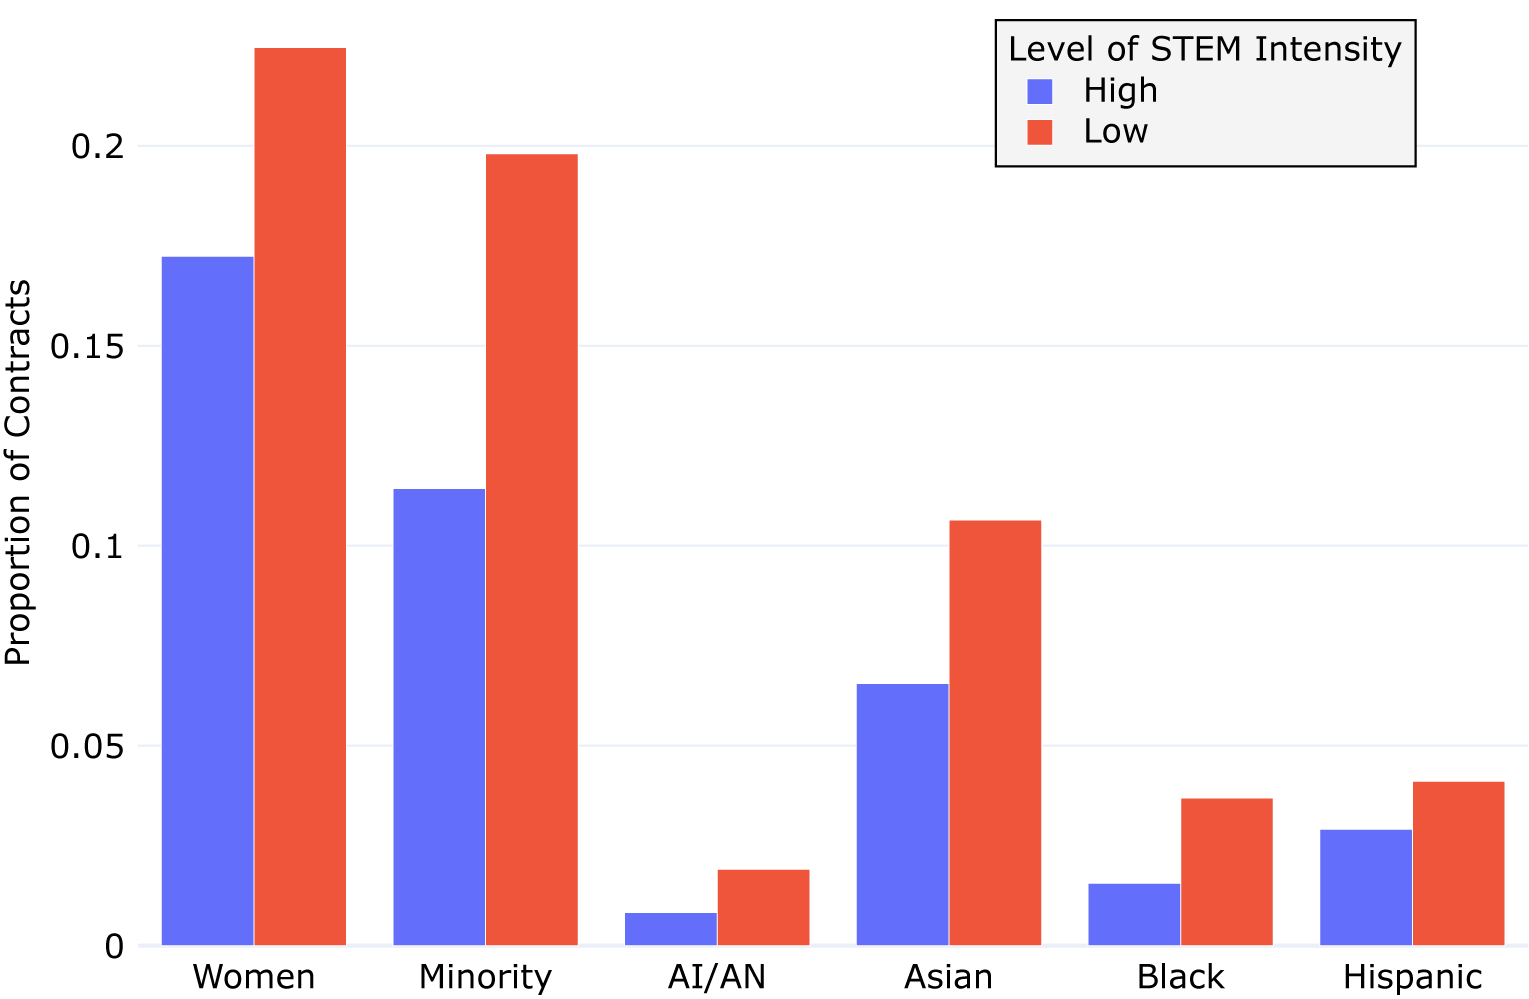
Figure 1. Proportion of contracts awarded to WOBs, MOBs and different types of MOBs, broken down by STEM intensity.
Having shown model-free evidence, we now employ logistic regression models to estimate the relationship between a contract’s STEM intensity, product or service category, and the likelihood for the contract to be awarded to WOBs, MOBs and the four types of MOBs. All the regression models include a comprehensive set of control variables as noted in Section 3.3. Table 1 shows the regression results. Below, we present the results visually for ease of interpretation.
Table 1. Logistic regression results
* p < 0.05; ** p < 0.01; *** p < 0.001. Standard errors in parentheses are clustered at the county level.
4.1. STEM-intensive federal contracts
Figure 2, which presents coefficient plots from the logistic regressions with 95% confidence intervals, shows that the coefficient on STEM intensity is negative and statistically significant for both WOB (
 $ \beta =-1.25;p<0.05 $
) and MOB (
$ \beta =-1.25;p<0.05 $
) and MOB (
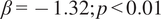 $ \beta =-1.32;p<0.01 $
). As we use logistic regression models, we convert the coefficients into odds ratios, which helps in more meaningful comparison of these coefficients. Specifically, the estimates of 1.25 and 1.32 correspond to an odds ratio of 3.5 (
$ \beta =-1.32;p<0.01 $
). As we use logistic regression models, we convert the coefficients into odds ratios, which helps in more meaningful comparison of these coefficients. Specifically, the estimates of 1.25 and 1.32 correspond to an odds ratio of 3.5 (
 $ {e}^{-1.25}=-3.5 $
) and 3.7 (
$ {e}^{-1.25}=-3.5 $
) and 3.7 (
 $ {e}^{-1.32}=-3.7 $
), respectively, suggesting that when the STEM intensity of a contract increases by one SD, the contract is 3.5 times less likely to be awarded to WOBs and 3.7 times less likely to be awarded to MOBs.
$ {e}^{-1.32}=-3.7 $
), respectively, suggesting that when the STEM intensity of a contract increases by one SD, the contract is 3.5 times less likely to be awarded to WOBs and 3.7 times less likely to be awarded to MOBs.
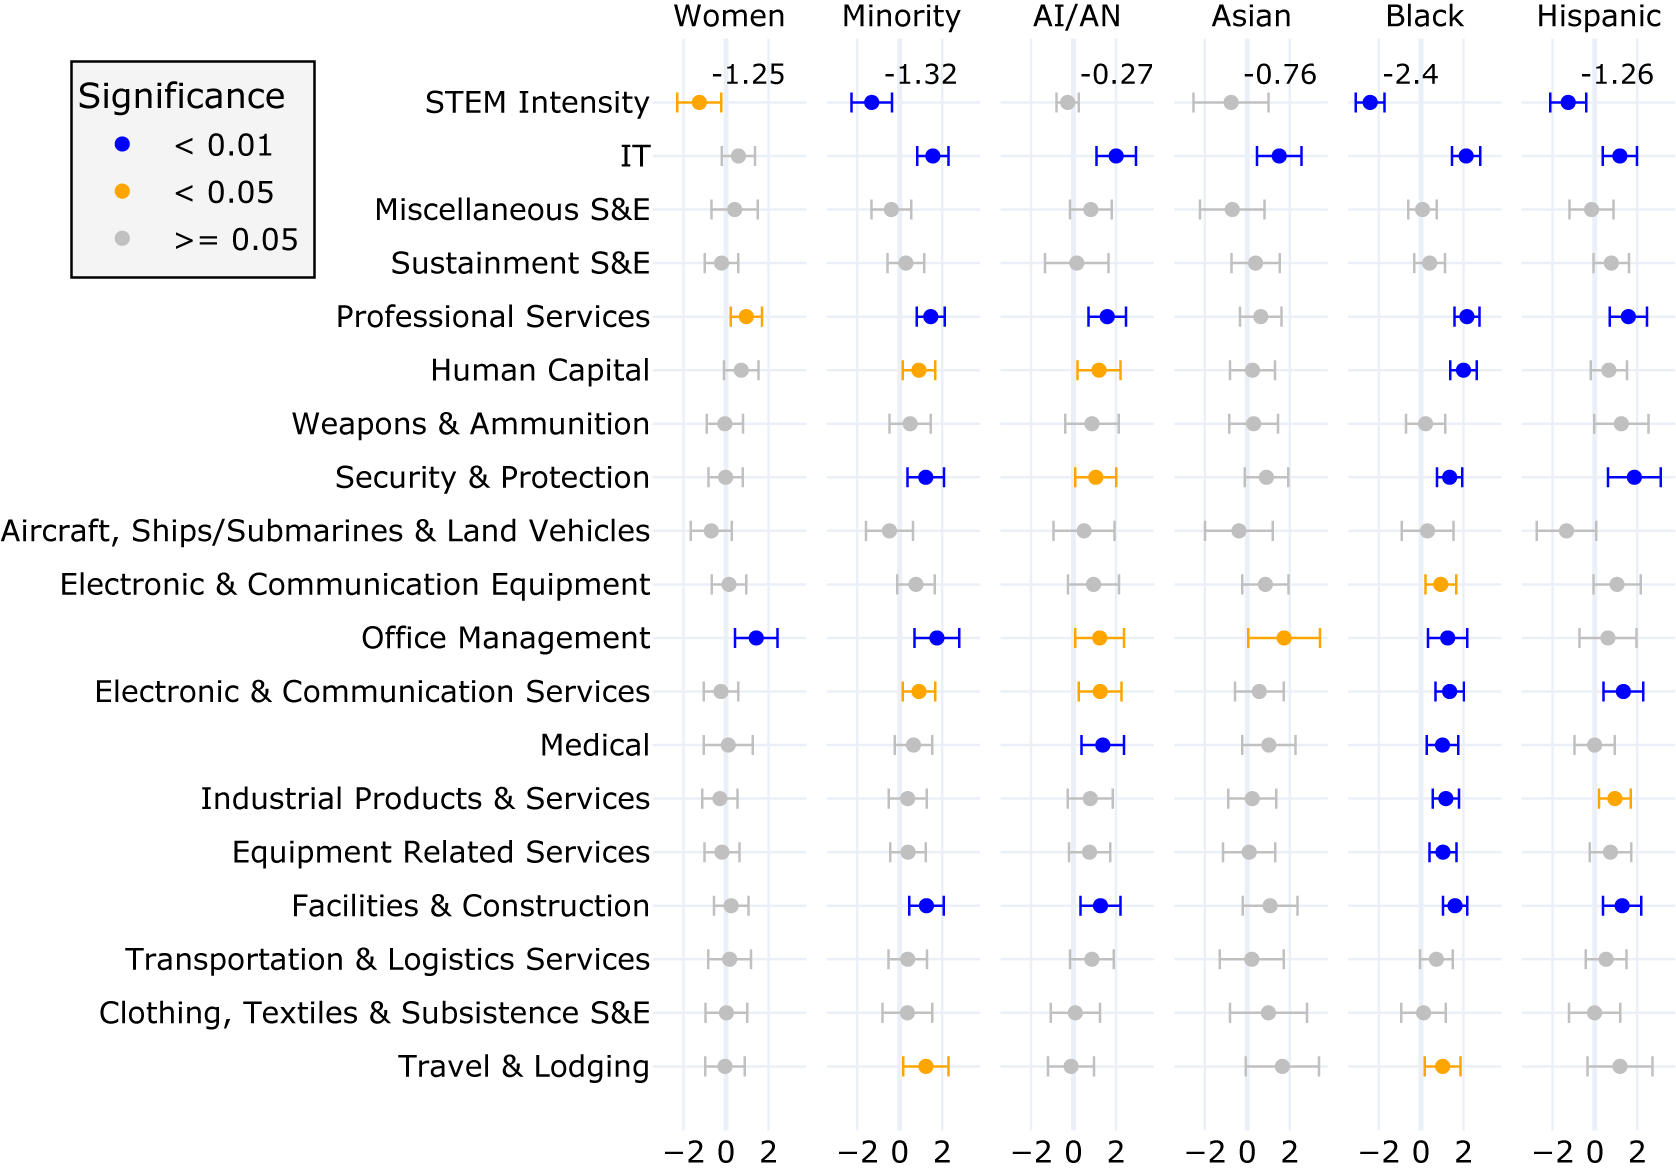
Figure 2. Estimates and 95% confidence bars for STEM intensity and product and service categories. Logistic regression models are estimated using standard errors clustered at the county level.
While contracts with higher levels of STEM intensity are associated with a lower likelihood of being awarded to MOBs, this finding is not uniform across different types of MOBs. Specifically, Figure 2 shows that when a contract’s STEM intensity increases by one SD, the contract is 10.9 (
 $ \beta =-2.40 $
; odds ratio = 10.9;
$ \beta =-2.40 $
; odds ratio = 10.9;
 $ p<0.05 $
) and 3.5 times (
$ p<0.05 $
) and 3.5 times (
 $ \beta =-1.26 $
; odds ratio = 3.5;
$ \beta =-1.26 $
; odds ratio = 3.5;
 $ p<0.05 $
) less likely to be awarded to Black-, and Hispanic-owned businesses, respectively. However, no statistically significant association is observed between a contract’s STEM intensity and the likelihood for it to be awarded to Asian-, or AI/AN-owned businesses. These results suggest that among MOBs, Black-, and Hispanic-owned businesses are the least likely to receive STEM-intensive contracts, which aligns with previous reports on the under-representation of these specific demographic groups in STEM fields (Fry et al., Reference Fry, Kennedy and Funk2021; National Academies of Sciences, Engineering and Medicine, 2023; NSF, 2023).
$ p<0.05 $
) less likely to be awarded to Black-, and Hispanic-owned businesses, respectively. However, no statistically significant association is observed between a contract’s STEM intensity and the likelihood for it to be awarded to Asian-, or AI/AN-owned businesses. These results suggest that among MOBs, Black-, and Hispanic-owned businesses are the least likely to receive STEM-intensive contracts, which aligns with previous reports on the under-representation of these specific demographic groups in STEM fields (Fry et al., Reference Fry, Kennedy and Funk2021; National Academies of Sciences, Engineering and Medicine, 2023; NSF, 2023).
4.2. Different product and service categories of federal contracts
Figure 2 also shows that substantial heterogeneity exists in the representation of WOBs and MOBs across the product or service category associated with a contract. The categories of contracts are presented in decreasing order of their average median pay levels.Footnote 4 Research and development (R&D), with the highest average median pay level, is the base category. Two categories, namely, professional services and office management, are associated with a greater likelihood of being awarded to WOBs, relative to the base category (R&D).
Notably, for all statistically significant coefficients, MOBs are more likely to receive a contract in lower-paying categories, relative to the base category. Furthermore, among all types of MOBs, Black-owned businesses are over-represented in nearly all contract categories that are characterized by lower average median pay level than the base category.
5. Discussion
The prevalence of gender and racial disparities in the awarding of federal contracts is well-acknowledged (The White House, 2021; McSwigan, Reference McSwigan2022). While the overall proportion of federal contracts that are awarded to WOBs and MOBs is reported at the agency level, there is limited knowledge on the type of federal contracts awarded to these businesses. Using granular data on more than 1,551,610 contracts, our empirical findings suggest a negative association between a contract’s STEM intensity and its likelihood to be awarded to WOBs and MOBs. Among MOBs, Black-owned and Hispanic-owned businesses are particularly underrepresented in contracts with higher levels of STEM intensity. This finding indicates the prevalence of within-minority disparities in federal procurement and underscores the importance of recognizing the heterogeneity that exists in the representation of different types of MOBs in STEM-intensive contracts. While prior studies highlight the lack of gender and racial diversity in the STEM workforce (Fry et al., Reference Fry, Kennedy and Funk2021; National Academies of Sciences, Engineering and Medicine, 2023; NSF, 2023), we complement these studies by documenting the magnitude of gender and racial disparities in STEM-intensive contracts, an important source of scientific and technological progress in the US.
We also find that federal contracts characterized by lower average median pay levels are more likely to be awarded to MOBs. Specifically, among MOBs, Black-owned businesses are particularly over-represented in contract categories that are characterized by lower average median pay levels. Together, these findings provide a granular examination of the prevalence of gender and racial disparities in federal procurement (Miller, Reference Miller2021; The White House, 2021; McSwigan, Reference McSwigan2022). They also provide a more nuanced understanding of these disparities by showing that the representation of WOBs, MOBs, and different types of MOBs vary significantly across the specific type of federal contract being considered (in this case, STEM-intensive contracts, and 19 categories of products and services purchased through the contracts). Taken together, these findings uncover a major obstacle to reducing gender and racial disparities in federal procurement—the limited use of information at the contract level that has the potential to provide a more granular assessment of these disparities and inform actionable policy decisions to reduce these disparities.
6. Implications
Diversifying the pool of federal contractors by increasing the share of WOBs and MOBs has been recognized as a vital tool for “helping more Americans realize their entrepreneurial dreams” (The White House, 2021). The federal government’s immense purchasing power presents a unique opportunity to invest in the nation’s WOBs and MOBs, and each year at least 5% and 12% of federal contracting dollars are to be awarded to WOBs and MOBs, respectively (SBA, 2023a). Such socioeconomic contracting goals are a crucial policy instrument to increase the participation of these businesses in executing federal contracts. However, as our study findings demonstrate, gender and racial disparities in federal procurement are persistent; notably, racial disparities in federal procurement are contingent on the type of MOB being considered. For example, while Black-owned businesses are underrepresented in both STEM-intensive contracts and higher pay contract categories, we observe no such relationship for Asian-owned businesses. This finding emphasizes the need to move away from the tendency to bundle different types of MOBs under a single category while establishing socioeconomic contracting goals. Instead, a more granular approach to establishing socioeconomic contracting goals which takes into consideration the type of MOB may help to create more equality of opportunity and reduce within-minority disparities in federal procurement.
While the establishment of granular socioeconomic contracting goals may help to boost the demand for WOBs and MOBs in the execution of federal contracts, addressing structural barriers faced by women and racial minorities (e.g., lack of credit access from traditional sources like banks, inadequate networking opportunities) can help to further level the playing field for these businesses in the federal contracting marketplace. Prior literature provides substantive empirical evidence suggesting that women and racial minorities, particularly Black individuals, are severely disadvantaged when it comes to accessing credit to start new businesses and meet working capital needs (Asiedu et al., Reference Asiedu, Freeman and Nti-Addae2012; Robb and Rafael, Reference Robb and Rafael2013; Fairlie et al., Reference Fairlie, Robb and Robinson2022). Furthermore, “difficulty gaining access to contracting officials” and a “lack of knowledge of federal contracting process” has been identified as significant barriers for MOBs to pursue federal contracting opportunities (GAO, 2012). To that end, the Biden–Harris administration has recently introduced an array of policy initiatives to reduce these structural barriers faced by WOBs (The White House, 2023) and MOBs (The White House, 2022). By uncovering within-minority disparities in federal procurement, our study findings can serve as a basis to make a distinction among the different types of MOBs while designing these policy initiatives, thereby helping to reduce the initial structural barriers that are inherent in access to federal contracting opportunities.
7. Limitations and future research directions
Our study has limitations which also serve as opportunities for future research. First, our study focuses on gender and racial disparities in contracts awarded by the U.S. federal government. More research is needed to understand whether similar disparities exist in contracts awarded by governments of other countries, U.S. states, counties and cities. Second, our study examines only gender and racial disparities that are prevalent in federal procurement. Future studies can extend this line of research by examining location-based disparities in federal procurement, for example, by carrying out an examination of whether and to what extent federal contracting dollars are equitably distributed across different regions within the US. Third, our study undertakes a descriptive examination of the gender and racial disparities in federal procurement with an emphasis on a contract’s STEM intensity and median pay levels. Future studies can benefit from examining causal relationships that drive the observed disparities. Finally, our study utilizes large-scale, secondary data to provide granular insights into the nature of gender and racial disparities in federal procurement. Future research can leverage these insights to inform the collection of primary data (e.g., through focus group discussions, structured and unstructured interviews with federal procurement executives) for developing actionable mechanisms that can help to reduce these disparities. Relatedly, future studies can also examine the effectiveness of different policy interventions (e.g., the establishment of socioeconomic contracting goals) in reducing gender and racial disparities in federal procurement.
Supplementary material
The supplementary material for this article can be found at https://doi.org/10.1017/dap.2024.17.
Data availability statement
The data and code used for data cleaning and analysis are available at https://osf.io/n34ur/?view_only=b993d805907e4827b8a584cf29d3acac.
Author contribution
D.R. and C.P. contributed equally to the study.
Funding statement
This research received no specific grant funding form any funding agency, commercial or not-for-profit sectors.
Competing interest
The authors declare none.
Ethical standard
The research meets all ethical guidelines, including adherence to the legal requirements of the study country.


 Open access
Comments
No Comments have been published for this article.