


Policy Significance Statement
To successfully combat the COVID-19 pandemic, and potential future pandemics, the application of anonymous and aggregated mobility data can play an important role, such as suggested in recent research (Iacus et al., Reference Iacus, Santamaria Serna, Sermi, Spyratos, Tarchi and Vespe2020a; Kraemer et al., Reference Kraemer, Yang, Gutierrez, Wu, Klein, Pigott, du Plessis, Faria, Li, Hanage, Brownstein, Layan, Vespignani, Tian, Dye, Pybus and Scarpino2020; Santamaria et al., Reference Santamaria, Sermi, Spyratos, Iacus, Annunziato, Tarchi and Vespe2020) by the Joint Research Centre of the European Commission. The data itself must be safe to use from a privacy standpoint and must be representative for the whole population. Such data can be provided by mobile operators, and by forging a close partnership between public institutions and mobile operators, beneficial outcomes can be achieved. This can also inform future research.
1. Background and Introduction
In Sweden, the public became acutely aware of the COVID-19 potential impact around the time of the popular spring break in the end of February/early March 2020. The spring break is a time when many Swedes travel to go skiing. Several businesses, Telia among them, required employees that had gone to certain areas in the north of Italy to self-quarantine at home when they came back, instructing them not to go to the office.
Around that time, it became clear to Telia that Anonymous and Aggregated Mobility Data in the commercially available product Telia Crowd Insights (Telia Company, n.d.-b) could potentially be of use to authorities to support their decision making. Research indicates several use cases where human mobility data can be useful during a pandemic, such as to inform reopening strategies (Chang et al., Reference Chang, Pierson, Koh, Gerardin, Redbird, Grusky and Leskovec2020) or how human mobility shapes transmission dynamics (Changruenngam et al., Reference Changruenngam, Bicout and Modchang2020). Telia, together with the consulting company, Accenture, approached the Public Health Agency of Sweden (PHAS) and was invited to present Crowd Insights to an analytics team at PHAS in the beginning of April 2020.
Two main use cases were discussed: (a) quantify the adherence to the travel recommendations made to the public, and (b) leverage the Origin Destination Matrix (ODM) data for epidemiological models. In follow-up meetings it became clear that while both parties agreed that the data could be useful, mobility data was new to PHAS and as such the specifics of the use cases were not initially clear.
Throughout the month of April, a close collaboration took place to iteratively adapt Crowd Insights to the agency’s needs while at the same time PHAS began to use the tool provided. By doing so, a small group of data scientists at PHAS would both learn how to apply the insights in internal decision making and follow-up, and at the same time feed updated requirements and suggestions to Telia. The collaboration evolved and by late June it was agreed that a combination of (a) a standardized Crowd Insights product from Telia; and (b) custom work when needed would fulfill the agency’s needs.
For Telia, the internal challenges to frame the collaboration were mainly: (a) being able to provide Crowd Insights initially in a nonprofit manner as Crowd Insights was an existing commercial offering; (b) how to internally fund the initiative during a time where many existing paying Crowd Insights customers also had an increased need; and (c) the adjustment from monthly reports to daily refreshes of frequently used dashboards. New processes around data quality and assurance had to be put in place as the market need for the service shifted from monthly to weekly.
On March 19, 2020, PHAS issued a recommendation to avoid unnecessary travel within Sweden, in complement to an analogous recommendation issued on March 14 regarding traveling abroad. At that time PHAS had no way of evaluating whether the population adhered to the recommendations. Media reports, personal experiences and rumors were circulating regarding inhabitants’ compliance, or noncompliance, resulting in speculation and questions on how effective these new measures were.
Around that time Telia contacted PHAS and the first meetings took place. The main goal of the collaboration from the agency’s perspective was to be able to quantify the effect of the new traveling recommendations in general, and for specific holidays, for example, Easter, Walpurgis, and Midsummer. The acute problem of not being able to evaluate and quantify the effectiveness of the traveling recommendations, made PHAS prioritize the collaboration with Telia.
2. Approach
Telia had, since several years, experience in providing Anonymized and Aggregated Mobility Data to third parties, and already had a commercially available product, Crowd Insights, available in the Nordic markets.
Crowd Insights is based on the anonymization and aggregation of already present signaling data between mobile phones and mobile cell towers. Such signaling is termed Network Events (Figure 1). The full process consists of the following main steps: anonymization and aggregation, extrapolation (adjusting numbers to be representative for the full population), and finally spatial and temporal aggregation. The anonymization uses, among other mechanisms, k-anonymity of 5, that is, at all steps during the process there must be at least five mobile devices exhibiting the same behavior otherwise the information is discarded automatically. The spatial accuracy is determined by the location of cell towers combined with the density of cell towers and the number of signals from mobile phones. The highest spatial resolution is 500 × 500 m and lowest is 16 × 16 km (Figure 2).
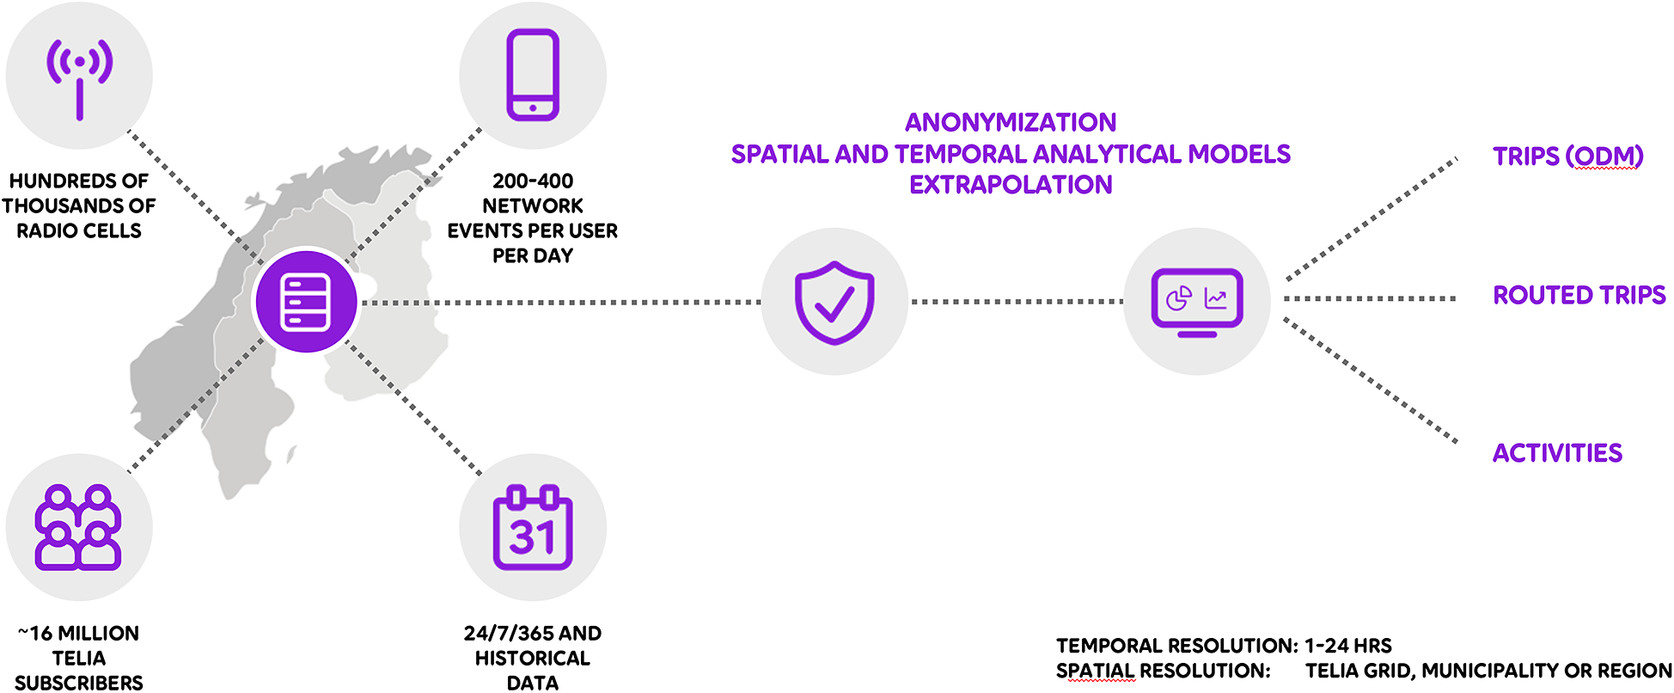
Figure 1. Overall data process Telia Crowd Insights (number of subscribers refers to number of subscribers used as a basis in Crowd Insights in the Nordics).
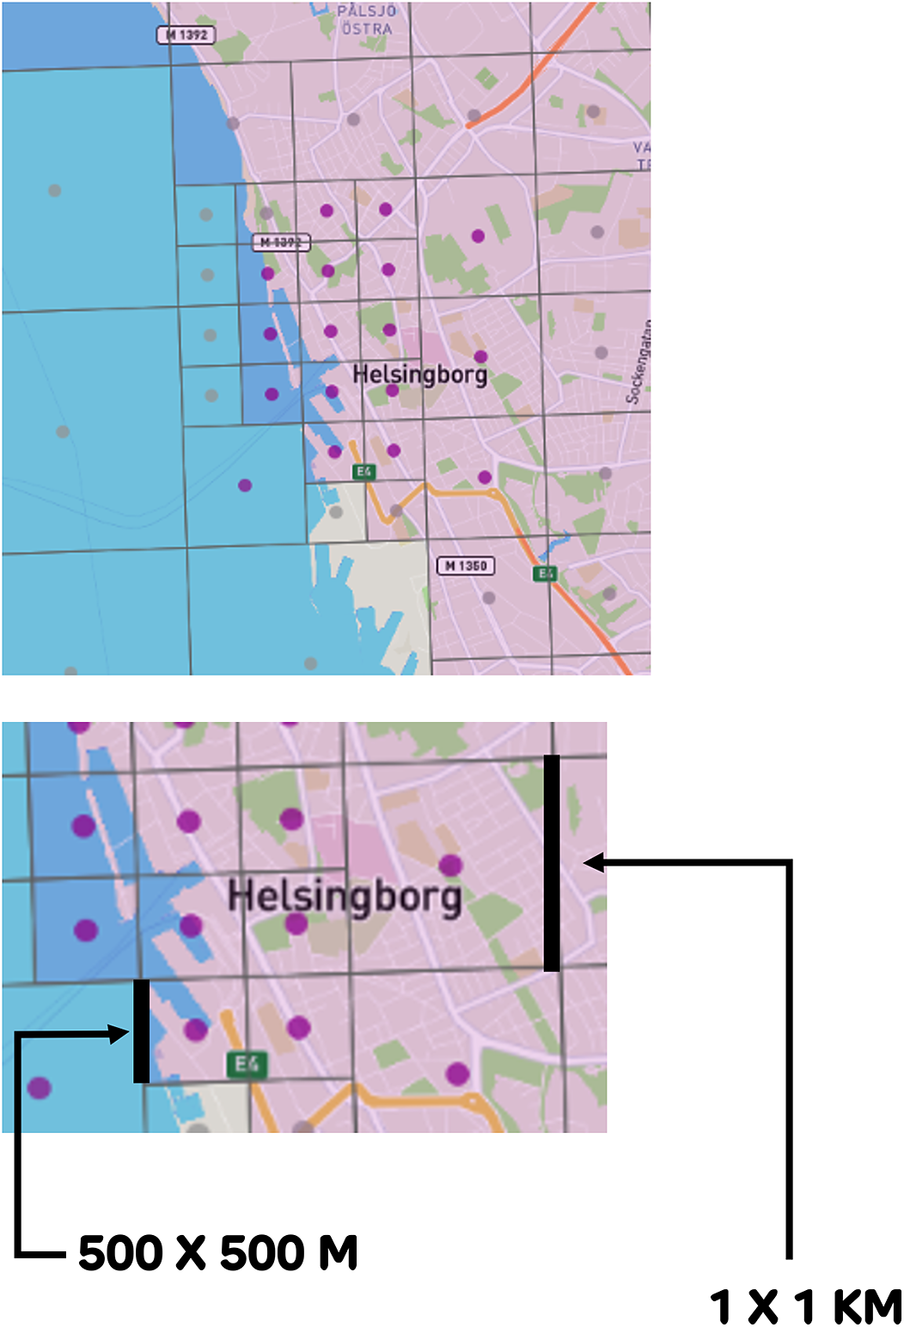
Figure 2. Example of Telia dynamic grid over the Swedish city of Helsingborg.
The extrapolation method works by adjusting trip and activity counts by the observed market share for Telia per geographic area. The observed market share is estimated by cross referencing observed number of mobile phones with census data for the corresponding geographical area. The extrapolation factors are continually updated and adjusted as new census data becomes available. As such the extrapolated data is robust for comparing between periods, such as year-on-year.
Frequency and latency of the data can vary depending on the use case (at most daily and always at least 48 hr delayed). For the general dashboard delivery to PHAS the frequency is daily and latency of 48 hr.
The time periods analyzed by PHAS, were from around the time the first travel recommendations were made (March 2020) and onwards. Mobility levels were typically compared to either (a) a few weeks before the recommendations were made or (b) the same period 2019 as can be seen in Figure 4.
Throughout the collaboration, different delivery mechanisms have been evaluated, such as delivery in CSV (comma delimited text file) format, general dashboards and tailored dashboards for specific use cases. In the end, generic Trip and Activity dashboards (e.g., Figure 3) proved most useful covering general use cases and for custom work and insights were typically delivered as individual reports or visualizations (e.g., Figure 4). To analyse the large anonymous and aggregated data sets, Google Big Query was utilized, and visualizations of such analysis has been done using the tool Tableau. For avoidance of doubt, by using those dashboards, it is not possible to single out or reidentify a single person as all data is anonymized and aggregated.
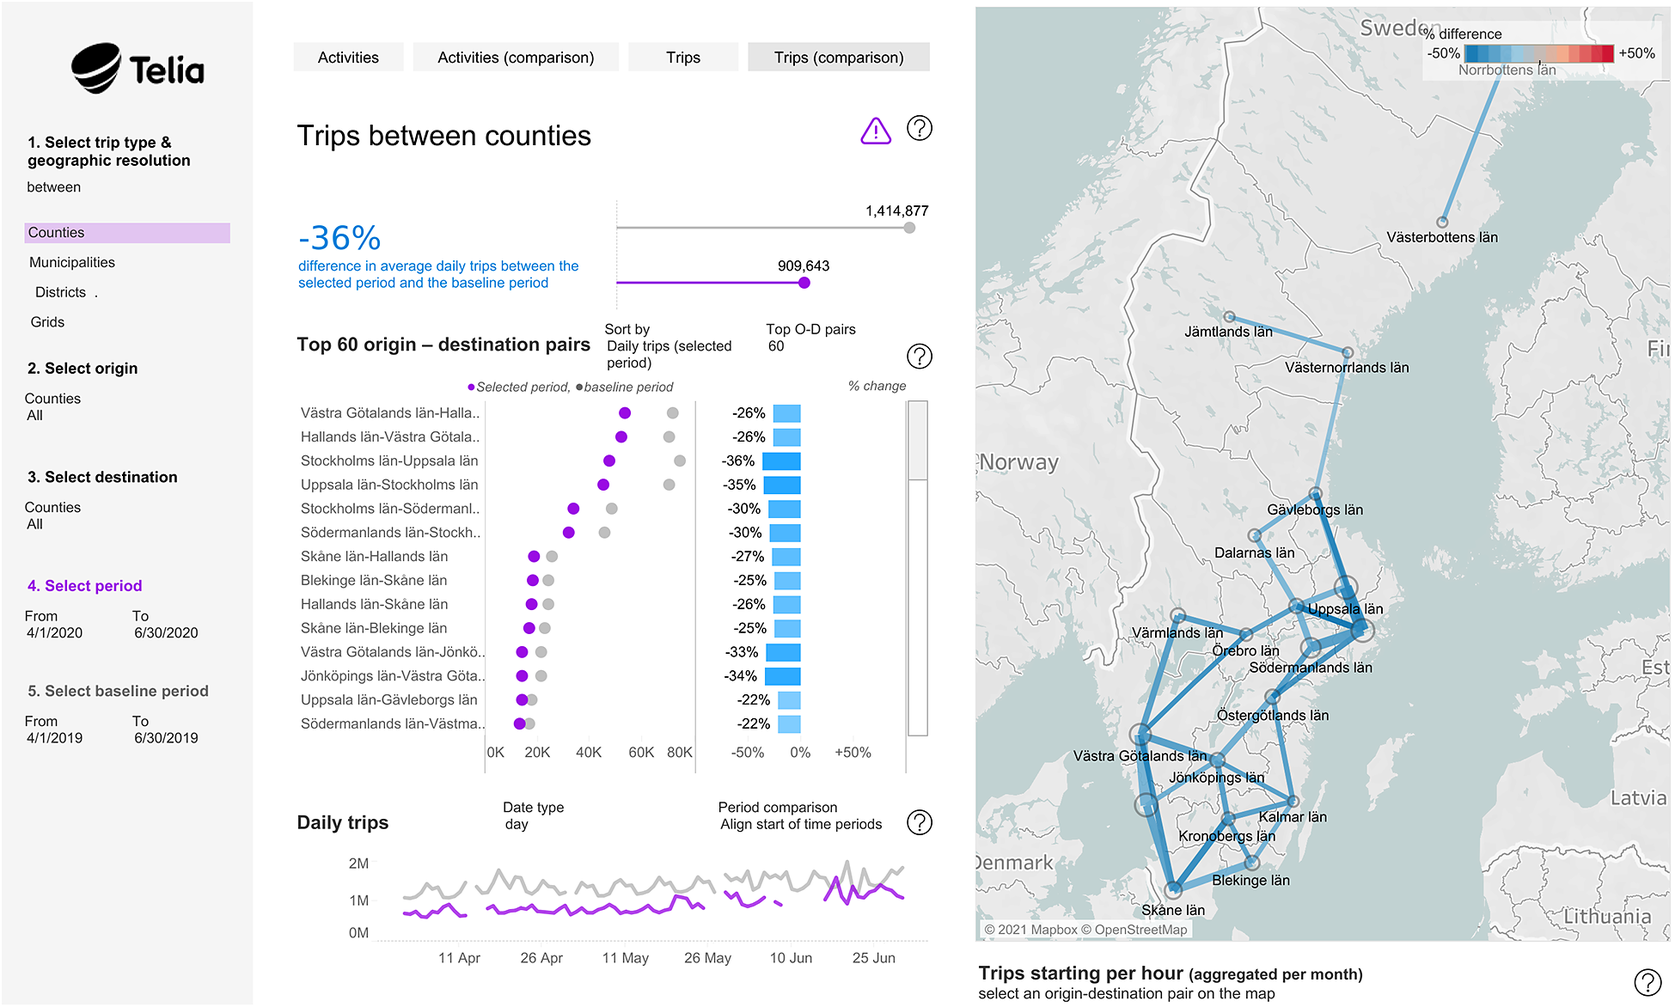
Figure 3. Telia’s generic dashboard for Trip Data change showing change between a baseline period and a selected comparison period; −39% change in number of trips between counties in Sweden (April 1, 2020–June 30, 2020 vs. April 1, 2019–June 30, 2019).
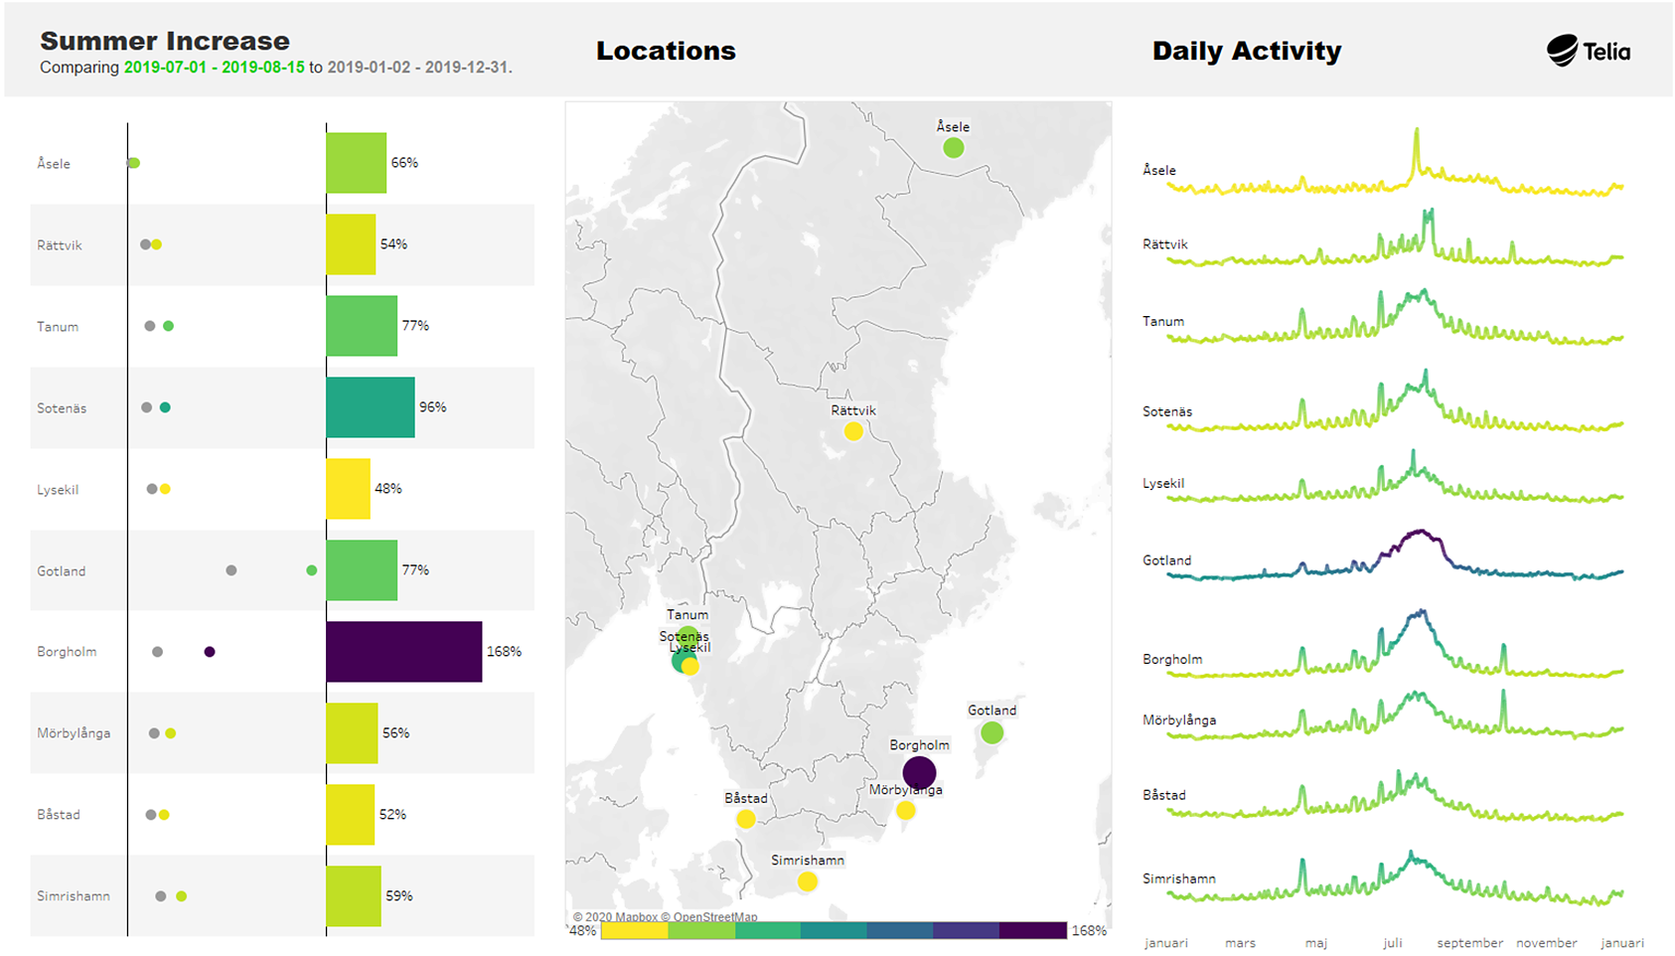
Figure 4. Custom analysis showing Activity Data increase nationally during summer of 2019.
During the initial months (April–June 2020), collaboration was almost daily, with walkthroughs of how PHAS should best analyse and interpret the data and iterations of dashboards. Generally, the dashboards focused on trends in trips as well as comparisons against a baseline period set to before the pandemic. Telia also did custom deliveries to PHAS, for example an analysis over the national travel patterns of summer 2019 (Figure 4), which was created by using anonymized and aggregated data from Crowd Insights to help PHAS understand the normal traveling pattern to popular holiday locations before the approaching summer of 2020. Telia was asked frequently by the media for different custom analysis, for example, how many people approximately were working from home, and before sharing with the media, Telia would give PHAS the same analysis to give PHAS the same insights as well as an opportunity to prepare for questions from the media. Telia and PHAS also had regular briefings weekly or biweekly.
As the initial period progressed, the intensity of the meetings reduced as it became clearer how the dashboards would be used, and work began to define the commercial contract between Telia and PHAS. The commercial contract was put in place July 1 and the delivery was scoped as: A continuous delivery with daily refresh on Telia’s standard dashboards for national Trip Data and Activity Data with a granularity down to municipality level, as well as access to the dashboard which Telia’s weekly reports to media and the public is based upon. Any specific analysis outside the continuous delivery is scoped separately between Telia and PHAS.
Because of the decentralized organization of healthcare in Sweden into 21 regions, the focus of PHAS is the national perspective. Hence, the agency’s needs were foremost to be able to describe and quantify general overall traveling patterns in the country and, if possible, also in comparison to other countries. For this purpose, Telia’s weekly reports were suitable.
However, the geographical heterogeneity of the spread of COVID-19 motivated PHAS to ask for geographical resolution down to municipality level in the delivery, which also would be of particular interest to the regional communicable disease control units with which PHAS works tightly. Since PHAS had no experience of analysis and interpretation of these data, it was important to include historical anonymized and aggregated data in the delivery; specifically the possibility of comparisons of travel patterns to the previous year.
The interactive dashboard provided from Telia to PHAS is limited to PHAS internal use, but insights derived from the service can be shared publicly or to other institutions by the PHAS, for example, in the form of screenshots or excerpts from the service.
3. Outcomes and Impact
The main use case in the end has been quantifying adherence to travel recommendations made by PHAS by comparing movement to similar periods during 2019. Ancillary use cases have involved: following movement trends during popular holidays, inferring trends pertaining to how many are working from home (Figure 5), and comparing the number of trips between the Nordic countries (Figure 6).

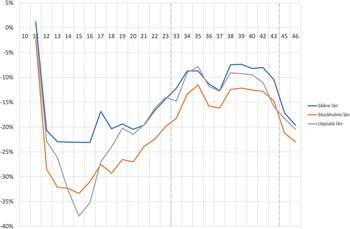
Figure 5. Difference in estimated number of people at the office (x-axis: week number, y-axis: % difference vs. week 10) by region (Region of Skåne, Region of Stockholm, Region of Uppsala) per calendar week during 2020. Estimated as all activities that have: (a) a longer duration than 1 hr, and (b) have a local start hour earlier than 16:00 and later than the first timestamp of leaving the home zone, and (c) have a distance of at least 500 m from the home zone. A home zone is defined where the earliest activity happens during the day. Weeks (24,32) and 44 are excluded as these are typical holiday weeks in Sweden and not relevant for this analysis.

Figure 6. The total number of trips by country (x-axis: week number, y-axis: % difference from week 6) from week 6 to 44, 2020. A trip is defined as a movement from one place to another separated by a dwell of at least 50 min. The minimum distance required for a trip to be registered varies by the density of the mobile base stations, for example, in densely populated areas the minimum distance is at least 500 m, and in rural sparsely populated areas the minimum distance required may be several kilometers.
The insights from the mobility data have been used by PHAS to confirm that the population to a large extent adhered to the voluntary traveling recommendations. In practice, this has been manifested both in a significantly decrease in the estimated number of people working from their offices (Figure 5), and an immediate overall decrease in trips of approximately 20% following the introduction of the recommendations in March and, importantly, in that the behavior was sustainable over a long period of time compared to neighboring countries with more authoritative mobility containment measures (Figure 6).
During the course of the pandemic, PHAS has shared and discussed analyses depicting mobility patterns both internally in the organization and with numerous regional communicable disease control units. Analyses and interpretations have for example been shared and discussed with Region Dalarna, hosting many visitors during Midsummer holidays, and Region Gotland and other regions usually receiving many tourists during the summer season. Another more recent example is the sharing of an analysis of the change in the estimated number of people working from the office (Figure 5) with Region Uppsala, which was the first region that recommended stricter mobility containment measures (on Tuesday, October 20, of calendar week 43, 2020) because of the surge of new COVID-19 cases.
In addition, PHAS has used the insights to inform the public, for example, as part of the weekly report on COVID-19 (Public Health Agency in Sweden, 2020a) or during the Easter holiday (Public Health Agency in Sweden, 2020b), a popular travel holiday in Sweden. Furthermore, insights have been shown in a handful of external presentations of Sweden’s response to the pandemic made by the agency’s spokespersons. In the future, the mobility data also has the potential to shed more light on how traveling has affected the spread of the disease.
Telia and PHAS have announced the cooperation in coordinated press releases (Public Health Department of Sweden, 2020c). Further, the cooperation has been continuously followed up in the media as well as internally in Telia’s regular reporting on Freedom of Expression and the right to privacy in times of COVID-19 (Telia Company, n.d.-a).
4. Lessons Learned
For Telia, internal organizational and financial challenges involved getting approval for a nonprofit offering. One of the risks identified was that one of Telia’s key services, Crowd Insights, could potentially be put on hold for the rest of the Swedish market during the pandemic in case the needs from PHAS would turn out too great to manage. Furthermore, it was unclear why Telia should not charge for services normally provided in a commercial manner, and the customer (PHAS) needed Telia quality services just as the rest of society. The focus at Telia during this initial time of the pandemic in Sweden was to keep the digital infrastructure in Sweden running and thereby support society overall.
As the approach for the initial collaboration between Telia and PHAS differed from normal operating procedures, a management team approval was needed. No additional funding was requested, and the work became prioritized alongside other committed engagements for Crowd Insights. To reduce the load, a partnership was struck with Accenture (2020), who were familiar with Crowd Insights since a previous project, where Accenture agreed to, during the month of April 2020, provide their services free of charge to help PHAS by answering questions, performing analysis work and adaptations of Crowd Insights dashboards. Despite the support of Accenture, and even more so after their engagement ended, other internal initiatives at Telia were put on hold to secure the continued delivery to both PHAS and other customers of Crowd Insights where there was also an increased demand due to the pandemic. Only after the collaboration with PHAS transitioned into a more stable state and the agency started to use a standardized Trip Data and Activity Data dashboard delivery, did the load reduce, and internal activities could be resumed.
Another risk identified at Telia was that perceived data sharing could be damaging to the brand, even though the Crowd Insights product was an established product and fully based on Anonymized and Aggregated Mobility Data. The risk was managed by taking a proactive stance with regards to communication and media access. As such, several press releases were made by Telia to inform of the collaboration as well as provide insights on overall mobility statistics in Sweden. Additionally, requests from media for mobility analysis were honored and several interviews were made. This strategy worked well and at the time of this writing, the media coverage in Sweden has remained positive toward the cooperation between Telia and PHAS as well as the use of Anonymized and Aggregated Mobility Data during the pandemic.
From a technical perspective, new processes around data quality and assurance had to be put in place since the market need for the service shifted from monthly to daily. Prior to the cooperation with PHAS, data quality assurance was highly dependent on the individual analysts performing the quality assurance work. As PHAS sometimes required regular updates, this became too labor intensive. Thus, automated quality assurance methods had to be devised, such as for example, the automatic rating of mobility counts against baseline trends into four categories (A–D) as can be seen in Figure 7, which could then be subject to further investigation. The automation efforts that were made have improved the overall scalability of the Crowd Insights products and have strengthened the preparedness for new requirements in the future, be it from the market as a whole or due to future pandemics.
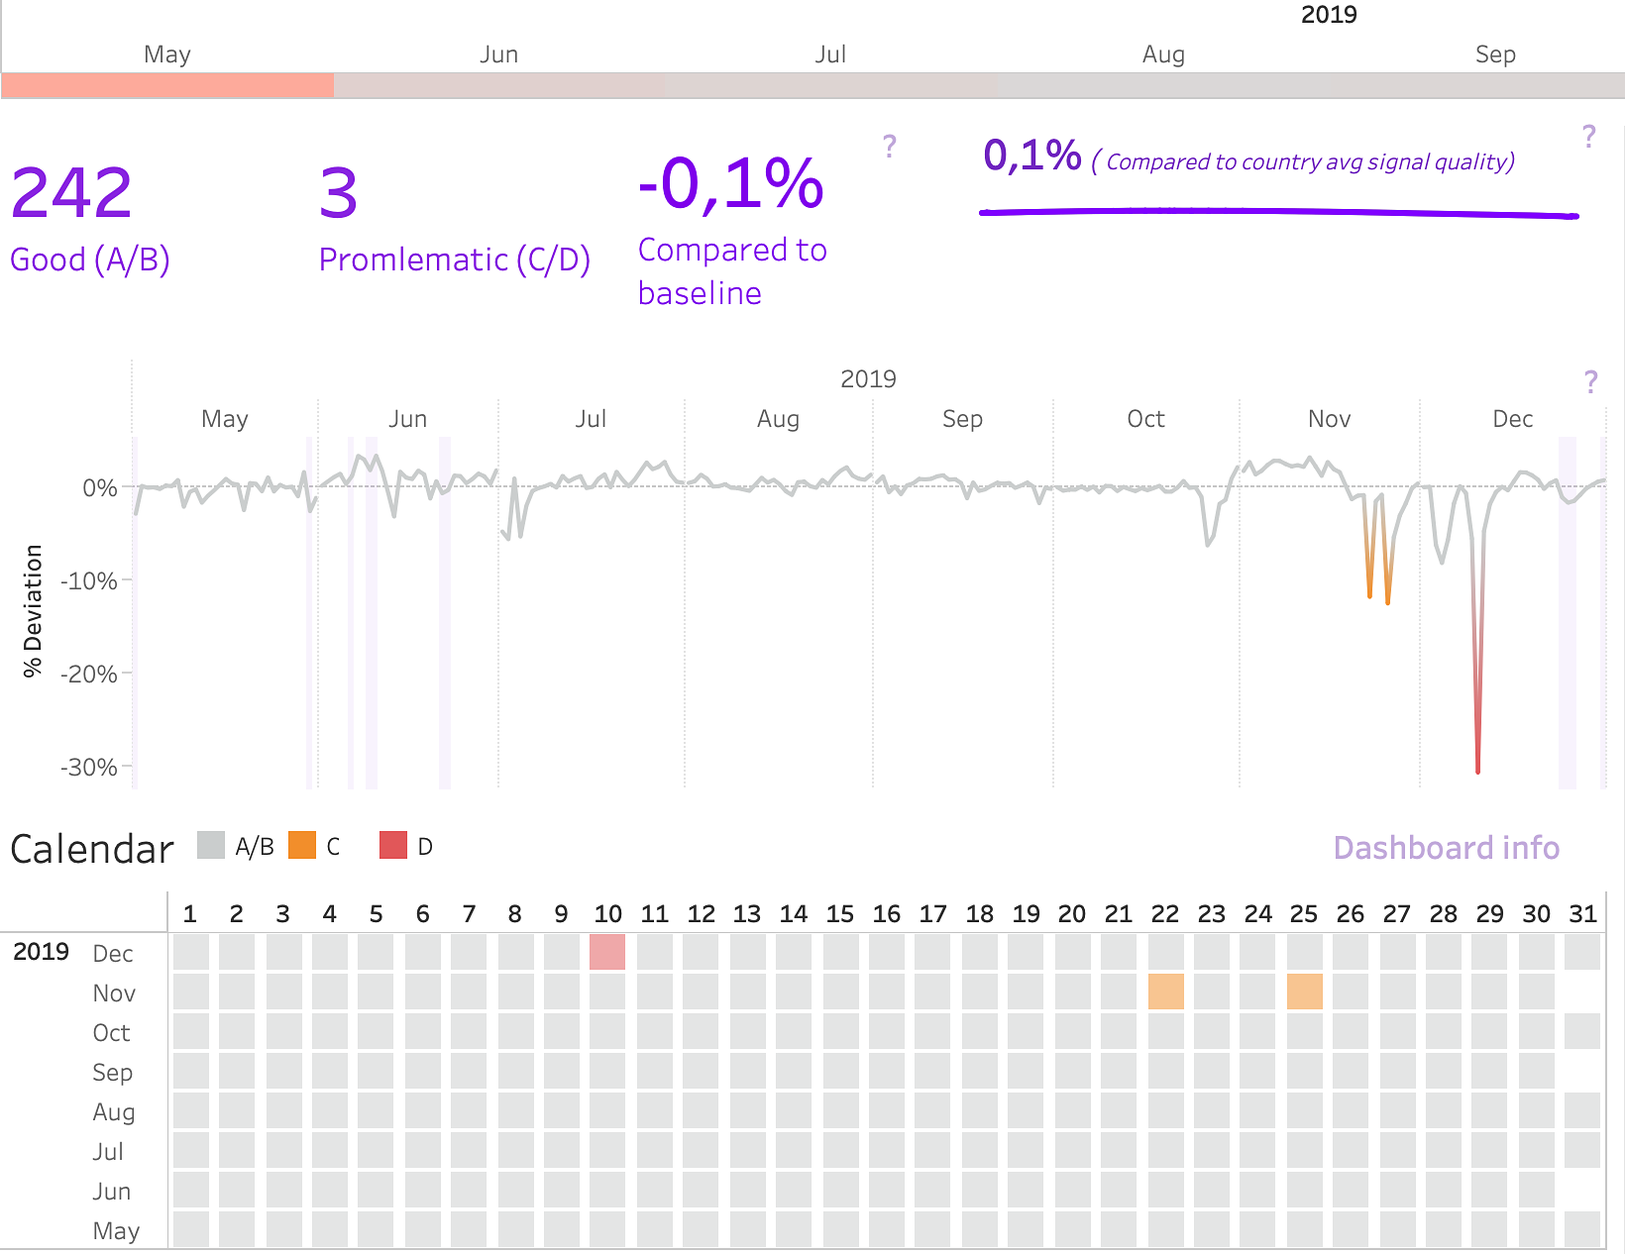
Figure 7. Partial screenshot of the Telia Crowd Insights Data Quality dashboard that measures deviations in the data pipeline in an automated fashion. Deviations are flagged here and allow analysts to investigate only areas where troubleshooting may be required, thus reducing the overall load on the analyst resources.
Due to the learnings of how the data was requested and analyzed by PHAS, the functional roadmaps of the different Crowd Insights products were modified to include similar features. In several cases, these features came to be utilized by municipalities who used the Crowd Insights products for mobility analysis during the pandemic. The municipality of Malmö, for example, began to use it to inform residents of Malmö of mobility trends as part of their weekly pandemic report (Municipality of Malmö, 2020).
From the perspective of PHAS, the collaboration with Telia was sparked by the acute problem that the agency was not able to evaluate and quantify the effect of the mobility containment measures implemented in March. Since Telia’s offer started off as a nonprofit collaboration the internal process at the agency at that point was rather straight-forward, with a rapid decision to explore if the aggregated and anonymized mobility data could help answer these pressing questions. The outcome might have been different if Telia’s initial offer had been commercially motivated, at least with respect to how fast the collaboration could have been initiated.
At that time (March and April 2020), media reports, personal experiences and rumors were circulating regarding inhabitant’s compliance, or noncompliance, resulting in speculation and questions on how effective these new measures were. It was reassuring for PHAS that the insights from the mobility data clearly showed a significant general change in the behavior of the population, and discussions with the experienced analytics team at Telia confirmed this since it was an unprecedented change in overall mobility in the country. PHAS also communicated these insights as important feedback, and encouragement, to the public at times as part of the agency’s daily press conferences at that time.
A very important aspect of the collaboration from the agency’s perspective was personal data protection issues. PHAS was under no circumstances willing to risk any negative effects on trust and reputation because of questionable usage of novel data sources for coping with the pandemic. Success factors for the collaboration in this respect was the fact that Crowd Insights already was a commercial product that had proven successful for data insights for other publicly funded organizations, together with the thorough work of Telia to secure the anonymization and aggregation of the data in the service. The process of anonymization and aggregation was very well documented at Telia and hence the legal department at PHAS could swiftly approve the collaboration from a legal and personal data protection perspective.
As the initial period of the collaboration progressed, and there were no signs that this pandemic would end in the short term, the collaboration was extended past the initial period and a new commercial contract was put in place that started on July 1, 2020. At PHAS, the definition of the contract and the scope of the delivery was discussed at several levels. Also, the commercial contract was reviewed by the agency’s procurement function to be in line with those rules. The formal decision of signing the contract was made by the General Director of PHAS.
Several areas could be further investigated to strengthen preparedness for potential future pandemics:
• The inclusion of mobility data into common epidemiological analytic models before a potential next pandemic would mean that health agencies would have a larger set of tools available at the start of a future pandemic. Previous research indicate that mobility data can play an important role in epidemiological modeling, such as helping to accurately model case trajectories despite dramatic changes in population behavior due to the virus (Chang et al., Reference Chang, Pierson, Koh, Gerardin, Redbird, Grusky and Leskovec2020), and the recent research from the European Commission Joint Research Centre showing correlation between people mobility and infection rates (Iacus et al., Reference Iacus, Santamaria Serna, Sermi, Spyratos, Tarchi and Vespe2020b) where Telia was one of the telecom operators providing Anonymous and Aggregated Mobility Data.
• If such epidemiological models were to be developed, using mobility data from the COVID-19 pandemic and/or in combination with simulated synthetic mobility patterns, these models may be utilized to simulate different scenarios of a future pandemic by varying both mobility patterns and the typical characteristics of the virus. One recent example is shown in research from Wang et al. (Reference Wang, Ghosh, Ding, Sarkar and Gao2021) where agent-based simulation was used to model infections using mobility data to find less disruptive intervention strategies. Such work may increase preparedness for a future pandemic by allowing PHAS and other institutions to further draw learnings from the COVID-19 pandemic.
• As mobility data is typically available only via private organizations, such as Telia, the use of mobility data also in future pandemics could be accelerated by maintaining a preparedness from both the public and private sector. This may include maintaining a commercial relationship, or being prepared to form one rapidly should such need arise, and ensuring that at least the following are present: technical and analytical platforms, data formats, automated data delivery and quality processes, frameworks for internal and external communication, legal approvals, commercial agreements, support level definitions, skill sets, and competencies for analyzing mobility insights. As described in this article, quite some effort and time was required from both Telia and PHAS to put the aforementioned factors in place, thus having such factors ready at hand could substantially reduce the time needed to start utilizing mobility data to inform and trigger effective policy responses. Furthermore, having an initial trust in the data from both statistical representativeness and privacy standpoint were found to be important factors to enable quick adoption.
• Telia and PHAS could potentially further increase collaboration with the research community around epidemiological modeling not only to ensure relevance of the Crowd Insights products also for the future use cases within the area, but also to support research initiatives by supplying Anonymous and Aggregated Mobility Data for research purposes.
Abbreviations and Definitions
• Origin Destination Matrix (ODM) data—A data set consisting of pairs of origins and destinations with an associated trip count, for example, number of trips between area A and area B. The size of areas in an ODM data set can vary and can refer to an area defined by an administrative body, such as a municipality or region, or a spatial square grid.
• Activity Data—an activity is defined as a dwell within an area of a certain amount of time. In the work performed with PHAS, dwell times of 20 or 50 min have been most common.
• Trip Data—A trip is defined as a movement from one place to another separated by a dwell of a certain time. The minimum distance required for a trip to be registered varies by the density of the mobile base stations, for example, in densely populated areas the minimum distance is at least 500 m, and in rural sparsely populated areas the minimum distance required may be several kilometers.
• Anonymized and Aggregated Mobility Data—data concerning people mobility that does not contain information about individuals (i.e., does not include personal data, as anonymization is a process that removes the identifiability of personal data consequently setting the data out of scope of the data protection laws), and further aggregated by either time or spatial dimensions, for example, total number of people traveling from Stockholm to Malmö in a given week.
• PHAS—Public Health Agency of Sweden.
Supplementary Materials
To view supplementary material for this article, please visit https://doi.org/10.1017/dap.2021.11.
Funding Statement
This work received no specific grant from any funding agency, commercial, or not-for-profit sectors.
Competing Interests
The authors declare no competing interests exist.
Author Contributions
Conceptualization, K.Å., P.B.; Data visualization, K.Å., E.A.; Writing—original draft: K.Å., P.B., E.A. All authors approved the final submitted draft.
Data Availability Statement
Data availability is not applicable to this article as no new data were created or analyzed in this study.


 Open access
Comments
No Comments have been published for this article.