


On September 20, 2017, Hurricane Maria struck Puerto Rico with 155 miles per hour sustained winds and wind gusts of up to 190 mph. Reference Pasch, Penny and Berg1 Torrential rains of up to 40 inches of water accompanied the winds, Reference Hu and Smith2 which resulted in large floods on the entire island. The hurricane destroyed the island’s electricity grid, leaving 3.4 million inhabitants without electricity. Reference Lu and Alcantara3 In addition, infrastructure was affected: aqueducts and sewers, roads, bridges, ports, airports, cell phone towers, and gas stations were left without fuel for vehicles and generators. Reference Ficek4 It is estimated that the effects of the hurricane caused monetary damages in Puerto Rico of more than the US $82 billion. Reference Alvarez Febles and Félix5 Also, Maria destroyed around 80% of the value of the island’s crops, representing a loss of $780 million in agricultural yield. Reference Rodriguez-Cruz and Niles6
Indirect causes of death have been recognized as an important consequence of national emergencies. For example, damage to the transportation network during an earthquake can affect access to medicine and health services generating serious or even fatal repercussions for affected people. Reference Geronimus, Colen and Shochet7–9 However, the different interpretations of guidelines and varied training of personnel determining the cause of death hinder mortality counts. Reference German, Lee and Horan10 Several studies have investigated excess deaths due to Hurricane Maria. Reference Santos-Lozada and Howard11–Reference Cruz-Cano and Mead16 While Cruz-Cano and Mead Reference Cruz-Cano and Mead16 assessed specific indirect causes of death after Hurricane Maria, it only did so until the end of October 2017. Moreover, the authors limited their analysis to a few causes (heart disease, other causes, diabetes, Alzheimer’s disease, and septicemia), and did not account for population displacement, possibly leading to an underestimation of excess deaths. Importantly, the duration of Hurricane Maria’s excess mortality effect may have differed by cause of death, and modeling this can guide the development of emergency management planning.
For future emergency planning and preparedness purposes, it is important to predict fatalities related to the state of emergency, whether the deaths are directly or indirectly related to the incident, Reference Brunkard, Namulanda and Ratard17–Reference Rosenbaum, Stillo and Graves20 and excess mortality is a useful method of assessing deaths due to an emergency. Reference Hiam, Dorling and Harrison21 This research focuses on building a semiparametric Poisson model that allows estimating the deaths caused by a state of emergency incorporating in the model the intra-annual variability, the population displacement, and causes of death due to noncommunicable diseases, and other causes indirect. At the same time, the model captures the duration of the effect on mortality of an emergency according to each death cause.
Methods
In this section, we describe the statistical model and data used in our work. All data and code are shared as supplementary material.
A Semiparametric Model
We propose a semiparametric Poisson regression model (that of Wood 2017) Reference Wood22 to estimate whether some deaths due to some causes increased after the passage of Hurricane Maria in Puerto Rico while controlling for the temporal variation in the mortality rate of the causes of death and the population size. Population displacement plays an important role, which can be directly influenced by economic, social, labor, academic, climatic variations, and other factors. Reference Neyra23,Reference Acosta, Kishore and Irizarry24
Additionally, index functions will be deployed in the model to evaluate if there are effects of changes in the behavior of certain leading causes of death, including some non-communicable diseases (NCDs) in different post-emergency periods.
Let D
t
= number of deaths at time index t, N
t
= population size at time t. We assume that D
t
follows a Poisson distribution. For $i = 0, \ldots, I,$
we assign
$i = 0, \ldots, I,$
we assign ${P_{i,t}}$
as an indicator of the period i for time t. Specifically,
${P_{i,t}}$
as an indicator of the period i for time t. Specifically, $i = 0$
represents the pre-emergency period,
$i = 0$
represents the pre-emergency period, $i = 1$
is a given period after the emergency, and so on. For
$i = 1$
is a given period after the emergency, and so on. For $j = 1, \ldots, J$
, we consider
$j = 1, \ldots, J$
, we consider ${c_{j,t}}$
as an indicator of cause of death j at time t. On the other hand, we define
${c_{j,t}}$
as an indicator of cause of death j at time t. On the other hand, we define $da{y_t} = $
day of the year, and
$da{y_t} = $
day of the year, and $yea{r_t} = $
a categorical variable that captures the mortality trend through the years. We define the following generalized additive semiparametric Poisson regression model with interaction,
Reference Ruppert, Wand and Carroll25
$yea{r_t} = $
a categorical variable that captures the mortality trend through the years. We define the following generalized additive semiparametric Poisson regression model with interaction,
Reference Ruppert, Wand and Carroll25
 $$\begin{gathered}\log \left( {{\mu _{i,j,t}}} \right) =\log \left( {{N_t}} \right) + {\beta _0} + {{\rm year}_t} + {\boldsymbol P}{'_{}}{\boldsymbol\alpha} + {\boldsymbol c}{'_t}\gamma + {\left( {{{\boldsymbol P}_t} \otimes {{\boldsymbol c}_t}} \right)^{'}}{\boldsymbol\omega} \\ \!\!\!\!\!\!\!\!\!\!\!\!\!\!\!\!\!\!\!\!\!\!\!\!\!\!\!\!\!\!\!\!\!\!\!\!\!\!\!\!\!\!\!\!\!\!\!\!\!\!\!\!+f\left( {da{y_t}} \right) + {\varepsilon _{i,j,t}},\end{gathered}$$
where ${\mu _{i,j,t}} = E\left( {{D_t}{\rm{|}}t,{\rm{\;}}{{\boldsymbol P'}_t},{\rm{\;}}{{\boldsymbol c'}_t},{\rm{\;}}{N_t},{\rm{\;}}da{y_t},{\rm{\;}}yea{r_t}} \right).$
We define
${\mu _{i,j,t}} = E\left( {{D_t}{\rm{|}}t,{\rm{\;}}{{\boldsymbol P'}_t},{\rm{\;}}{{\boldsymbol c'}_t},{\rm{\;}}{N_t},{\rm{\;}}da{y_t},{\rm{\;}}yea{r_t}} \right).$
We define ${{\rm{\boldsymbol P'}}_t} = \left( {{P_{0,t}}, \ldots, {P_{I,t}}} \right)$
and
${{\rm{\boldsymbol P'}}_t} = \left( {{P_{0,t}}, \ldots, {P_{I,t}}} \right)$
and ${\boldsymbol \alpha} = \left( {{\alpha _0}, \ldots, {\alpha _I}} \right){\rm{'}}$
denotes the coefficients of the model for the I pre and post-emergency periods. Similarly,
${\boldsymbol \alpha} = \left( {{\alpha _0}, \ldots, {\alpha _I}} \right){\rm{'}}$
denotes the coefficients of the model for the I pre and post-emergency periods. Similarly, ${{{\boldsymbol c'}}_t} = \left( {{c_{1,t}}, \ldots, {c_{J,t}}} \right)$
and
${{{\boldsymbol c'}}_t} = \left( {{c_{1,t}}, \ldots, {c_{J,t}}} \right)$
and $\gamma = \left( {{\gamma _1},{\gamma _2} \ldots, {\gamma _J}} \right){\rm{'}}$
denotes the coefficients of the model for the J causes of death. While
$\gamma = \left( {{\gamma _1},{\gamma _2} \ldots, {\gamma _J}} \right){\rm{'}}$
denotes the coefficients of the model for the J causes of death. While $\left( {\boldsymbol P}_t \otimes {\boldsymbol c}_t \right)^{\rm{'}} = \left( P_{0,t}{c}_{1,t}, \ldots, {P}_{I,t}{ c}_{J,t} \right)$
is the Kronecker product between vectors
$\left( {\boldsymbol P}_t \otimes {\boldsymbol c}_t \right)^{\rm{'}} = \left( P_{0,t}{c}_{1,t}, \ldots, {P}_{I,t}{ c}_{J,t} \right)$
is the Kronecker product between vectors ${{\rm{\boldsymbol P'}}_t}$
and
${{\rm{\boldsymbol P'}}_t}$
and ${{\rm{\boldsymbol c'}}_t}$
.
${{\rm{\boldsymbol c'}}_t}$
. ${P_{i,t}}{c_{j,t}}$
represents the interaction between the I pre- or post-emergency periods and the J causes of death at time t and
${P_{i,t}}{c_{j,t}}$
represents the interaction between the I pre- or post-emergency periods and the J causes of death at time t and $\omega = \left( {{\omega _{11}}, \ldots, {\omega _{MQ}}} \right){\rm{'}}$
represents the coefficients of the interaction. On the other hand, the smooth function
$\omega = \left( {{\omega _{11}}, \ldots, {\omega _{MQ}}} \right){\rm{'}}$
represents the coefficients of the interaction. On the other hand, the smooth function $f\left( {da{y_t}} \right)$
captures within-year variation in deaths while
$f\left( {da{y_t}} \right)$
captures within-year variation in deaths while ${\beta _0}$
is the contrast of the smooth function and the explanatory variables, and
${\beta _0}$
is the contrast of the smooth function and the explanatory variables, and ${\varepsilon _{i,j,t}}$
contains the variability not explained by the other terms. For post-emergency periods,
${\varepsilon _{i,j,t}}$
contains the variability not explained by the other terms. For post-emergency periods, ${P_{i,t}} = 1$
and the interaction coefficient make it possible to adapt the effect of the post-emergency period for cause j. The coefficients of the model (1) are estimated by penalized likelihood maximization, considering the population displacement caused by a state of emergency while the smoothing penalty parameters are determined by the restricted maximum likelihood (REML). Model (1) can be used to estimate excess death of cause of death j during period i post-emergency of index time t through the difference between the estimation of the model with
${P_{i,t}} = 1$
and the interaction coefficient make it possible to adapt the effect of the post-emergency period for cause j. The coefficients of the model (1) are estimated by penalized likelihood maximization, considering the population displacement caused by a state of emergency while the smoothing penalty parameters are determined by the restricted maximum likelihood (REML). Model (1) can be used to estimate excess death of cause of death j during period i post-emergency of index time t through the difference between the estimation of the model with ${P_{i,t}} = 1$
,
${P_{i,t}} = 1$
, ${c_{j,t}} = 1$
, and
${c_{j,t}} = 1$
, and ${P_{i,t}}{c_{j,t}} = 1$
versus the estimated model with
${P_{i,t}}{c_{j,t}} = 1$
versus the estimated model with ${P_{i,t}} = 0$
,
${P_{i,t}} = 0$
, ${c_{j,t}} = 1$
, and
${c_{j,t}} = 1$
, and ${P_{i,t}}{c_{j,t}} = 0$
. For
${P_{i,t}}{c_{j,t}} = 0$
. For $i \ge 1$
and
$i \ge 1$
and $j \ge 1$
, we obtain:
$j \ge 1$
, we obtain:
 $${\hat \varphi _{i,j,t}} = {\hat E}\left( {{D_t}{\rm{|}}t,{P_{i,t}} = 1,\;{c_{j,t}} = 1,\;{P_{i,t}}{c_{j,t}} = 1,\;N_t^*,\;da{y_t},\;yea{r_t}} \right),$$
 $${\hat \chi _{i,j,t}} = \hat E\left( {{D_t}{\rm{|}}t,{P_{i,t}} = 0,\;{c_{j,t}} = 1,\;{P_{i,t}}{c_{j,t}} = 0,\;N_t^*,\;da{y_t},\;yea{r_t}} \right).$$ ${\hat b_0}$
,
${\hat b_0}$
, ${\hat a_i}$
,
${\hat a_i}$
, ${\hat{d}_j}$
, and
${\hat{d}_j}$
, and ${\hat e_{i,j}}$
, estimate
${\hat e_{i,j}}$
, estimate ${\beta _0}$
,
${\beta _0}$
, ${\alpha _i}$
,
${\alpha _i}$
, ${\gamma _j}$
, and ω
ij
, respectively. Also, notice that
${\gamma _j}$
, and ω
ij
, respectively. Also, notice that ${\hat \varphi _{i,j,t}}$
uses
${\hat \varphi _{i,j,t}}$
uses $N_t^*$
, a population size unaltered by post-emergency displacement because
$N_t^*$
, a population size unaltered by post-emergency displacement because ${\hat a_i}$
and
${\hat a_i}$
and ${\hat e_{i,j}}$
are already considering the impact of population displacement. Using it again for
${\hat e_{i,j}}$
are already considering the impact of population displacement. Using it again for ${\hat \varphi _{i,j,t}}$
would suggest accounting for the effect twice. This way,
${\hat \varphi _{i,j,t}}$
would suggest accounting for the effect twice. This way,
 $$\eqalign{& & {{\hat \varphi} _{i,j,t}- {{\hat \chi }}_{i,j,t} = \exp (\log (N_t^*) + \hat b_0 + {{\hat a}_i} + \hat{d}_j} + {{\hat e}_{ij}} + \hat f({\rm{da}}{{\rm{y}}_t}) + \widehat {year}_t) \cr & & \hskip 8pt- \exp (\log (N_t^*) + {{\hat b}_0} + {\hat{d}_j}+ \hat f({\rm{da}}{{\rm{y}}_t})+ \widehat {year}_t) \cr & & \hskip 8pt = N_t^*{e^{\hat b_0+ \hat{d}_j + \hat f(da{y_t}) + \widehat {year}_t}}(e^{\hat a_i + \hat e_{ij}} - 1). \cr}$$
The expression ${e^{{{\hat b}_0} + \hat{d}_{j} + \hat f\left( {da{y_t}} \right) + {{\widehat {year}}_t}}}N_t^*$
in Equation (1) represents the number of deaths typically seen, and
${e^{{{\hat b}_0} + \hat{d}_{j} + \hat f\left( {da{y_t}} \right) + {{\widehat {year}}_t}}}N_t^*$
in Equation (1) represents the number of deaths typically seen, and $\left( {{e^{{{\hat a}_i} + {{\hat e}_{ij}}}} - 1} \right)$
represents percentage changes during the post-emergency periods adjusting for the interaction between the J causes of death and the post-emergency periods. Equation (1) is the maximum likelihood estimator for the excess deaths expected from the J causes of death in post-emergency period i. Using Equation (1), the accumulated excess of the J causes of death is,
$\left( {{e^{{{\hat a}_i} + {{\hat e}_{ij}}}} - 1} \right)$
represents percentage changes during the post-emergency periods adjusting for the interaction between the J causes of death and the post-emergency periods. Equation (1) is the maximum likelihood estimator for the excess deaths expected from the J causes of death in post-emergency period i. Using Equation (1), the accumulated excess of the J causes of death is,
 $$\mathop \sum \limits_{t = q}^r \left( {{{\hat \varphi }_{i,j,t}} - {{\hat \chi }_{i,j,t}}} \right)$$
for any period that begins at the index q and ends at r.
In general terms, model (1) allows statistical inference of the duration of the effect in the I post-emergency periods, the effect on the J causes of death during a state of emergency, and the effect caused by the interaction between the I post-emergency periods and the J causes of death in the population displacement.
Data
Our data correspond to daily deaths reported by the Puerto Rico Demographic and Vital Statistics Registry between January 1, 2014, to December 31, 2018, and includes a total of 148,490 records. This work is exempt from requiring human subjects board review. Death certificates are processed using Automatic Classification of Medical Entry (ACME) software. The input to ACME is the multiple cause-of-death International Classification of Diseases (ICD-10) codes assigned to each entity (eg, disease condition, accident, or injury) listed on death certificates. ACME then applies the World Health Organization (WHO) rules and guidelines to the ICD codes and selects an underlying cause of death. Reference Lu26
Results
Population Displacement
Demographic data indicate that Puerto Rico registers a high migratory movement, due to the economic crisis it has faced since 2006. Reference DeWaard, Johnson and Whitaker27–Reference Rivera30 After the passage of Hurricane Maria in Puerto Rico, lack of water or water service, Reference DeWaard, Johnson and Whitaker27 and a health service crisis Reference Panditharatne31–Reference Glassman33 led to an increase in population displacement, which can permanently alter the demographic composition of the affected regions. Reference Acosta, Kishore and Irizarry24
Like Rivera and Rolke, Reference Rivera and Rolke15 we estimate population displacement through annual estimates of the resident population of Puerto Rico according to the data US Census Bureau adjusted for passenger movement. Usually, passenger movement is a biased indirect variable of resident migration because it includes the visitor seasonal movements, Reference Velazquez-Estrada, Marazzi and Orenstein-Cardona34 and tourism has been 1 of the few growing sectors in the Puerto Rican economy. Reference Rivera30 However, a dramatic drop in visitors Reference Rivera and Rolke15 occurred the months after the arrival of Hurricane Maria. Other methods like the use of disaster maps Reference Echenique and Melgar35 did not significantly affect our results.
Data from daily death certificates (D t ) were combined with population estimates (N t ) to produce daily mortality rates (R t );
 $${R_t} = {{{D_t}} \over {{N_t}}} \times 1000 \times 365$$
Figure 1 illustrates the daily mortality rate during the years 2014-2018 in Puerto Rico. This graph indicates that the first and last months of each year generally have the highest death rates a pattern commonly seen in other locations. Reference Phillips, Barker and Brewer36
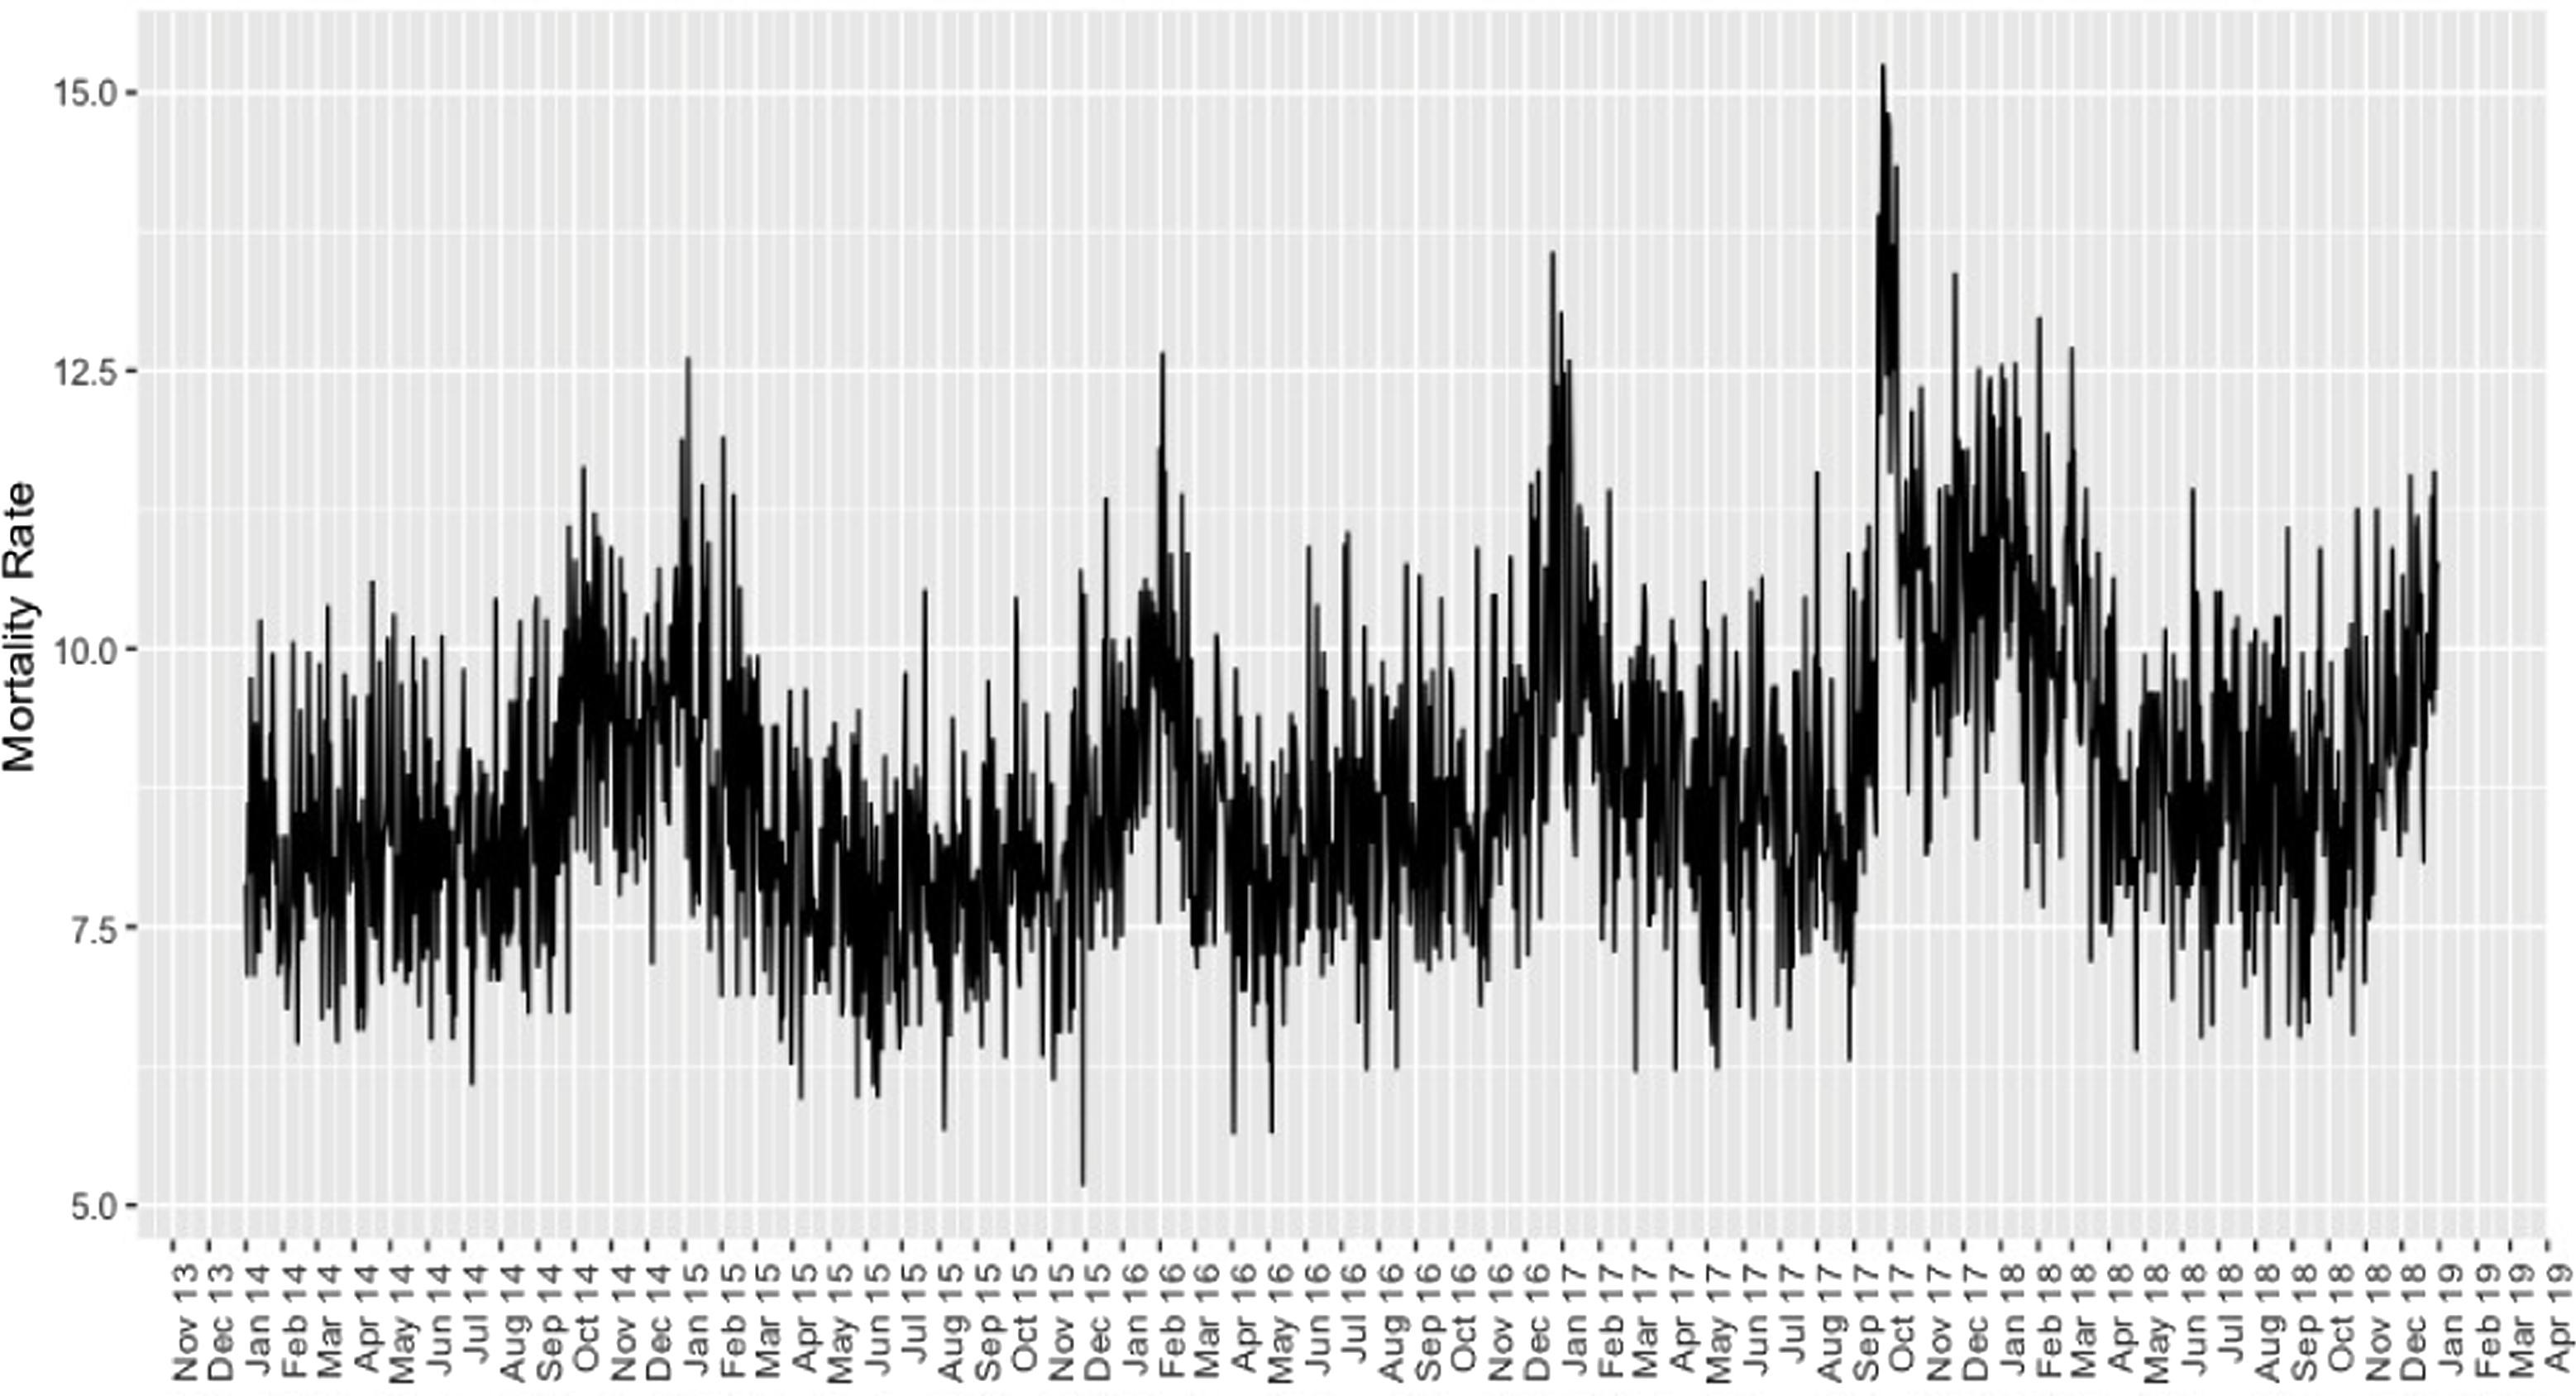
Figure 1. Average daily mortality rate from 2014 to 2018 according to deaths reported by the Puerto Rico Demographic and Vital Statistics Registry.
On the other hand, Figure 1 displays a drastic spike in mortality rate in the last days of September 2017 and remained high until the beginning of 2018. It is not clear from the figure whether mortality rates increased over the years, yet our model of excess deaths takes the variable $yea{r_t}$
can explain this type of temporal fluctuation.
$yea{r_t}$
can explain this type of temporal fluctuation.
In the preliminary analysis, the models did not indicate over-dispersion, so a Poisson model was used.
Cumulative Excess Deaths by Cause
According to the WHO, 37 the Institute of Statistics of Puerto Rico, 38 and Cruz-Cano and Mead, Reference Cruz-Cano and Mead16 the main causes of death in Puerto Rico are cancer, hypertension, cardiovascular, kidney, respiratory diseases (Malinow et al.), Reference Malinow, Rivera-Santiago and López-Malpica39 and conditions that affect the nervous and endocrine systems. Other causes of death of interest are traffic accidents, homicides, and suicides. Reference Petrosky, Ertl and Sheats40 In this study, we consider these causes of death along with sepsis, accidents due to any type of fall, and “undefined deaths” to determine if said causes presented an excess of mortality after the natural disaster.
No interannual pattern is observed in the selected causes of death (Figure 2). On the other hand, deaths due to “other causes of death,” “heart,” “cancer,” and “diabetes” had the highest average monthly mortality rate, followed by deaths due to “Alzheimer’s or Parkinson’s,” “respiratory diseases,” “hypertension,” “cerebrovascular,” “sepsis,” “pneumonia and influenza,” “renal insufficiency,” “homicide,” and “undefined causes.” Last, “suicide,” “fall accidents,” and “traffic” display low mortality rates. We use the class “other causes of death” and the year “2014” as the reference categories for these variables.
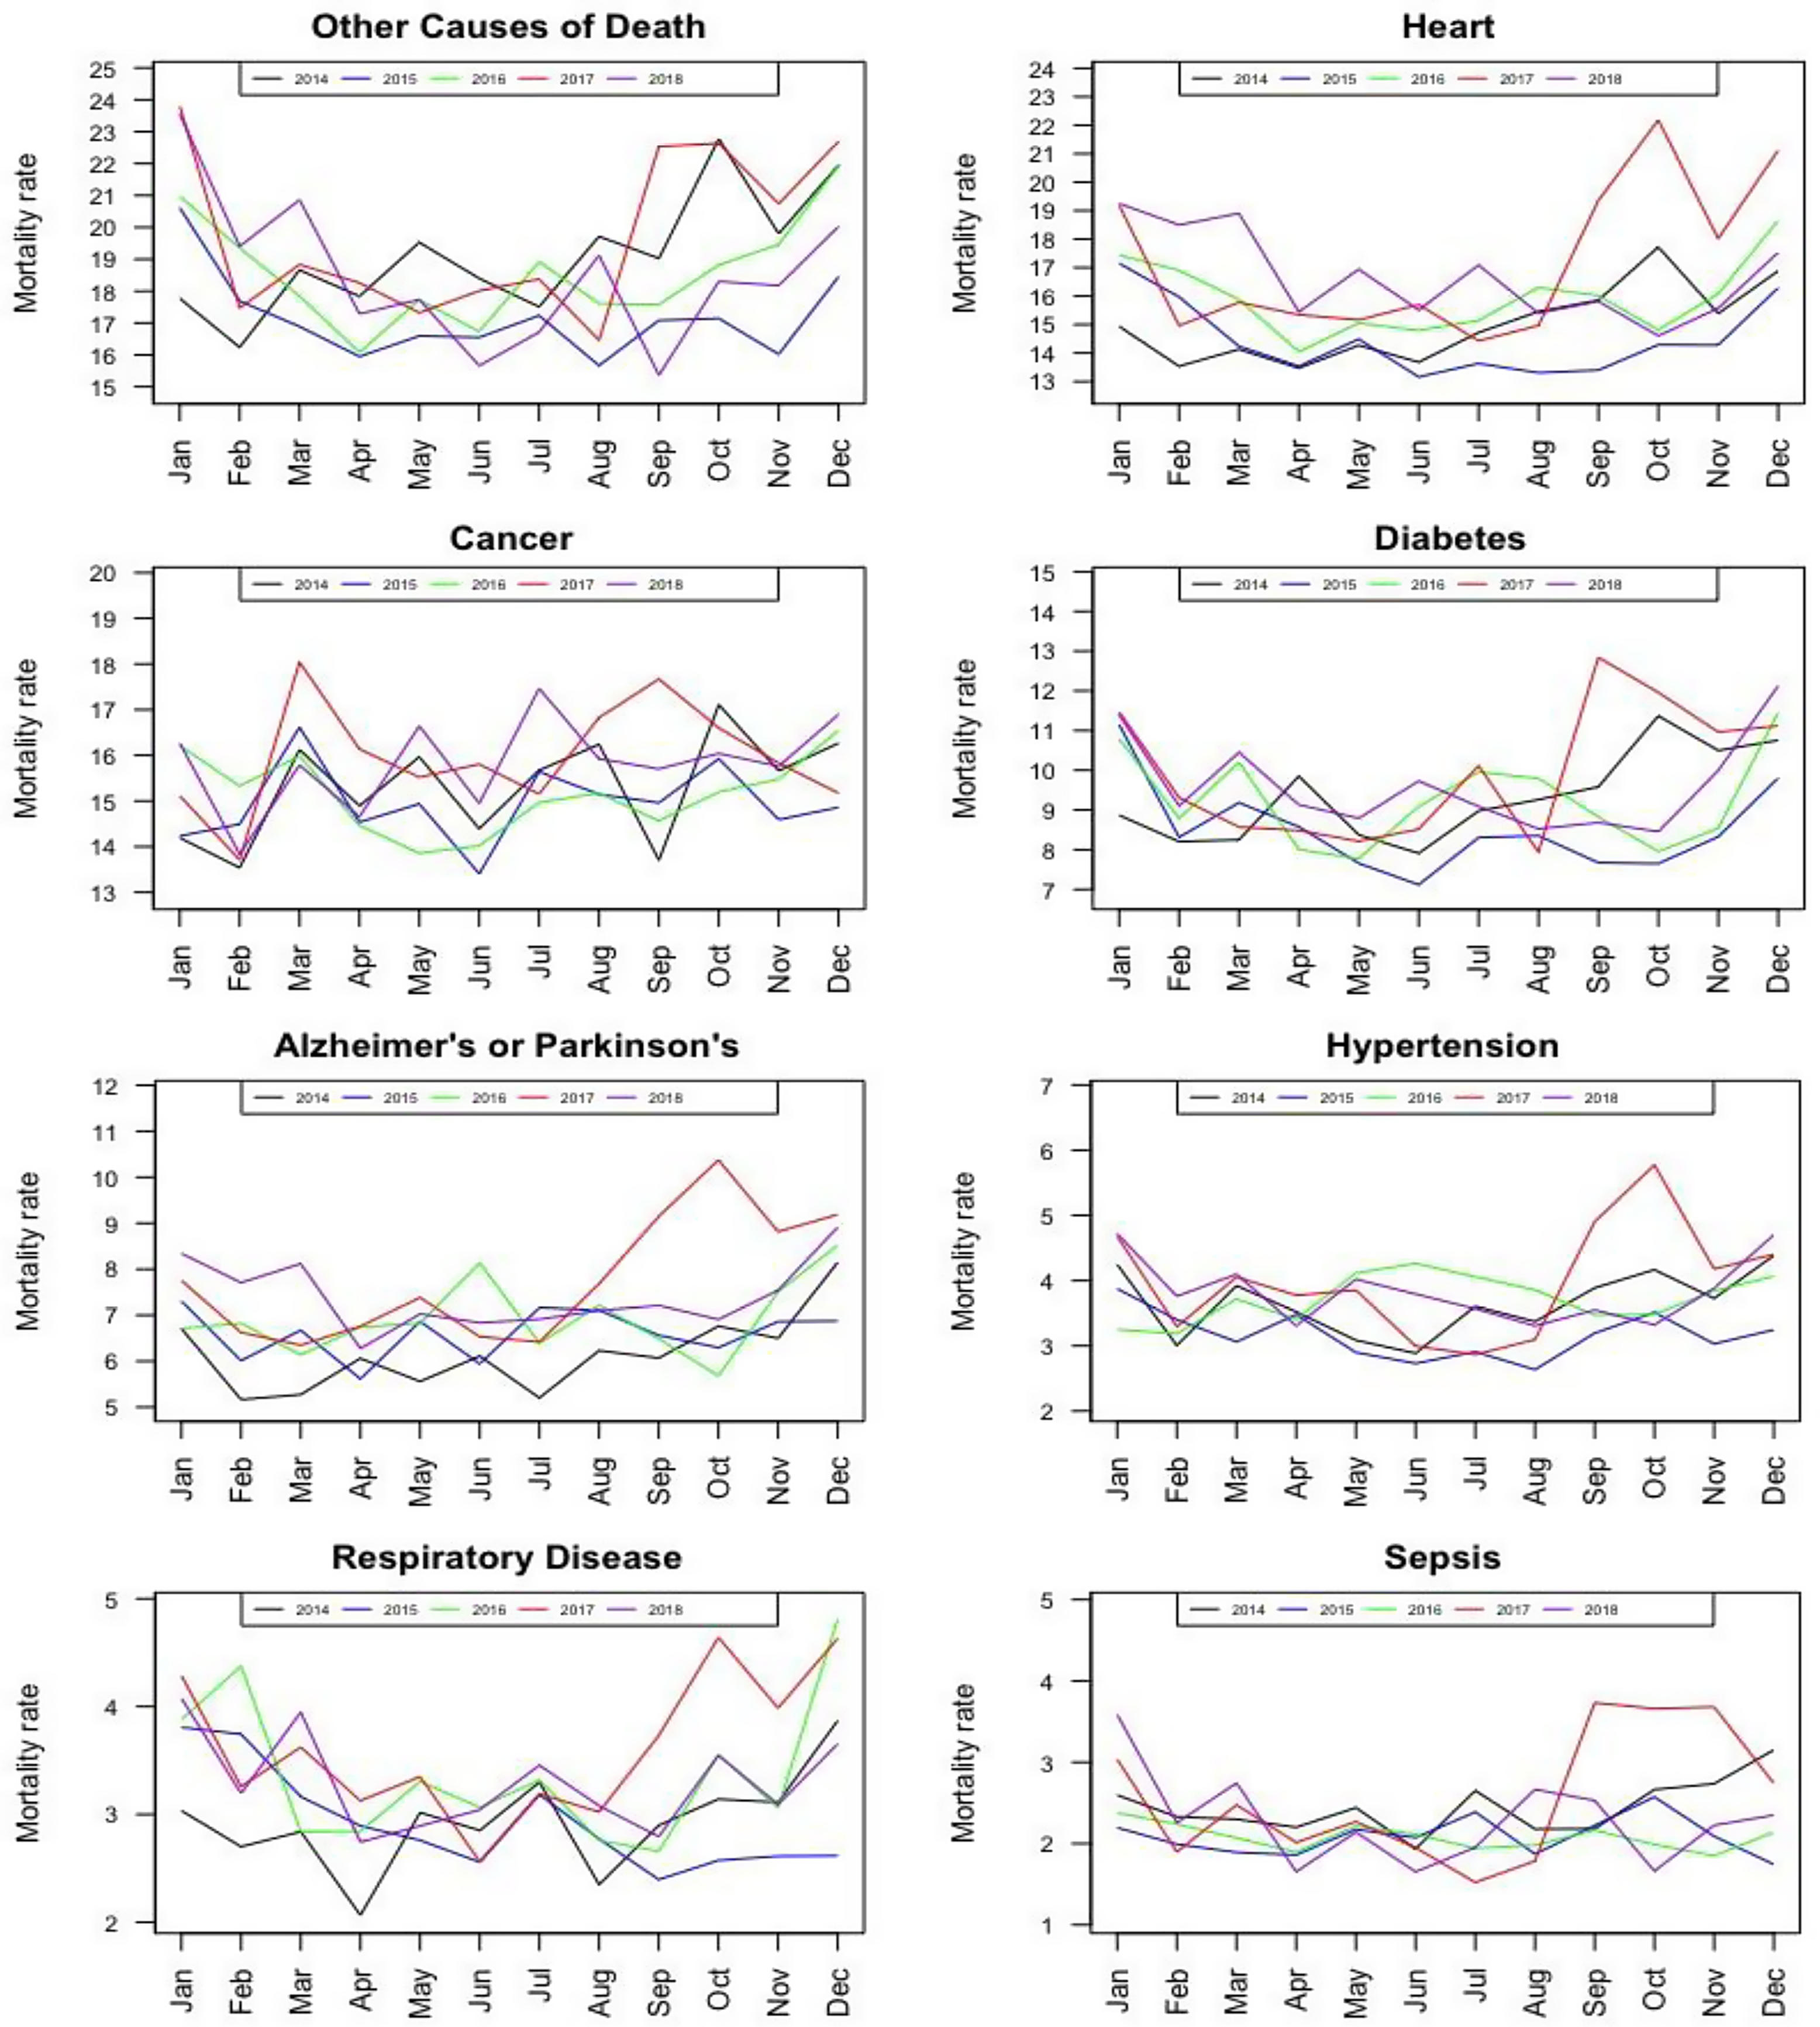
Figure 2. Monthly mortality rates for several causes of death during the years 2014-2018 in Puerto Rico.
Table 1 presents the estimates of excess and cumulative excess deaths for the 14 causes of death according to 7 post-Maria periods and their respective 95% confidence intervals based on model (1).
Table 1. Estimates of excess death and cumulative excess death for the different causes of death according to model 1 and their respective 95% confidence intervals
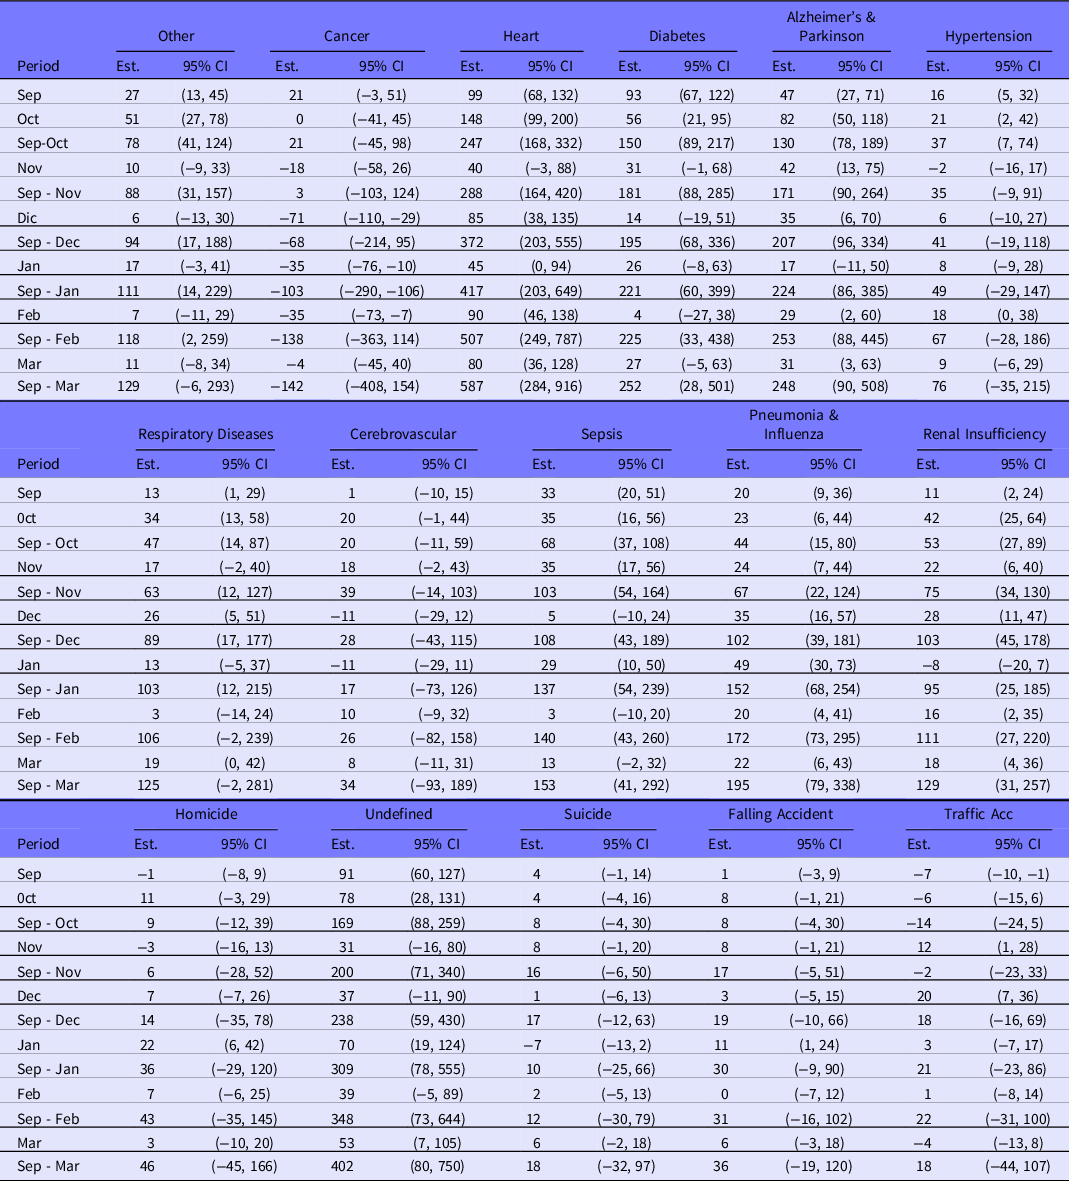
A total of 21 excess deaths during September 20 to 30, 2017, were estimated for “cancer”, this period being the only one that presented excess deaths. Consequently, the cumulative total excess death intervals with 95% confidence from October 2017 to March 2018 included zero. For October 2017, 148 excess deaths are estimated for “heart diseases.” For the periods from September 20 to 30, December, February, and March, the excess ranged from 80 to 99 deaths. While, from September to March we are 95% confident that (284, 916) excess heart disease deaths occurred. For “diabetes,” the first 2 post-Maria periods showed an excess of 93 and 56 deaths, respectively. For the entire post-Maria period, considerable uncertainty is found on cumulative excess deaths: (28, 501). It was found that for “Alzheimer’s or Parkinson’s,” “pneumonia and influenza,” “sepsis,” “renal insufficiency,” and “undefined” excess deaths during the entire post-Maria period were significant. According to the 95% confidence intervals for causes “suicide,” “falling accidents,” and “traffic,” there is no statistically significant evidence of excess deaths from September 20-30, 2017, to March 2018.
Overall, the causes of death with the largest excess deaths during the 7 post-emergency periods were “heart” and “undefined.” It should be emphasized that the excess from November 2017 to January 2018 for “pneumonia and influenza” were not necessarily due to Maria as seasonal cases are expected. Reference Paz-Bailey, Quandelacy and Adams41
Figures 3 and 4 display cumulative excess deaths for all causes; in red is the estimated value while black functions are upper and lower 95% confidence bounds.
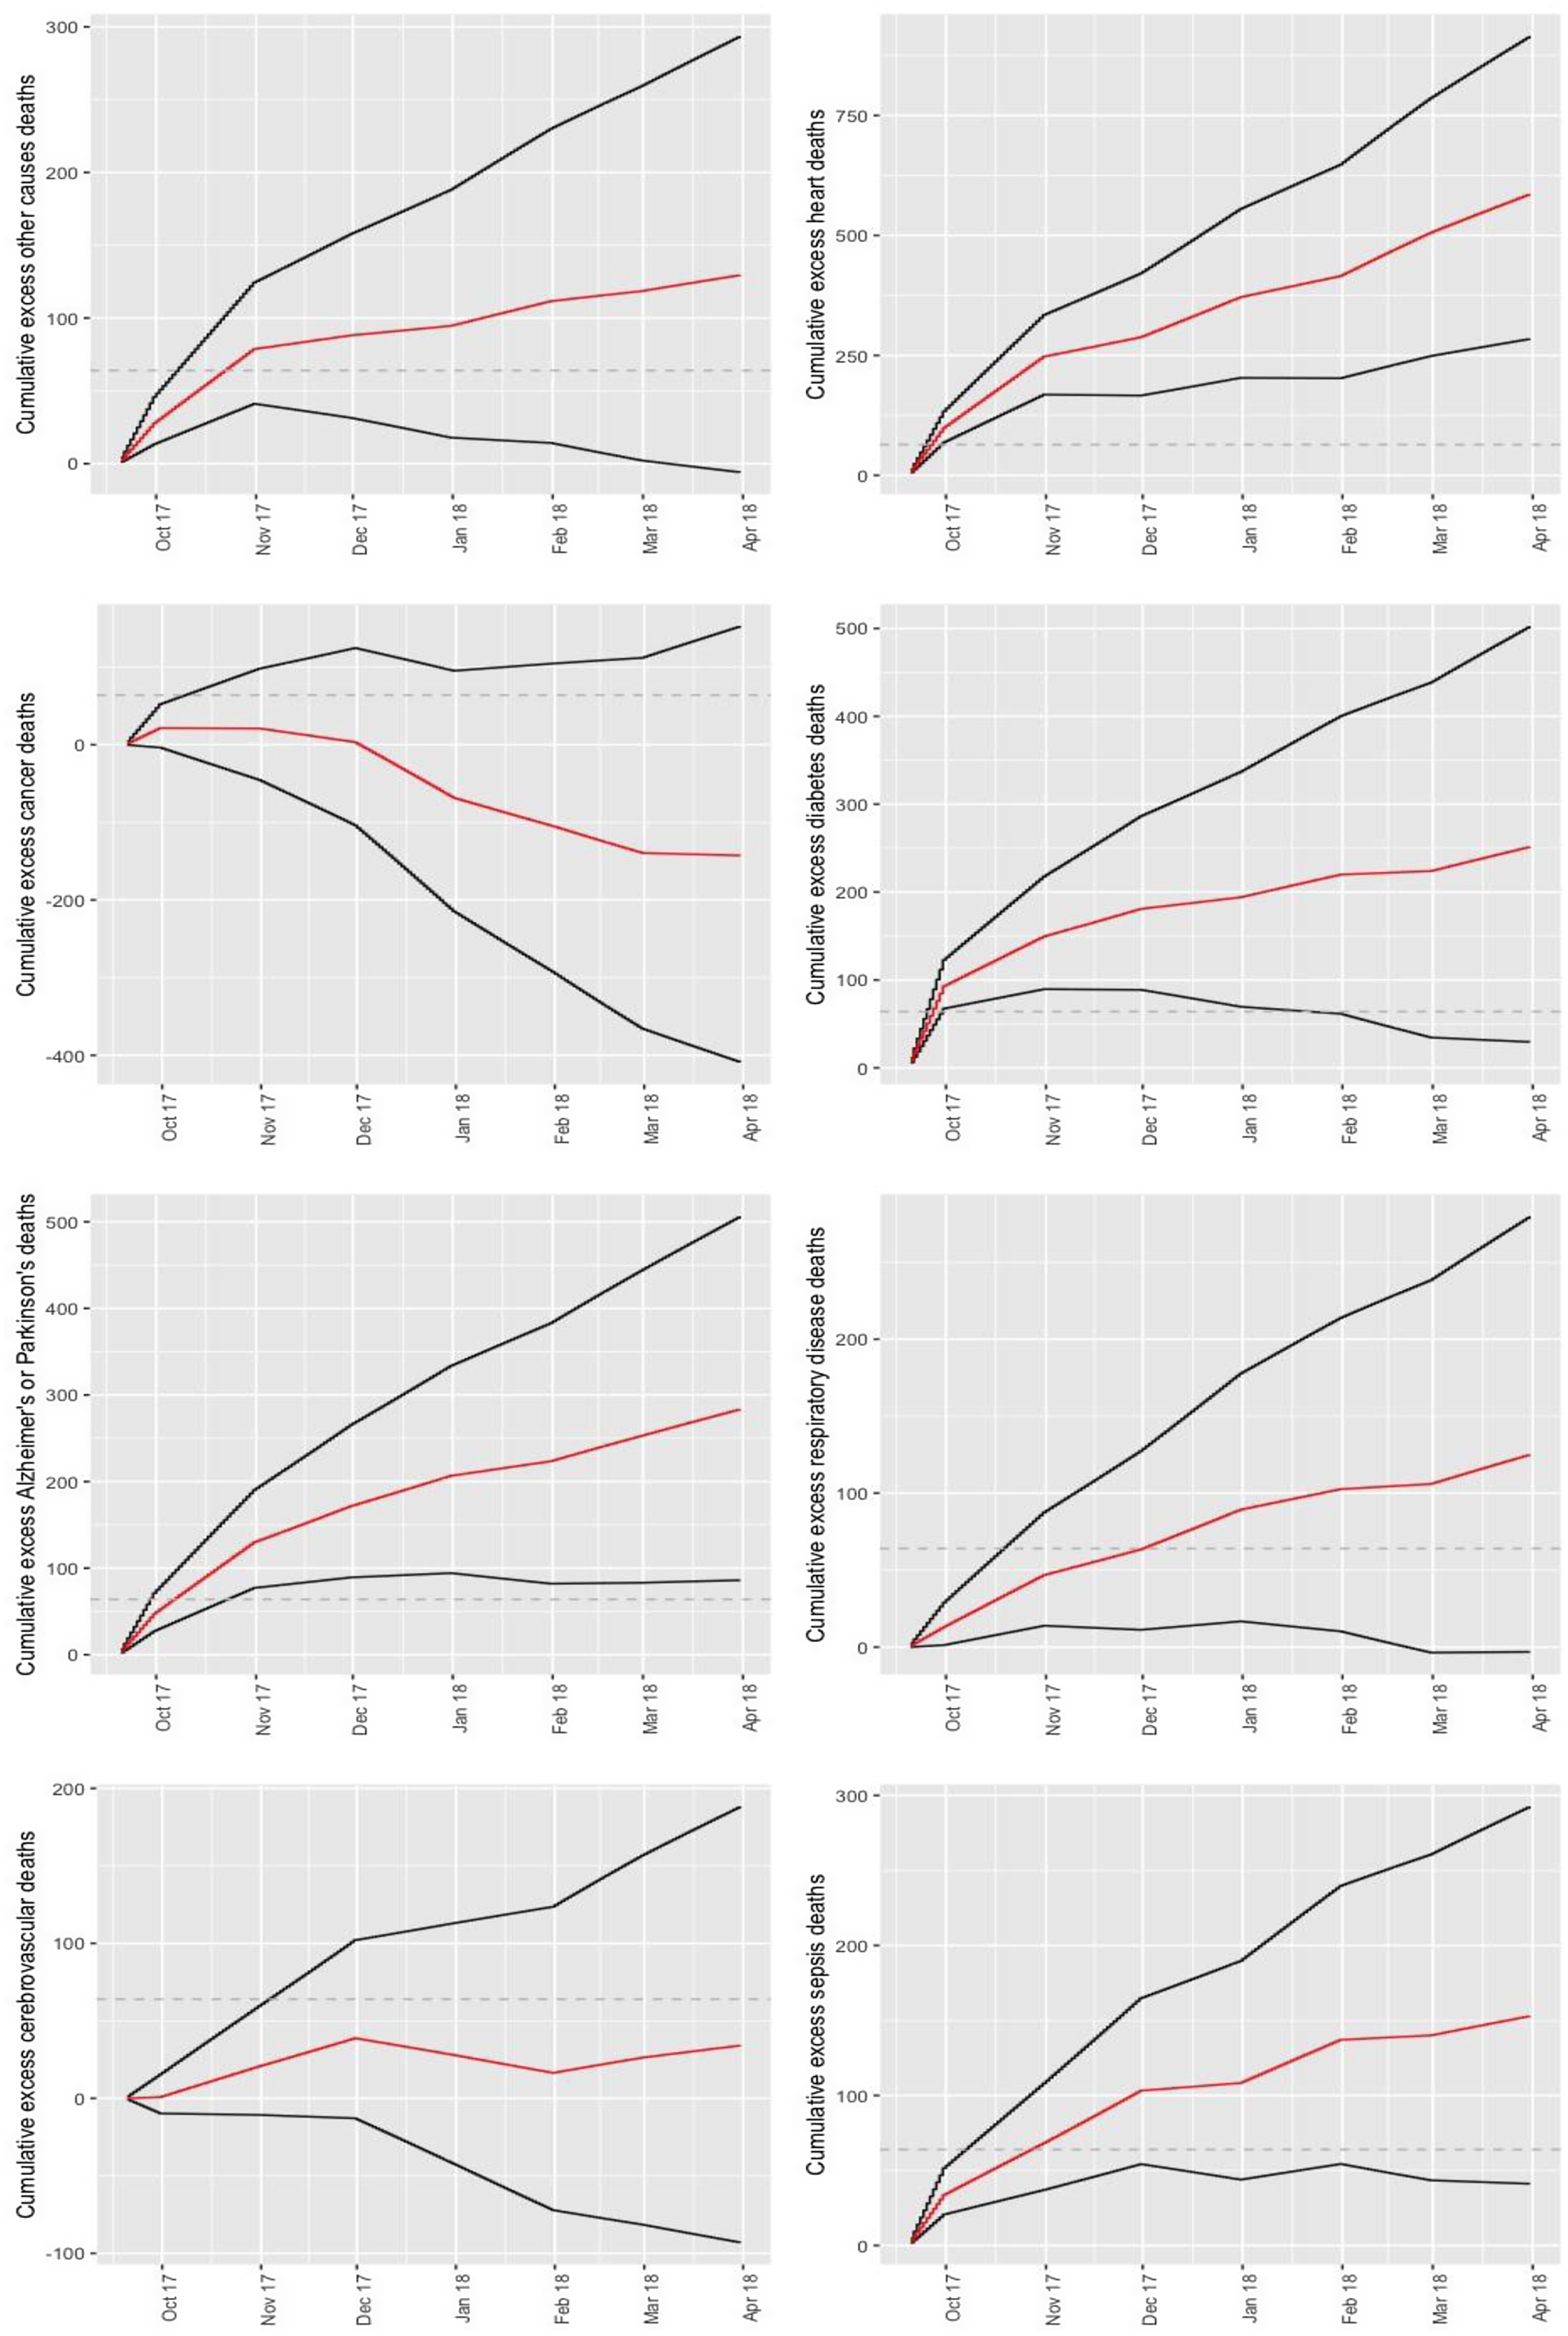
Figure 3. Cumulative excess death estimates from September 20 to March 31, 2018, according to: other causes, heart disease, cancer, diabetes, Alzheimer or Parkinson’s, respiratory disease, cardiovascular disease, and sepsis. Dashed line represents the 64 deaths authorities initially attributed to Hurricane Maria.
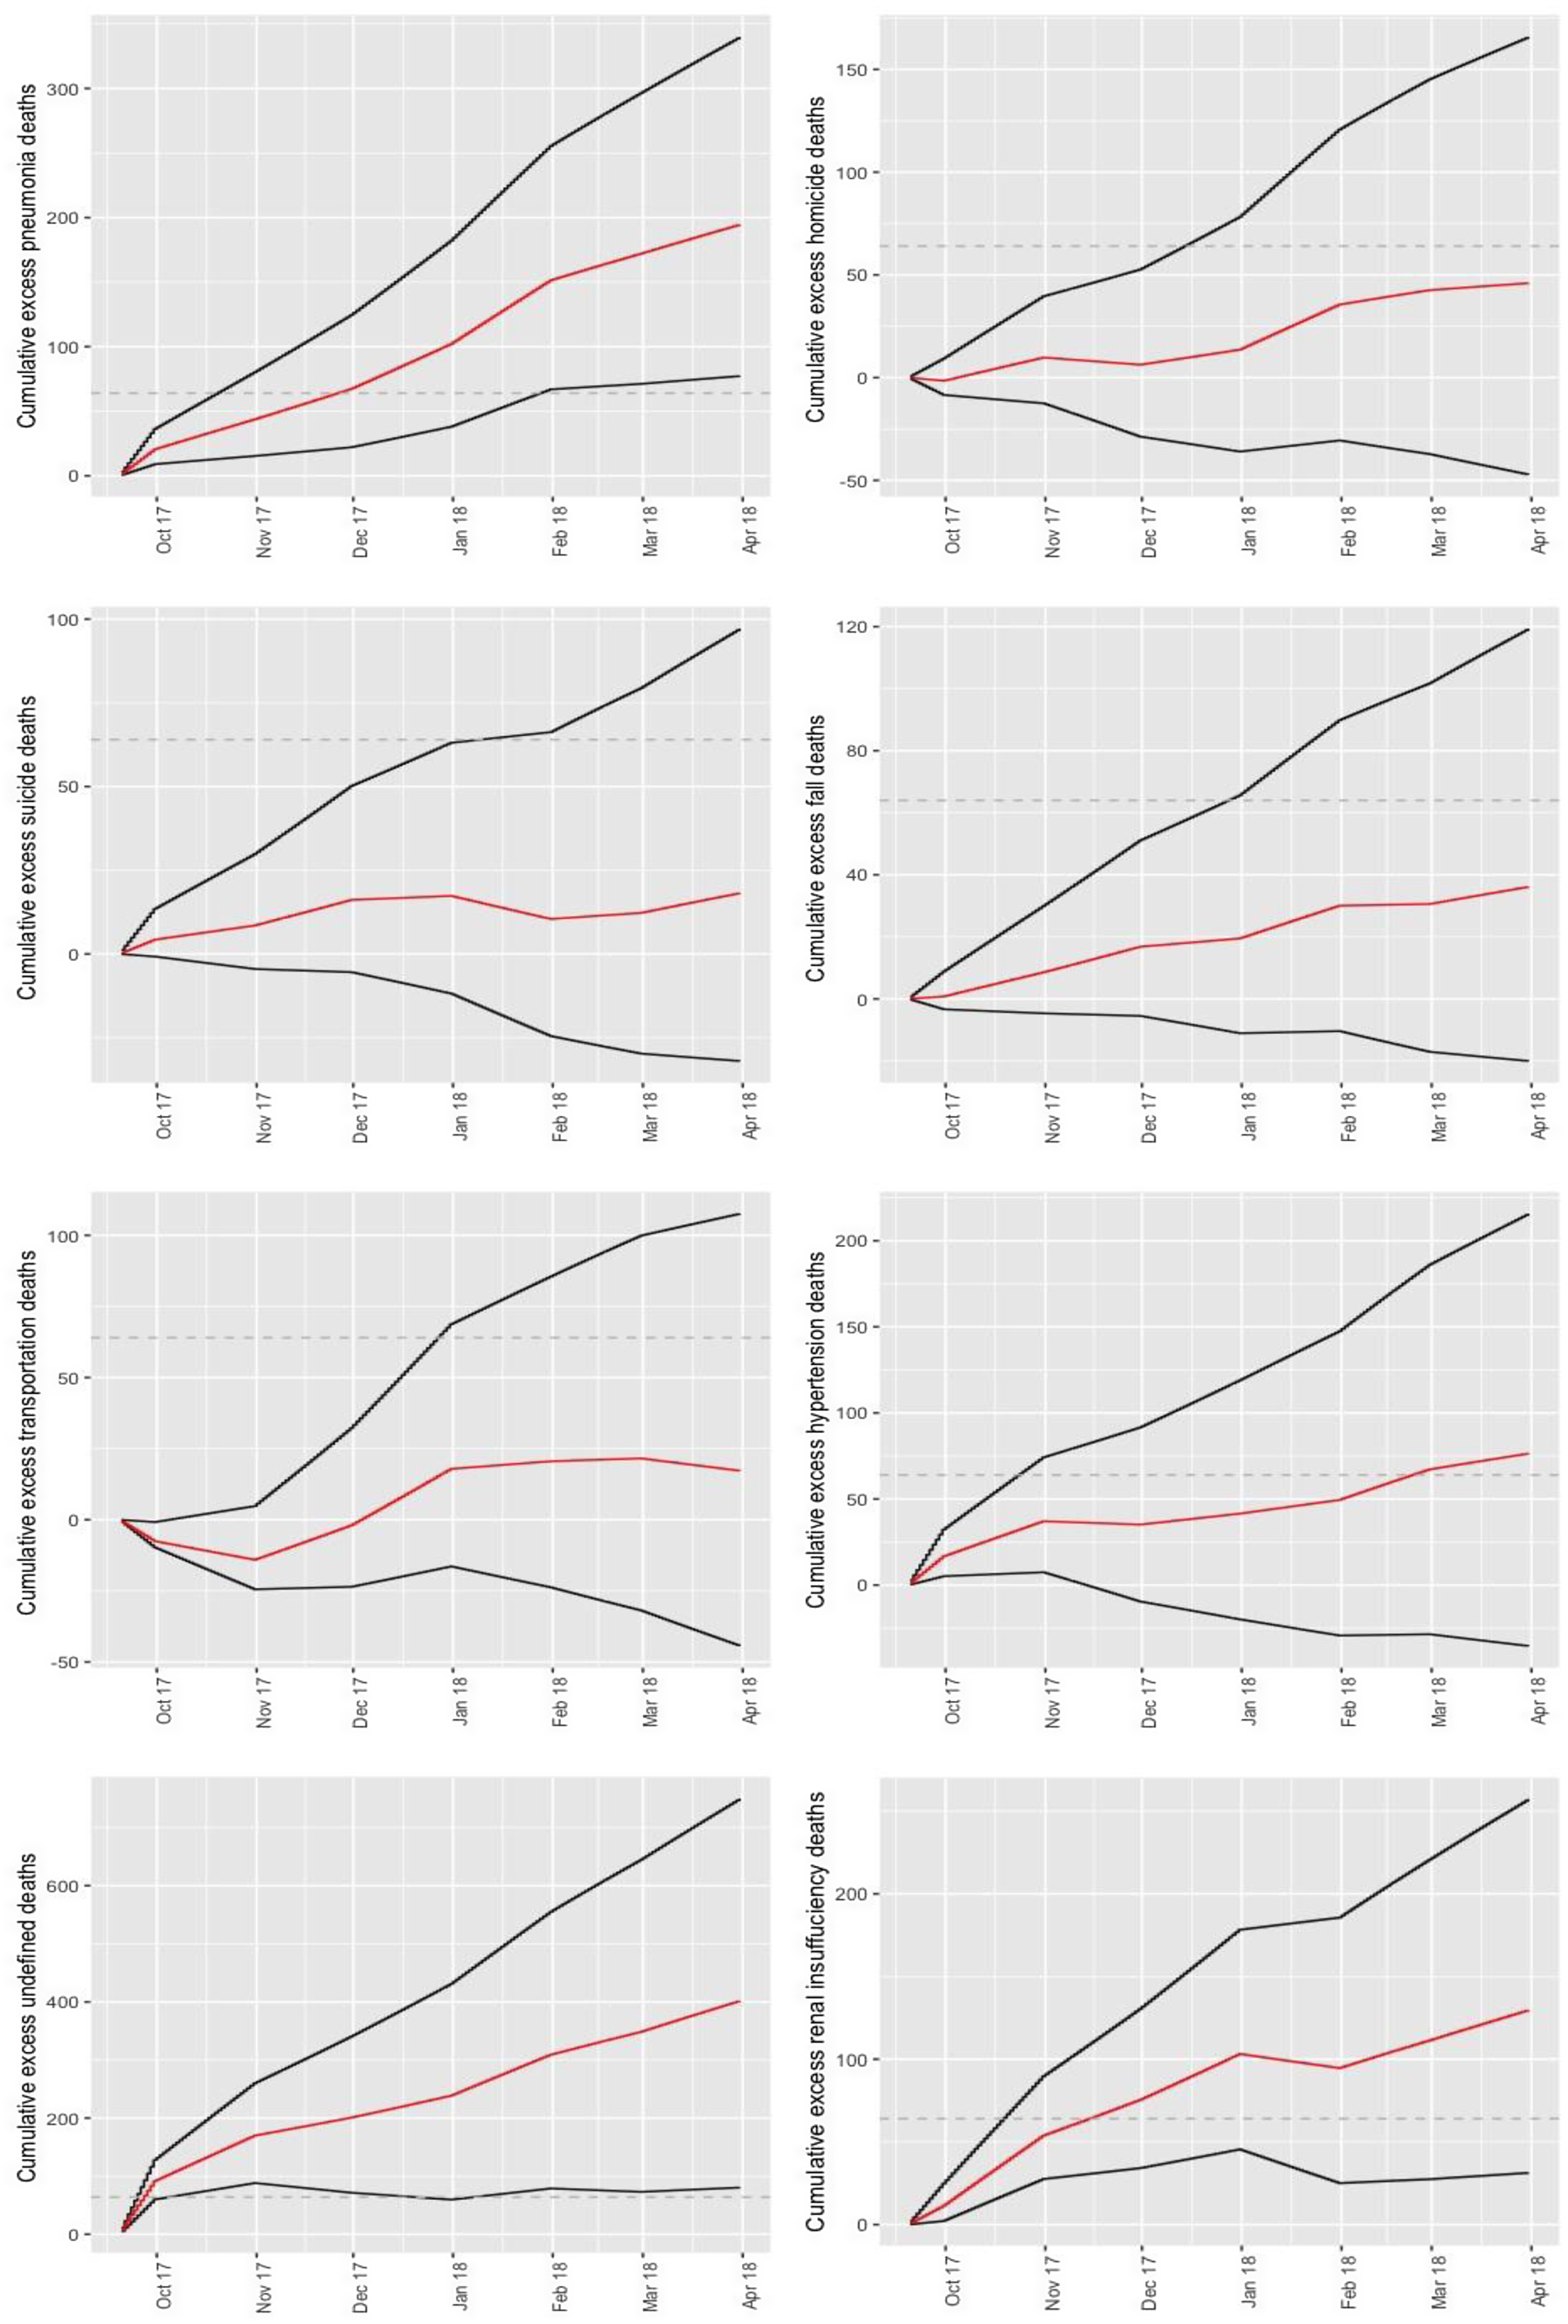
Figure 4. Cumulative excess death estimates from September 20 to March 31, 2018, according to: pneumonia, homicide, suicide, fall, traffic accident, hypertension, undefined, and renal insufficiency. Dashed line represents the 64 deaths authorities initially attributed to Hurricane Maria.
Discussion
This study explores the excess mortality due to NCDs and other indirect causes during the state of emergency generated after Hurricane Maria’s passage over Puerto Rico. The model adjusts for intra-annual variability and population displacement. This allows greater precision when estimating excess mortality. Moreover, our method can infer on how long an emergency leads to an increase in deaths. To achieve our objective, the statistical model from Rivera and Rolke Reference Rivera and Rolke15 was extended to account for different causes of deaths and included cause of death and post-emergency interaction terms so that the model can adjust the effect during the post-emergency period i for each cause of death. See Rivera et al. Reference Rivera, Rosenbaum and Quispe19 for further explanation on why our semiparametric model is preferable over a conventional excess mortality model.
We propose the following potential mechanisms for underestimation of Hurricane Maria’s death toll: indirect deaths from not seeking care for emergent conditions; delayed treatment for ailments when unable to reach facilities due to collapse of power, clean water, transportation, and cell phone infrastructure; or needing treatment for ailments and being turned away from emergency departments due to infrastructure issues, crowding, and subjective interpretations of guidelines. Previous research has pointed to the impact of some of these mechanisms during other emergencies. For example, during the COVID-19 pandemic patients with heart attacks and stroke delayed seeking care. Reference Boukhris, Hillani and Moroni42 We find that the causes of deaths due to sepsis, and diabetes, presented the highest excess deaths for residents of Puerto Rico during September and October 2017 compared with the pre-Maria period and relative to “other causes of death.” Excess death due to heart disease, Alzheimer’s/Parkinson, pneumonia and influenza, and renal failure persisted for months after landfall.
The excess deaths observed from renal insufficiency may be attributed to the dialysis centers being left without electric power and electric generators not being designed to be used for long periods. Reference Michaud and Kates43 On the other hand, an increase in sepsis deaths may be due to health problems caused by a lack of supply of potable water because 20 of 51 wastewater treatment plants were out of service 1 mo after the arrival of Hurricane Maria. Reference Michaud and Kates43 For its part, the excess mortality from this disease was caused by multiorgan dysfunction syndrome, due to poor access to care in intensive care units and the shortage of drug supply. Reference Driessen, Heijnen and Hulsewe44 Furthermore, Alzheimer’s excess deaths could be due to people who suffer from this disease tending to live in care centers, and the state of emergency led to a reduction in their medical care, routine treatments. Reference Ruhm45 Difficulty in continuing with adequate nutrition adequate medical care, lack and loss of medicines, and difficulties in monitoring their levels of glucose resulted in an increase in deaths due to diabetes. Reference Quast, Andel and Sadhu46
Cruz-Cano and Mead Reference Cruz-Cano and Mead16 evaluated some causes of death that were traced and reported by the Department of Health of Puerto Rico but only until October 2017. Our estimates are comparable to theirs, though we study more causes of deaths, find evidence Hurricane Maria led to excess deaths until March 2018, we find significant renal failure excess deaths and infer there was an increase in deaths where the cause was left undefined.
The death toll of a major national emergency, and particularly indirect deaths, are difficult to assess through forensic examination, primarily because severe infrastructure damage hinders proper forensic protocol. Reference Rivera and Rolke15,Reference Demaio, Jamieson and Horn47,Reference Ryan, Franklin and Burkle48 Excess death analysis is an alternative way to assess the death toll of a major national emergency. Because such an analysis uses secondary death certificate data, its implementation requires care to reduce bias of estimates. For example, other incidents such as a dengue outbreak may affect excess death estimates when the methods are applied soon after emergencies. Moreover, estimates of excess deaths just after a national emergency are influenced by incomplete provisional death certificate data, and its weighted adjustments 49 may not fully compensate for data incompleteness. Reference Rosenbaum, Stillo and Graves20
Furthermore, the statistical methods used are unable to measure small excess mortality because the confidence intervals would be too wide. For example, for almost all the post Hurricane Maria landfall periods analyzed in this work, our point estimates of excess suicide, hypertension, and respiratory disease deaths are greater than zero. However, the corresponding confidence intervals lead us to conclude that these excess deaths are not statistically significant, except for respiratory disease during the September to December 2017, and hypertension during the September to October 2017 period (Table 1). For causes of death with generally low counts such as suicide, methods derived from zero inflated Poisson distributions may be required.
Estimating excess deaths in Puerto Rico by cause after Hurricane Maria helps us understand the effect of the natural disaster and allows us to assess the weaknesses in the health system to better face these types of incidents in the future. Reference Perreira, Lallemand and Napoles50 Authorities need tools to reduce the number of deaths due to state emergencies. Some strategies include the use of technology in telemedicine, applications for mobile devices, virtual programs Reference Hacker, Briss and Richardson51 and remote monitoring. Reference Bowman, Nuh and Rahim52,53 Considering the above, it is expected that these measures will reduce the risk of death in the population and better prepare health professionals for future states of emergency generated by different disasters (eg, hurricanes, tsunamis, and pandemic).
Supplementary material
The supplementary material for this article can be found at https://doi.org/10.1017/dmp.2023.165
Acknowledgments
We thank Wolfgang Rolke and Axel Cubero for helpful conversations. The authors also thank the anonymous referees and the associate editor for their helpful recommendations.
Competing interests
The author(s) declare none.


