INTRODUCTION
The risk of reactivation of latent tuberculosis infection (LTBI) among haemodialysis (HD) patients is higher than in the general population [Reference Chou1, Reference Moore2], possibly due to uraemic immunodeficiency and compromised cell-mediated immunity. Early detection of LTBI is important to prevent the development of active tuberculosis (TB) in the HD patients [Reference Kim3], and many clinical guidelines recommend screening for LTBI in HD patients.
There is no gold standard diagnostic test for LTBI. Until recently, diagnosis of LTBI was based on induration size following a tuberculin skin test (TST). This test has several limitations. False-positive results can occur following non-TB mycobacterial infection or previous Bacillus Calmette–Guérin (BCG) vaccination [Reference Farhat4] and in people with immune deficiency the test may be falsely negative [Reference Lee5]. To offset these the challenges regarding TST, the interferon-γ release assays (IGRAs) tests are introduced. IGRAs are based on the T-cells respond to restimulation with Mycobacterium tuberculosis-specific antigens by secreting interferon-γ (IFN-γ) among patients with TB infection. Two such tests are QuantiFERON-TB Gold (T-SPOT.TB) and QuantiFERON-TB Gold In-Tube (QFT-GIT) [6].
Previous published study have demonstrated IGRAs have higher specificity, positive predictive values (PPV) and negative predictive value (NPV) compared with TST for LTBI detection [Reference Diel7]. The authors in the aforementioned study point out the results for PPV must be interpreted with caution because PPV is context dependent, but the results of NPV in low-prevalence countries are reasonably confident because the likelihood of false-negative results is low [Reference Diel7]. It has been suggested that in immunocompetent patients, IGRAs are superior to TST in detecting LTBI [Reference Diel8]. In HD patients due to impaired T-cell activation upon mitogenic stimulation, the secretion of IFN-γ may be diminished leading to unreliable IGRAs results [Reference Sester9].
Many previous studies addressed the diagnostic performance of QFT-GIT and TST in HD patients and measured clinical agreement (κ estimate) between the tests. Reported κ estimates range 0·15–0·64 [Reference Chung10, Reference Seyhan11]. We conducted systematic review of individual studies comparing QFT-GIT with TST among HD patients and performed meta-analysis of reported κ estimates.
METHODS
Search strategy
We searched Medline (January 1950 to May 2016), Web of Sciences (January 1945 to May 2016), and Scopus (January 1973 to May 2016). Search strategy was: ‘latent tuberculosis infection’, ‘QuantiFERON’, ‘interferon-gamma release test’, ‘interferon-gamma release assay’, ‘enzyme-linked immunospot assay’, ‘tuberculin test’, ‘PPD-S’, ‘skin test’, ‘Mantoux TST’, κ, κ-value, κ-statistic, agreement, observational study, English publishing. This search strategy was applied for search in each mentioned databases. The search strategy in detail is presented in the Supplementary. Two authors (E.A. and A.D.-I.) independently reviewed potentially relevant studies, study selection, data abstraction and quality assessment. Any disagreement between the authors was referred to other author (E.M.) for final decision. Email communication with corresponding authors of the retrieved articles was done for retrieving additional or unpublished studies or provision information on missing, incomplete and unreported variables.
Study selection
Title/abstracts of retrieved studies were independently reviewed. Full articles were obtained for review where no insufficient information was presented in the abstract. From retrieved studies in initial search as potentially relevant, original articles or letters to the editor were chosen when they have the following criteria: original data were presented for κ and standard error (SE) estimate, QFT-GIT and TST simultaneously performed in the same individual. Studies of confirmed active TB and those screening for LTBI among KTRs (kidney transplant recipients) were excluded.
Data abstraction and quality assessment
For all included studies, the following information was extracted; first author, year of publication, study country, sample size, sex ratio, mean age, the history of BCG vaccination (yes/no/unknown), TST induration diameter defined as positive. The assessment of study quality was performed by application of modified STrengthening the Reporting of OBservational studies in Epidemiology (STROBE) checklist [Reference von Elm12]. The following criteria were assessed; (1) how sample size was determined (2) the study population with inclusion and exclusion criteria were clearly defined, (3) heterogeneity of results was explained by relevant methods such as subgroup analysis, (4) appropriate methods were used to measure QFT-GIT and TST and (5) applying sensitivity analysis to clarify the effect of prevalence of the attribute. Study quality was classified as high quality – studies that fulfilled all criteria; intermediate quality – studies filing to meet at most one criterion; low quality – studies not fulfilling more than one criterion.
Data analysis
Agreement between QFT-GIT and TST is estimated as Cohen's κ. The κ measures the degree to which agreement between two tests is greater than that expected by chance alone. SE of Cohen's κ with 95% confidence intervals (CI) for all studies were estimated by suggested method of Fleiss JL [Reference Fleiss, Levin and Paik13]. Statistical heterogeneity across the studies was measured by I 2 test. Subgroup analysis and meta-regression were used to explore the source of study heterogeneity. Publication bias was examined using funnel plots and Egger test. Analysis was performed using Stata 11·0 (Stata Corp, College Station, TX, USA).
RESULTS
The characteristics of included studies
Our search strategy yielded 6744 records. We identified 42 additional records through reference list of retrieved studies and email communication with authors – among them 10 studies fulfilled the inclusion criteria [Reference Kim3, Reference Chung10, Reference Seyhan11, Reference Agarwal14–Reference Maden20]. For two studies SE of κ was derived from the reported confidence bounds [Reference Lee19, Reference Maden20]. Two studies did not include original data for κ estimate [Reference Chung10, Reference Jeong18] and were not included into meta-analysis. Finally, eight studies involved a total of 901 HD patients considered for inclusion in meta-analysis [Reference Kim3, Reference Seyhan11, Reference Agarwal14–Reference Hoffmann17, Reference Lee19, Reference Maden20]. Figure 1 shows the selection process of the studies; and detailed information on the eight included studies is presented in Table 1.
Fig. 1. A flow chart depicts the stages of retrieving references, checking eligibility criteria, and including the final articles into the meta-analysis.
Table 1. Characteristics of the included studies into meta-analysis to test the clinical usefulness of QFT-GIT vs. TST for diagnosis of latent TB in HD patients
* Sample size without indeterminate results.
The quality assessment and publication bias
Four studies were of intermediate quality [Reference Kim3, Reference Agarwal14, Reference Ates16, Reference Lee19] and four studies were low quality [Reference Seyhan11, Reference Ahmadinejad15, Reference Hoffmann17, Reference Maden20] (Table 2). Symmetry funnel plots and Egger's test (P-value = 0·11) suggest no publication bias (Fig. 2).
Fig. 2. Funnel plot of κ estimate across the studies.
Table 2. Quality of studies assessing the κ estimate between QFT-GIT and TST
* Explanation of each criteria is as follows: determining study population in a logical way; using eligibility criteria and appropriate methods for participation selection; applying relevant methods to examine heterogeneity of κ estimate across subgroups; using valid measurement methods for both QFT-GIT and TST; conducting sensitivity analysis to address the effect of HD prevalence.
Statistical analysis results
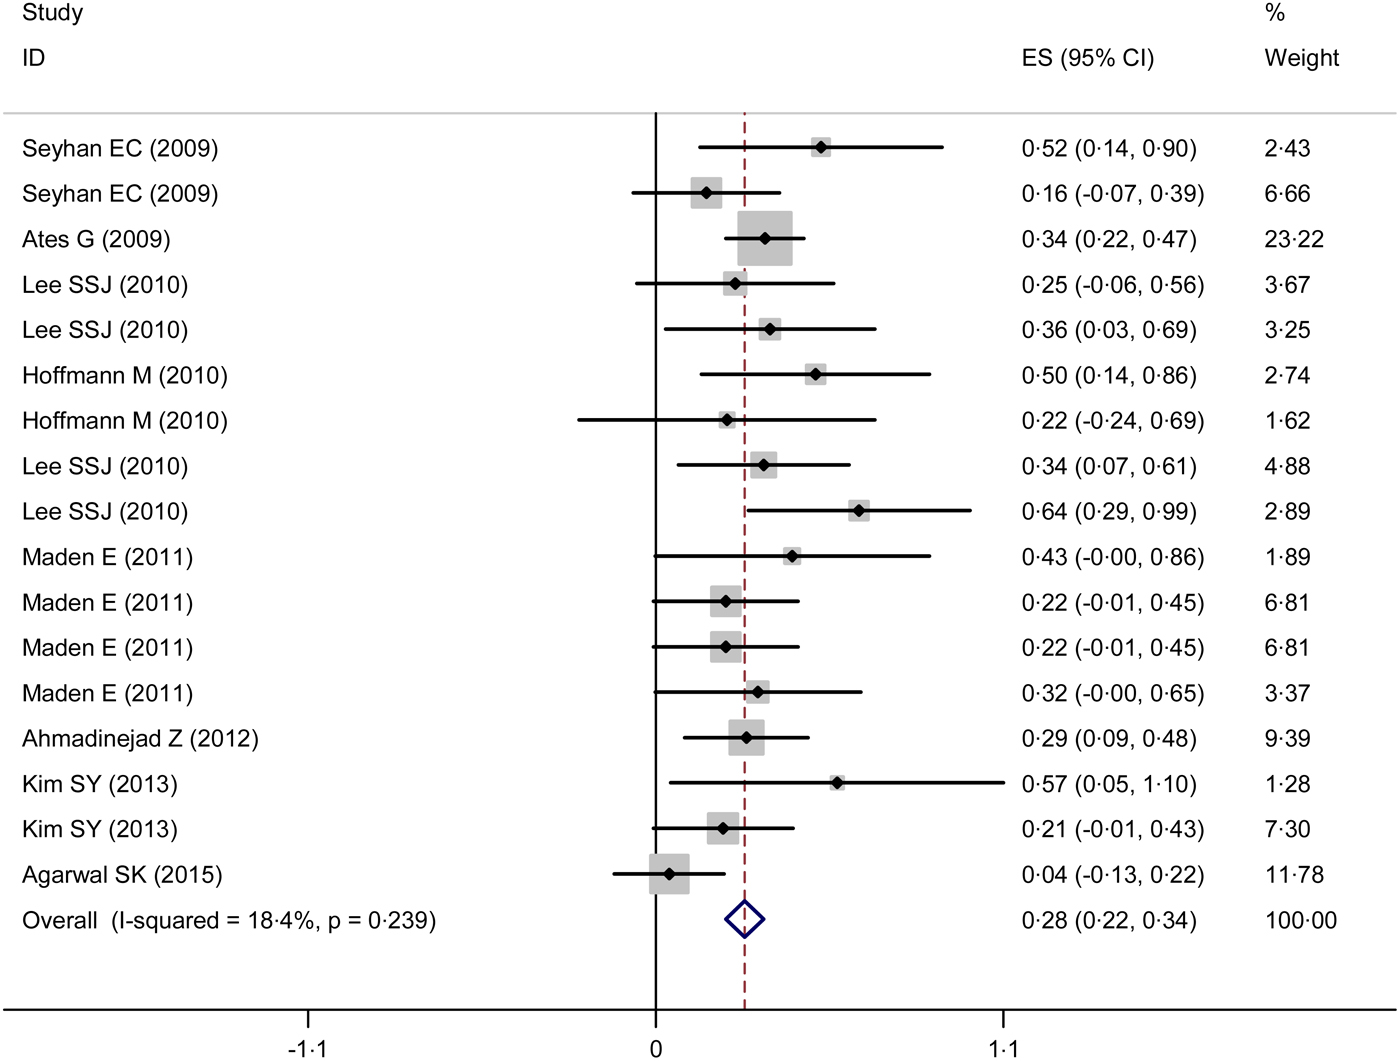
No significant heterogeneity was found among eight studies [Reference Kim3, Reference Seyhan11, Reference Agarwal14–Reference Hoffmann17, Reference Lee19, Reference Maden20] (I 2 = 18·4%, P = 0·239), so the fixed-effects model was used. The pooled κ coefficient (95% CI) between TST and QFT-GIT was 0·28 (0·22–0·34) (Fig. 3).

Fig. 3. Forest plot of κ estimate across the studies.
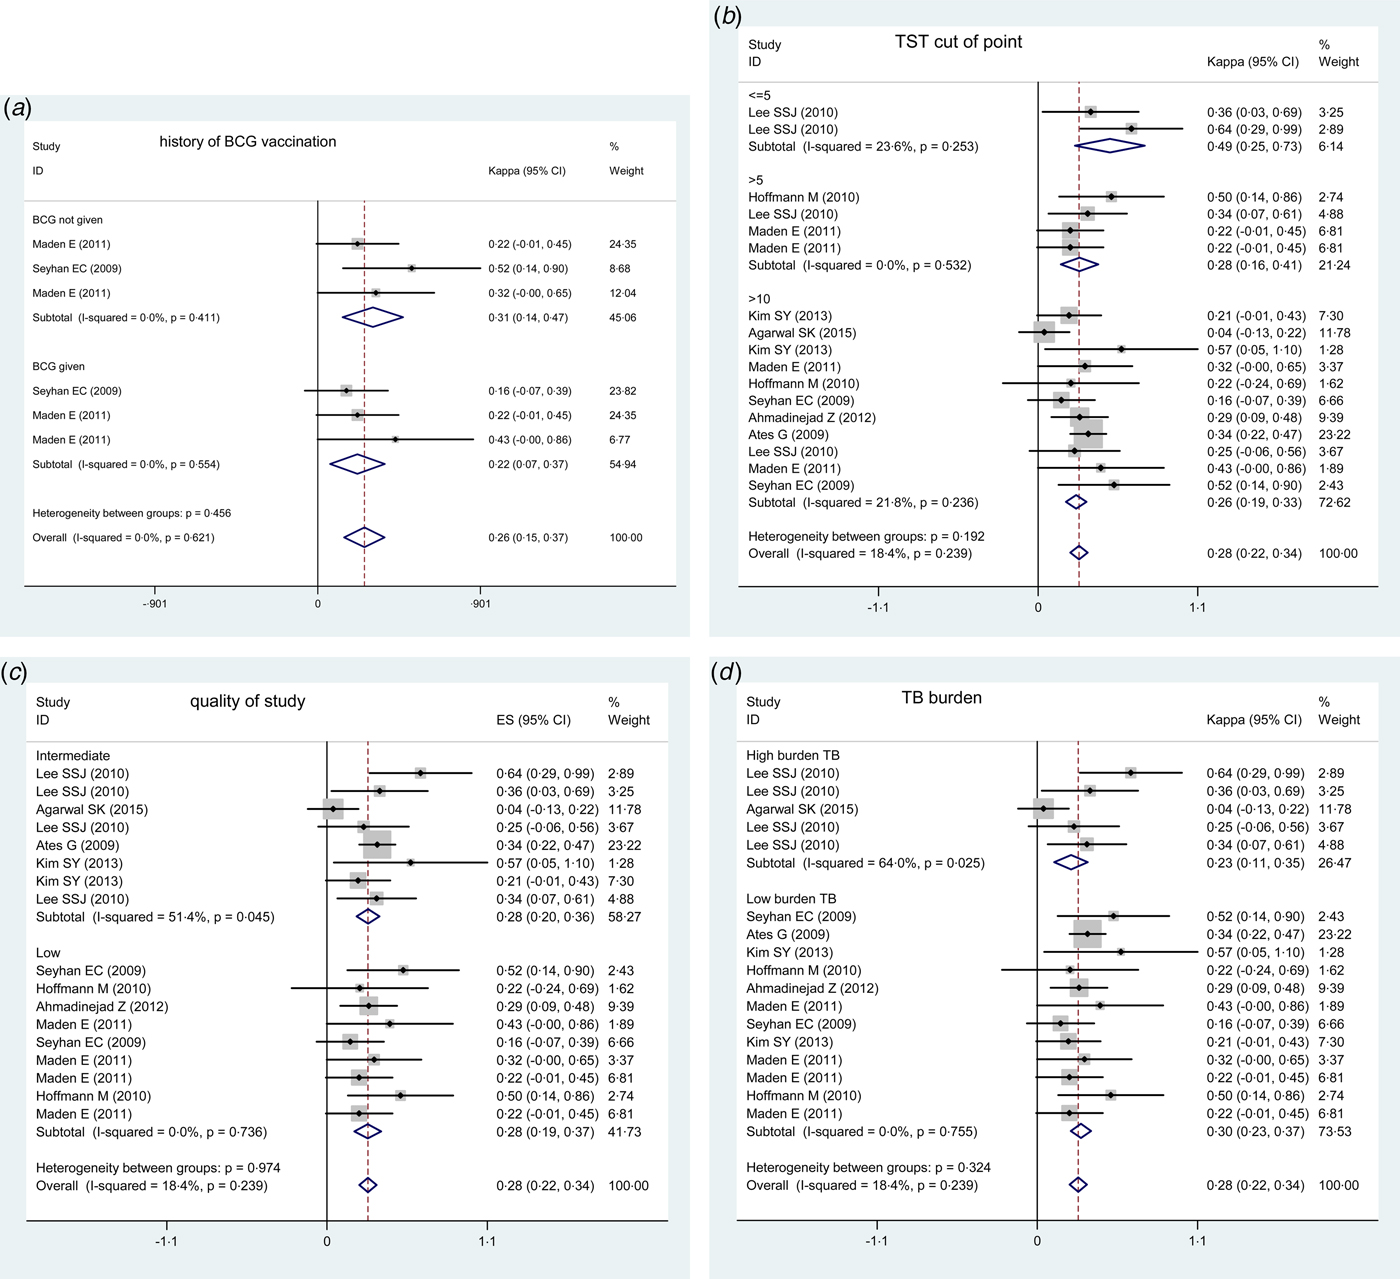
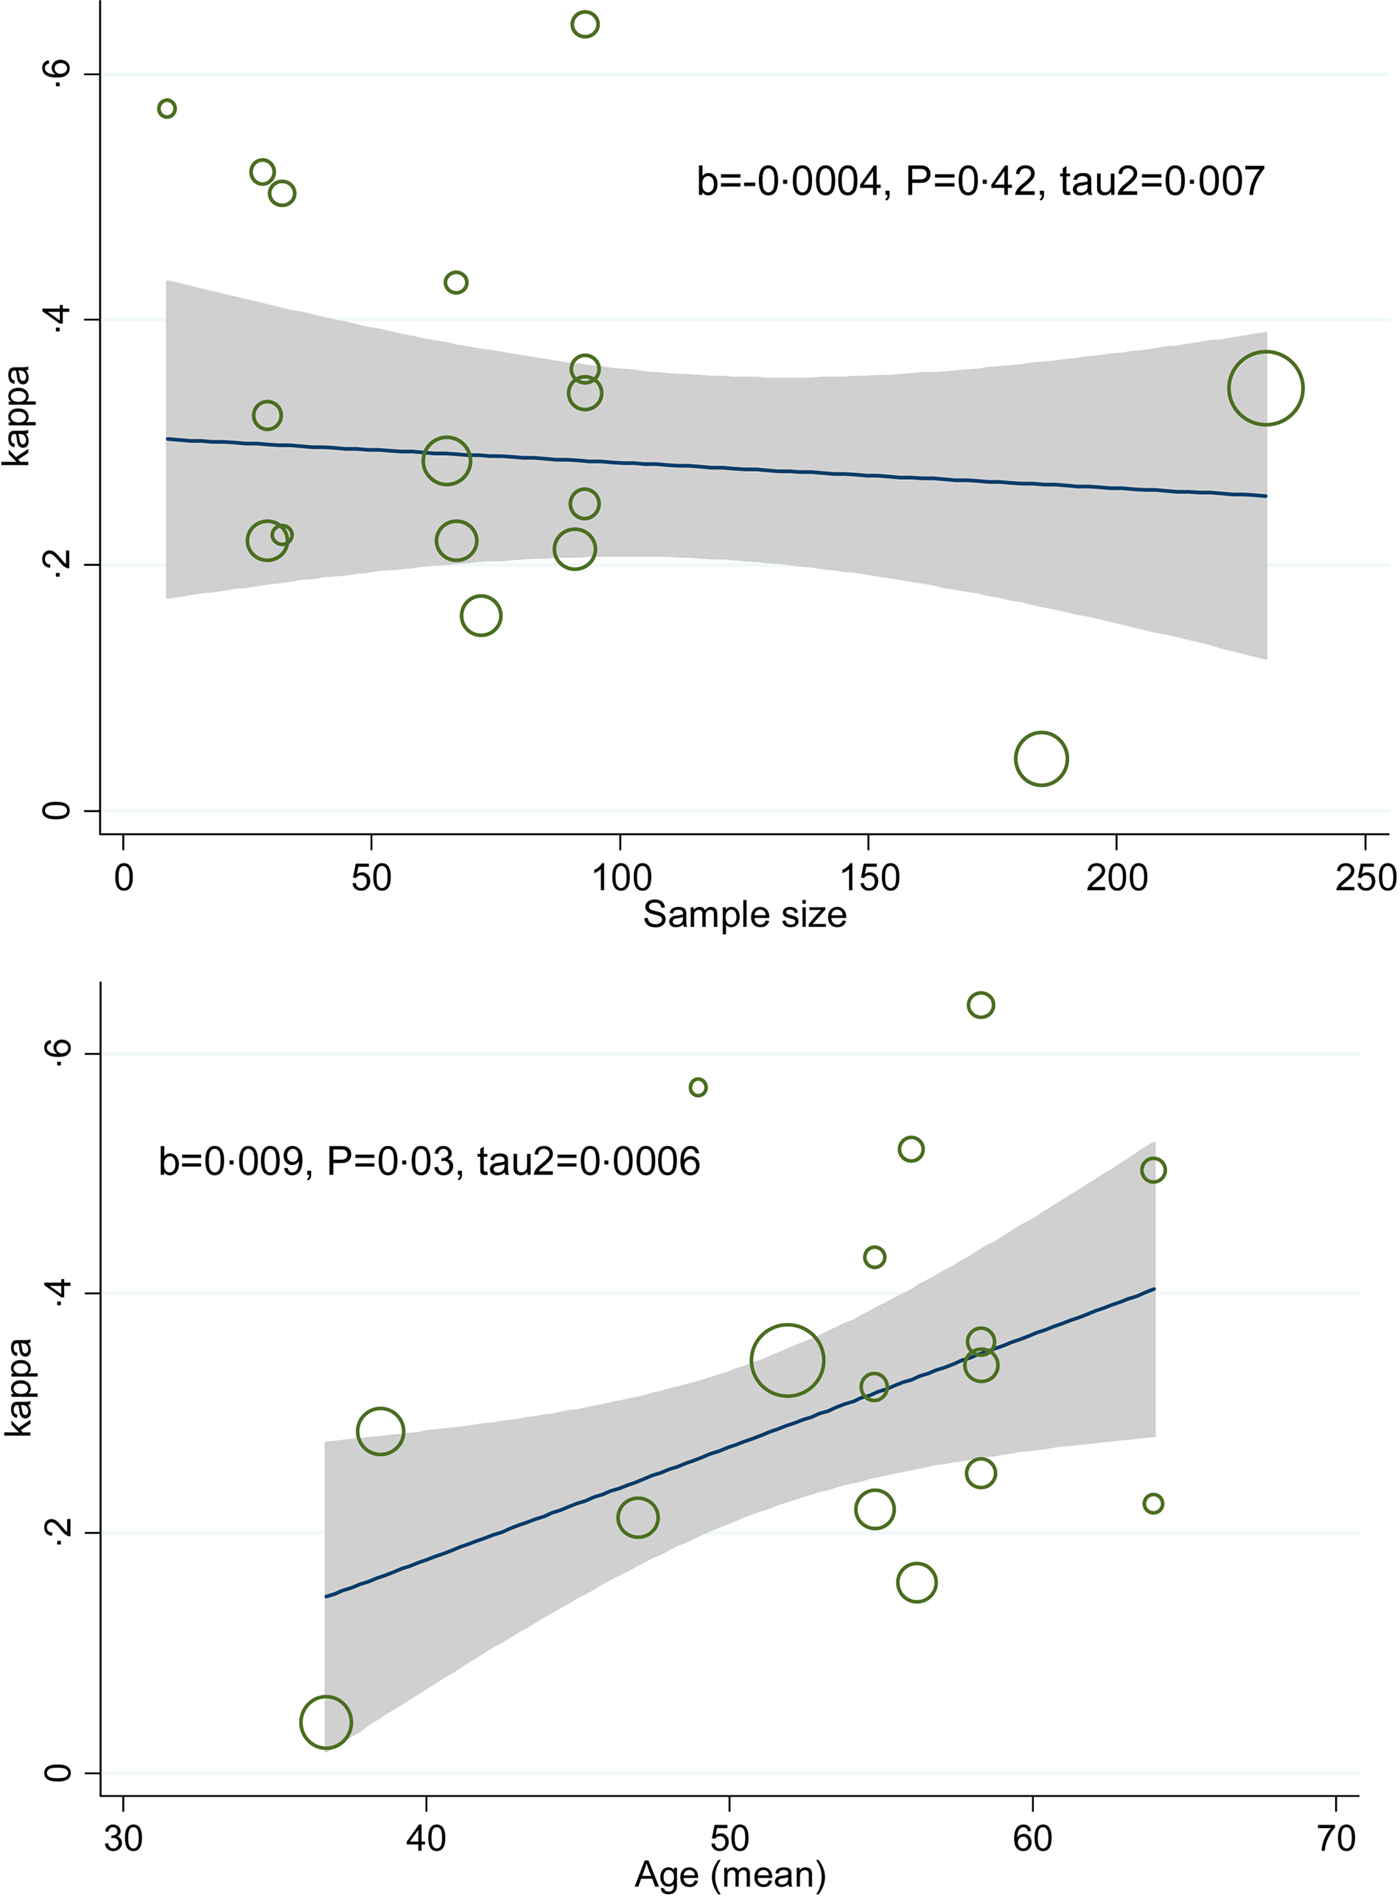
Subgroup analysis by BCG vaccination showed that κ coefficient (95% CI) for people with and without history of BCG vaccination were 0·22 (0·07–0·37) and 0·31 (0·14–0·47), respectively. The κ estimate for QFT-GIT and TST (⩽5 mm), QFT-GIT and TST (>5 mm) and QFT-GIT and TST (>10 mm) were 0·49 (0·25–0·73), 0·28 (0·22–0·34) and 0·26 (0·19–0·33), respectively. The κ estimate for low quality and intermediate quality were 0·28 (0·10–0·37) and 0·28 (0·20–0·36), respectively. Stratified analysis by TB burden country showed that κ estimate (95%) equal to 0·23 (0·11–0·34) for high TB burden countries and 0·29 (0·22–0·36) for low TB burden countries (Fig. 4a–d). Meta-regression plot showed that there was no difference in κ estimate across different sample size and higher κ estimate occurred at older ages (Fig. 5a and b).

Fig. 4. Subgroup analysis of κ estimate according to (a) history of BCG vaccination, (b) TST cut-off point, (c) quality of study and (d) TB burden.

Fig. 5. Meta-regression plot of variation κ by sample size and age.
DISCUSSION
Several meta-analyses have been reported pooled estimates for clinical agreement between IGRA and TST but not among HD patients. Our results showed only limited agreement between TST and QFT-GIT for the detection of LTBI in HD patients. Quality of studies had no significant effect on the results, though we identified no high-quality studies. Clinical agreement between the tests among BCG-vaccinated patients had lower point estimates, and although confidence bounds overlapped substantially. Low cut-off point of induration size in TST was associated with higher agreement. After summation of test results of the included study, it found that discordance of TST−/QFT-GIT+ was more than TST+/QFT-GIT−.
Relevant meta-analysis in HD patients was conducted by Ferguson et al. to evaluate diagnostic accuracy of tests for LTBI in HD patients [Reference Ferguson21]. The TST had a pooled sensitivity of 31% and specificity of 63%. In addition, the pooled sensitivity and specificity of QFT-GIT test were 53% and 69%, respectively. Their results display that QFT-GIT test was more sensitive than TST, but did not estimate amount of agreement between two tests.
We identified four previously reported meta-analyses comparing QFT-GIT and TST using κ statistics. One focused on children [Reference Machingaidze22], but did not provide pooled κ estimates, and showed a variable range of reported agreement ( κ 0·17–0·86). The second studied agreement among high-risk contacts and reported fair-to-moderate agreement for κ and prevalence-adjusted bias-adjusted κ (PABAK), respectively [Reference Ayubi23]. They indicated that highest agreement is associated with TST cut-off point ⩾15, which is inconsistent with our results. Third meta-analysis assessed LTBI screening in immigrants to low-incidence countries [Reference Campbell24]. Their results display a moderate concordance between TST and IGRA (κ 0·45 (0·38–0·52)). Another meta-analysis pooled κ estimate in health care workers by Doosti-Irani et al. [Reference Doosti-Irani, Ayubi and Mostafavi25]. They found that agreement between the two tests estimated to be fair among health care workers, in addition, they found that κ estimate for the TST cut-off point of ⩾15 mm was more than other TST cut-off points. Among health care workers, BCG vaccinated individuals showed lower agreement between the two tests for diagnosis of LTBI [Reference Doosti-Irani, Ayubi and Mostafavi25].
Compared with TST, IGRAs have higher M. tuberculosis specificity, provide quick results and do not require subjective clinical measurement of induration size with the arising possibility of bias [Reference Mazurek26]. Although TST is cheaper and may be more cost-effective [27, Reference Chadban28]. Uraemic state, long-term dialysis associated malnutrition, hyperparathyroidism and vitamin D deficiency cause stimulatory malfunction in antigen-presenting cells and prolong inflammatory response of monocytes which weakens cellular immunity [Reference Chan29–Reference Tzanno-Martins32]. Impaired cellular immunity may explain anergy and high rate of false-negative results of TST (lower sensitivity) in HD patients. Additionally, high risk of LTBI, particularly after kidney transplantation, confirms that a lower sensitivity may result in substantial clinical consequences [Reference Chia33]. A recent study of HD patients showed that QFT-GIT is the most cost-effective with compared with TST and chest X-ray (CXR) because of higher level of willingness-to-pay. Among HD patients, TST and CXR are more cost-effective only when the rate of BCG vaccination is 0·18 or lower [Reference Kowada34].
Our study has limitations. We did not construct pooled PABAK values because the lack of information on TST−/QFT-GIT−, TST−/QFT-GIT+, TST+/QFT-GIT−, TST+/QFT-GIT+ meant we were unable to derive that statistic. However, prevalence of disease and bias in measurements are known to have significant effect on κ estimate [Reference Sim and Wright35] as has been demonstrated in two previous meta-analyses [Reference Ayubi23, Reference Doosti-Irani, Ayubi and Mostafavi25]. We pooled κ estimates from countries with both high and low incidence of TB. Agreement between two tests may possibly be higher in very high or very low incidence countries. In addition, there was no high-quality study in our meta-analysis and half of included studies had low quality.
In conclusion, we detected limited agreement between TST and QFT-GIT for diagnosis of LTBI in HD patients. The agreement is lower still in BCG-vaccinated patients. According to the higher discordance of TST−/QFT-GIT+ in compared with TST+/QFT-GIT−, it seems QFT-GIT is superior to TST for detecting LTBI in HD patients. Our findings suggest that TST and QFT-GIT are not interchangeable in HD patients and that QFT-GIT may be diagnostically superior for this vulnerable group of patients.
SUPPLEMENTARY MATERIAL
The supplementary material for this article can be found at https://doi.org/10.1017/S0950268817000334
ACKNOWLEDGEMENTS
The authors would like to thank statistics consultants of Research Development Center of Sina Hospital for their technical assistance.
DECLARATION OF INTERESTS
None.