


Introduction
Reducing human immunodeficiency virus type 1 (HIV-1) transmission and increasing patients’ life expectancy still remain a public health priority and a major challenge [Reference Curtis1]. Several strategies have shown to be able to block HIV-1 transmission. However, the implementation of these strategies has only provided a limited reduction of the HIV-1 incidence. Aiming to reach this goal, the proper monitoring of the changing patterns of HIV transmission under prophylactic and therapeutic interventions is of utmost importance. Accurate distinguishing of recent from chronic infections allows for precise estimates of the disease's incidence rate. It is also crucial to evaluate the efficacy of HIV intervention and prevention measures and serves as an objective reference for allocating HIV-related health care resources [Reference Park2]. It is well known that HIV antigenemia occurs during the initial stages of infection and antigen detection assays are a useful public health index. Nevertheless, that does not reflect the rate of current HIV transmission, as antigenemia can happen late in the course of infection, i.e., as progression to AIDS occurs [Reference Press3]. In this regard, laboratory tests capable of detecting recently-acquired HIV-1 infection and also distinguishing it from the long-standing infections have been extensively developed. Despite that, a reliable method to estimate HIV-1 incidence remains as an immediate need in the community [Reference Busch4].
The current gold standard approach to identify recent infections involves the longitudinal follow-up and repeated testing of uninfected individuals [Reference Moyo5]. However, several difficulties such as the logistical challenges of following a cohort of individuals at risk for acquiring HIV infection and the need for testing a large number of HIV negative individuals, lead to inaccuracy of modelled-based estimates. These practices are also time-consuming and resource intensive, therefore representing important bottlenecks for broader routine HIV-1 screening. Recent efforts around incidence estimation have focused on the detection of recent seroconversions among HIV-1 antibody positive individuals. The incidence estimate is based on the maturation of evolving antibodies that usually follows a predictable pattern [Reference Duong6], antibody titres and antibody avidity [Reference Parekh7]. It relies on the assumption that the HIV-1-specific antibody response evolves following exposure to the virus towards a progressive increase in concentration and affinity [Reference Duong6–Reference Kassanjee9]. An individual is then classified as recently infected (i.e., infected within a defined mean duration of recent infection (MDRI)) if the biomarker value is below the predetermined assay threshold. Although these methods based on biomarkers of recent infections are extensively used to determine the incidence, their recent performance assessment [Reference Kassanjee9] revealed the need for optimisation in order to reduce the tendency to produce substantial false-recent rates (FRR). The main causes are susceptibility to variation in immune responses that are associated with different HIV subtypes, viral load levels and antiretroviral therapy (ART), which can then result in overestimated HIV-1 incidence [Reference Moyo5]. These confounding variables may contribute to inaccurate incidence estimates and therefore have profound consequences for evaluating the impact of HIV prevention or surveillance program measures [Reference Curtis1].
Due to the challenges associated with the current tests for recent HIV infection, there is an urgent need to improve the performance of current assays or to identify new biomarkers that can reliably distinguish recent from long-standing infections, thereby yielding low FRRs and acceptable MDRIs [10]. In this scenario, differences in the kinetics of HIV-1-specific IgG subclass antibody responses during infection have been addressed as a potential strategy to estimate the relative timing of HIV seroconversion with less variation and misclassification. A customised multiplex assay directed against different HIV-1 antigens described a decline in HIV-1-specific IgG3 antibody responses during recent infection, contrasting with the stably elevated levels of HIV-1-specific IgG1 throughout the disease progression [Reference Yates11]. The shorter duration of antigen-specific IgG3 may reflect inherent differences in the subclass recycling and durability [Reference Stapleton12] or on the dependency of an effective T-helper-cell response [Reference Khalife13, Reference Binley14]. On that account, estimates of peak IgG3 antibody concentrations and the half-life of these antibodies during recent HIV-1 infection may be applied as part of an algorithm to substitute or complement the methods now in use to define recent infection and estimate HIV-1 incidence [Reference Yates11].
This report describes, for the first time, the performance characteristics of an affordable, simple and versatile enzyme-linked immunosorbent assay (ELISA) to measure the titre of anti-p24 HIV-1 IgG3 antibodies in a retrospective cohort of HIV-1 infected individuals whose sera samples comprised post-seroconversion times ranging from 1 to 24 months. It is based on a developed protocol for a designed recombinant p24 antigen that was able to quantitatively detect HIV-1-specific total IgG and IgG3 antibodies responses at the analysed post-seroconversion window times. Assay refinement is also described, including estimation of cut-off values and corresponding MDRI and FRR. Our results show that the combination of the assays to measure total IgG and IgG3 antibody titres against HIV-1 p24 could be applied for proper assessment of cohort patients’ status and for sample classification in research settings. Given the public health importance of accurately estimating HIV-1 incidence, the importance of the method described here is strengthened by its capacity to detect recent infection and discriminate recent from late infection using a single antigen.
Methods
A schematic representation of the methodology is presented in Fig. S1.
HIV-1 p24 DNA sequence selection, optimization and cloning
99 amino acid sequences from American viral isolates encoding the HIV-1 capsid (p24) protein were downloaded from the National Center for Biotechnology Information – NCBI (https://www.hiv.lanl.gov/components/sequence/HIV/search/search.html) (Table S1). The sequences were aligned using the Basic Local Alignment Search Tool version 2.2.32 provided by NCBI [Reference Altschul15, Reference Altschul16] to generate the consensus sequence. A reverse search was then carried out to identify the primary viral isolate with the closest sequence match to the consensus sequence (access number: ACA49289.1). The selected DNA sequence encoding the full-length p24 protein is composed of 228 amino acid residues and was flanked by two multiple cloning sites (5′ Hind III, Xho I, Nde I, Spe I and 3′ Sap I, Not I, Nco I). The corresponding DNA sequence was optimised for codon usage, reduced messenger RNA secondary structures, distribution of GC content and removal of repetitive sequences and motifs aiming enhanced mRNA transcription, stability and translation in prokaryotic system using the software LETO 1.0 (Entelechon®). The artificially optimised gene (access number: MG201975) was further synthesised by a commercial supplier (GeneScript®) and cloned into the expression vector pRSETA (Invitrogen®).
Recombinant protein production
Bacterial expression of the recombinant capsid p24 protein was carried out in Escherichia coli BL21 Star™ (DE3) pLysS (Invitrogen®) strain transformed with the expression vector. A transformant colony harbouring the expression plasmid was grown in Luria-Bertani medium supplemented with 100 µg/ml of ampicillin to an OD600nm of 0.5 (ca. 2 × 10⁸ cells/ml) and protein expression was induced with 1 mM Isopropyl β-D-1-thiogalactopiranoside (IPTG) at 37 °C for 4 h. The bacterial pellet was harvested by centrifugation at 5000 g/4 °C/20 min and resuspended in lysis buffer (50 mM Tris-HCl pH 8.0, 300 mM NaCl, 20 mM Imidazole) supplemented with 1X protease inhibitor cocktail (Roche). Bacterial lysis was performed by sonication at 4 °C in a Vibracell VCX 750 Sonicator (amplitude setting of 40%) by 6 pulses of 30 s each with 60 s interval between the pulses. The lysate was clarified by centrifugation at 8000 g/4 °C/30 min and the recombinant protein was purified through affinity chromatography with a nickel matrix column (Ni-NTA – QIAGEN). Protein concentration was determined by spectrophotometry.
Human serum samples
Cryopreserved serum obtained from 45 HIV-1 positive participants and 235 HIV-1 negative participants were provided by the Brazilian National Panel for Blood Screening Quality Control. All sera were tested by the Technology Institute for Immunobiologicals (Bio-Manguinhos/Oswaldo Cruz Foundation-FIOCRUZ, Brazil) and the National Institute for Health Quality Control of the Oswaldo Cruz Foundation. Cryopreserved serum was also obtained from 48 HIV-1 positive participants whom plasma HIV RNA levels varied from 55 to 290 000 copies/ml and 48 HIV-1 negative participants and provided by the Multicenter AIDS Cohort Study (MACS). The seroconversion panel was composed of sera samples from 11 participants who had seroconverted based on HIV antibody screening and obtained from the Consortium for the Evaluation and Performance of HIV Incidence Assays (CEPHIA). The samples included date back several weeks before antibody seroconversion and continued up to 6 months after the detection of HIV antibodies. CEPHIA has also provided 150 serial serum samples from 30 HIV-1 positive participants obtained from 1 month up to 24 months post-seroconversion. All HIV-1 reactive samples used in this study were obtained from individuals infected with clade B virus and who were not under ART and who had not progressed to AIDS. All serum samples were aliquoted, heat inactivated (56 °C for 40 min), allowed to cool to room temperature and then stored at −80 °C until use.
Liquid microarray (LMA) assay
For the covalent coupling of the chimerical protein to microspheres, paramagnetic carboxylated microspheres (Luminex Corp, Austin, USA) were coated with the purified proteins at 50 µg/ml through a two-step carbodiimide coupling, according to the manufacturer's instructions. The protein-coated microspheres concentration was determined using the Multisizer™ 3 Coulter Counter (Beckman Coulter) and the microspheres were stored at 4 °C in the dark until use. LMA standard protocol. Immunoreactions were performed in low binding 96-well plates (SARSTEDT) and all incubations were performed at 37 °C on a microplate shaker (set at 300 RPM) and protected from light. A blocking step using E. coli lysate was performed as previously described [Reference Crestani17]. For the wash steps, a Hydroflex plate washer with a magnetic support (TECAN, Durban, NC, USA) was used. Sera samples were diluted 1:200 in 1X PBS containing 1% BSA, 0.05% Tween-20 and the assays were conducted using standard procedures described by the manufacturer (Luminex Corp, Austin-TX, USA). Two thousand and five hundreds antigen-coated microspheres (in a final volume of 50 µl) were added to each well of a 96-well plate and incubated with 50 µl of each serum for 30 min. Following two washes in 100 µl of assay buffer (1X PBS containing 1% BSA, 0.05% Tween-20, 100 mM Tris), the microspheres were incubated with goat anti-human IgG conjugated to phycoerythrin (MOSS Substrates) diluted 1:1000 (0.66 µg/ml) in assay buffer for 30 min. The microspheres were washed twice and re-suspended in 100 µl of assay buffer before fluorescence measurement. The reporter fluorescence, expressed as median fluorescence intensity (MFI), was determined with a Luminex 200 instrument using xPonent 4.1 software, acquiring 100 independent events per well.
LMA data analysis
The diagnostic performance evaluation of the recombinant antigen was performed using the receiver-operating characteristics curve (ROC) analysis [Reference Hanley and McNeil18, Reference Zweig and Campbell19] built in the Prism 6 for Mac OS X (version 6.0d; GraphPad Software Inc.). The determined area under the curve (AUC), sensibility and specificity values for the immunological assay were used as a standard metric. Additionally, two-tailed unpaired t-tests and one-way analysis of variance (ANOVA) were used to compare the MFI values obtained for the p24 protein against the HIV-1 panels. Pearson's correlation was used to assess the co-variation among the groups analysed in the ELISA assays. Differences were considered statistically significant when P < 0.05. All statistical tests were conducted at the 95% confidence interval. False positive rate = FP/(FP + TN).
ELISA for detection of p24-specific total IgG and IgG3
High binding, half area 96-well polystyrene plates (Costar; Lowell, MA, USA) were coated overnight at 4 °C with 1 µg/ml (for anti-p24 total IgG detection) or 2.3 µg/ml (for anti-p24 IgG3 detection) of p24 recombinant protein diluted in 0.2 M carbonate/bicarbonate buffer (Pierce, IL, USA). Plates were blocked with skimmed milk (Bio-Rad) at 5% (w/v) in PBS-T buffer [1X PBS with 0.05% (v/v) Tween 20] for 15 min at room temperature. Serum samples were diluted in assay buffer [5% (w/v) skimmed milk in PBS-T] and added to plates. All samples were incubated for 2 h at room temperature. Plates were washed five times with PBS-T, followed by incubation with the horseradish peroxidase (HRP)-linked antibody against total IgG or IgG3 diluted in assay buffer. Plates were incubated for 1 h at room temperature, washed four times with PBS-T and allowed to soak in the same buffer for 5 min at room temperature. An incubation of tetramethylbenzidine TMB-KPL substrate (Pierce, IL, USA) for 30 min at room temperature, followed by 1N HCl was used for the colorimetric detection of titres endpoint. Optical densities at a wavelength of 450 nm (OD450nm) were read using a microplate spectrophotometer (BioTek; Winooski, VT, USA). Standard curves were generated using pools of HIV-1 positive individuals diluted over the range 1:5000–1:5120000 (for p24-specific total IgG detection) or 1:25–1: 25 600 (for p24-specific IgG3 detection). All samples were tested in duplicate and the intra-assay variability was below 20% (a variation of up to 25% at the lower limit of quantification (bottom) is recommended as default acceptance criteria for accuracy and inter-batch precision [Reference DeSilva20]. Four-parameter variable slope non-linear regression was calculated using log-transformed optical density values on Prism 6 for Mac OS X. The curves were run on each plate and used to determine the reproducibility of the assay.
For the IgG3 assay, the precision of the assay was also evaluated by running in each plate assay, three points of the standard curve in duplicate each: the OD450nm at the lower limit of detection (LLD), the approximate midrange of the calibration curve and the upper limit of the curve (ULC). To be accepted as the lowest and the highest values of OD450nm on the standard curve, LLD and ULC need to meet the following criteria: (1) the OD450nm is at least 5 times higher than the OD450nm of the background (HIV-1 negative sera); (2) the response should be reproducible with a mean coefficient of variation (CV) of < 10%. The CV is defined as the ratio of the standard deviation to the mean [(s.d./mean)×100]. The ULC is selected as the highest plateau of the calibration curve and is evaluated using the same protocol as for LLD. The analysis of intra- and inter-assay precision was carried out 6 times on separate occasions, with the acceptance criteria being a mean CV of <0%.
Results
Immunoreactivity analysis of the recombinant p24 protein by singleplex LMA assay
The strategy for developing a recent infection assay for HIV-1 that allows the quantification of total IgG and IgG3 antibody titres directed against HIV-1 p24 protein is based on the design of an antigen capable of mimicking the structural content and reactivity of the native protein. The DNA sequence coding for the HIV-1 p24 protein was optimised for enhanced bacterial expression, produced as a N-terminally 6x His-tagged protein and purified under non-denaturing conditions by affinity chromatography. SDS-PAGE and western-blot analysis showed that the recombinant p24 protein is purified as a single protein of 24 kDa and no aggregates are present in the purified sample (Fig. S2). The experimental Far-UV circular dichroism (CD) spectrum for the p24 protein was acquired from 200 to 260 nm and the stability of the p24 protein was confirmed by monitoring the heat-induced unfolding curve (Fig. S3).
The immunoreactivity and specificity of the recombinant p24 protein were firstly assessed against 45 HIV-1 positive and 317 HIV-1 negative human serum samples (the latter including negative samples from healthy individuals (n = 82), positive samples for Hepatitis B (n = 79), Hepatitis C (n = 40), Chagas Disease (n = 38), HTLV-1/2 (n = 48) and Syphilis (n = 30)) in a singleplex LMA (Fig. 1a). The results revealed that the p24 protein is strongly reactive against total IgG antibodies present in the HIV-1 positive samples group and exhibited a false-positive rate of 4.02%, hence assuring that cross-reactivity was not significant. These data were also used to determine the diagnostic performance of the p24 protein through receiver operating characteristics (ROC) analysis (Fig. 1b). The AUC for the p24 protein was 0.9984, while sensibility and specificity values corresponded to 100% and 95.98%, respectively.

Fig. 1. Immunoreactivity and diagnostic performance assessment of the designed HIV-1 p24 protein. (a) – Median fluorescence intensity (MFI) for the p24 protein against HIV-1 positive and negative (control) human serum samples and against Hepatitis B and C, Chagas Disease, Syphilis and HTLV-1/2 positive serum samples. The results are presented as the median values over a 100 events for individual samples (dots) along with the corresponding standard deviation (P < 0.001). Mean values and correspondent standard deviations are shown. The P-values of two-tailed t-test and one-way ANOVA are indicated above each analysis. (b) – ROC curve analysis of the HIV-1 p24 protein. The paired results for sensitivity and specificity were plotted as points in a ROC space and the trade-off between these measures for different discrimination cut-offs are graphically represented.
Development of an ELISA assay to detect and titrate HIV-1 p24-specific total IgG antibodies in patient serum samples
Aiming to establish a tool to allow simple measurements of incidence estimation and samples cohort classification, IgG titre profiles were monitored against p24 protein as recent infection markers for HIV-1 infection. A developed ELISA was used to detect and quantify p24-specific total IgG antibodies in clinical serum samples. The reliability and reproducibility of this assay were evaluated by using a pool of 30 HIV-1 positive serum samples from the MACS (Fig. S4a). Using a panel of 48 serum samples from chronically infected HIV-1 participants and 48 serum samples from healthy participants (enrolled in the MACS), our p24-based total IgG detection assay allowed a clear distinction between the two sample sets (Fig. 2a). The developed assay was subsequently tested against 22 paired serum samples from 11 HIV-1 participants enrolled in the Consortium for the Evaluation and Performance of HIV Incidence Assays (CEPHIA). The paired samples comprised the last negative sample before seroconversion and a positive sample collected at least 6 months (and up to 12 months) after seroconversion. Our results revealed that the developed assay detected anti-p24 IgG specifically after seroconversion, revealing titres ranging from 774 to 5626 in samples from long-standing HIV-1 infection (Fig. 2b).
Fig. 2. Detection and titration of p24-specific total IgG antibodies in clinical samples by ELISA assay. (a) – Scatter plot representation of p24-specific IgG antibodies detection in serum samples from 48 healthy participants and 48 HIV-1 chronically infected individuals. The results are shown as mean values over all measurements and corresponding standard error of the mean (s.e.m.). Dots represent individual measurements. A dashed line indicates the cut-off value and the P-value of two-tailed t-test is indicated above. (b) – Titration of p24-specific total IgG antibodies in paired samples from 11 HIV-1 positive individuals comprising the last negative sample and first positive sample within 6–12 months after seroconversion. Each sample was tested in duplicate and the mean values are shown. Dotted lines connect paired samples and the P-value of two-tailed t test is indicated above the graph.
Kinetics of p24-specific total IgG and IgG3 antibodies in sequential samples and assessment of recent infection test parameters
To determine the kinetics of p24-specific IgG3 antibodies appearance early after seroconversion, a second assay to detect and titrate HIV-1 p24-specific IgG3 antibodies in human serum samples was developed (calibration curves assays are shown in the Fig. S4b). The response curves for p24-specific total IgG and IgG3 antibodies in prospective sequential sera samples from 30 seroconverted participants enrolled in the CEPHIA cohort were compared (Fig. 3). Serum samples were collected over the period of 1–24 months post-seroconversion and distributed in five groups (1–4, 5–8, 9–12, 13–18 and 19–24 months). According to our results, the total IgG antibody titres are overall sustained at high levels throughout the observed time (ranging from 314 up to 889 000) (Fig. 3a). Compiled kinetics data from all 30 seroconverters show that the majority of individuals presents an increase in p24-specific total IgG levels over time; however, there is considerable heterogeneity among individual responses, including some that ramp up slowly or even decline slightly over time (Fig. 3b). These data indicate that p24-specific total IgG response does not show correlation with progression throughout the early stages after seroconversion, hence not allowing inference on time after patient seroconversion. In contrast, the IgG3 titre profile against p24 exhibited a transient reactivity peak observed within the first 4 months post-seroconversion, with titres ranging from 83 to 2527, which then declined (Fig. 3c). This finding is being reported for the first time and indicates that the p24-specific IgG3 response may be used to differentiate recent from long-standing HIV-1 infections. The selected cut-off value (titre: 190) is displayed in the graph as a dotted black line and it was chosen based on the bottom end of the 95% confidence interval for the reactivity of the first group measurement (recent samples, 1–4 months after seroconversion). Therefore, recent infection is defined as any value above the defined cut-off value.
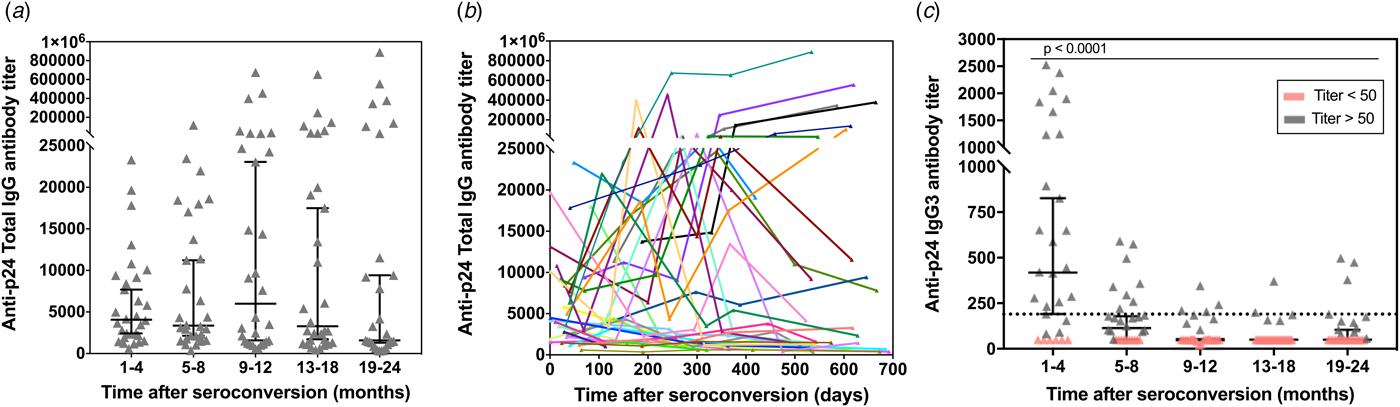
Fig. 3. p24-specific total IgG and IgG3 antibody titres as measured by our ELISA assay in 150 sequential serum samples from 30 HIV-1 positive and recently seroconverted individuals. The total IgG (a) and IgG3 (c) response towards p24 was determined by ELISA in 150 serum samples from 30 HIV-1 positive individuals who recently seroconverted. The samples were divided into five groups based on the time post-eroconversion and over a total period of 24 months. The antibody titres are plotted vs. the intervals after seroconversion in months. Individual measurements are shown (grey symbols) along with the median (black lines) and correspondent 95% confidence interval. The black dotted line in (c) represents the cut-off value (titre: 190) selected based on the final end of the 95% confidence interval of the mean of first time-point. (b) – Titration of p24-specific total IgG antibodies in relation to days since seroconversion. Each line represents a single individual with sequential specimens collected over time.
Assuming uniformly distributed seroconversion events over the time intervals [0, 730 days], the MDRI was estimated from the proportion of all seroconverters testing recent according to the defined titre cut-off. Figure 4a shows the development of p24-specific IgG3 antibody response for each subject as a function of days after-seroconversion. According to the results, the value for MDRI on the developed assay is 144 days (95% CI 132–156). In addition, among the 119 specimens from HIV-1-infected individuals that were known to have seroconverted for >4 months, only 17 specimens were classified as recent on the assay, resulting in a false-recent rate (FRR) of 14.2% for the developed test. The empirical frequency of individuals correctly classified as recent (in the 1–4 months group) and non-recent (in the 5–8, 9–12, 13–18 and 19–24 months groups) is also shown in Figure 4b as a confidence measure of the developed recent infection assay.
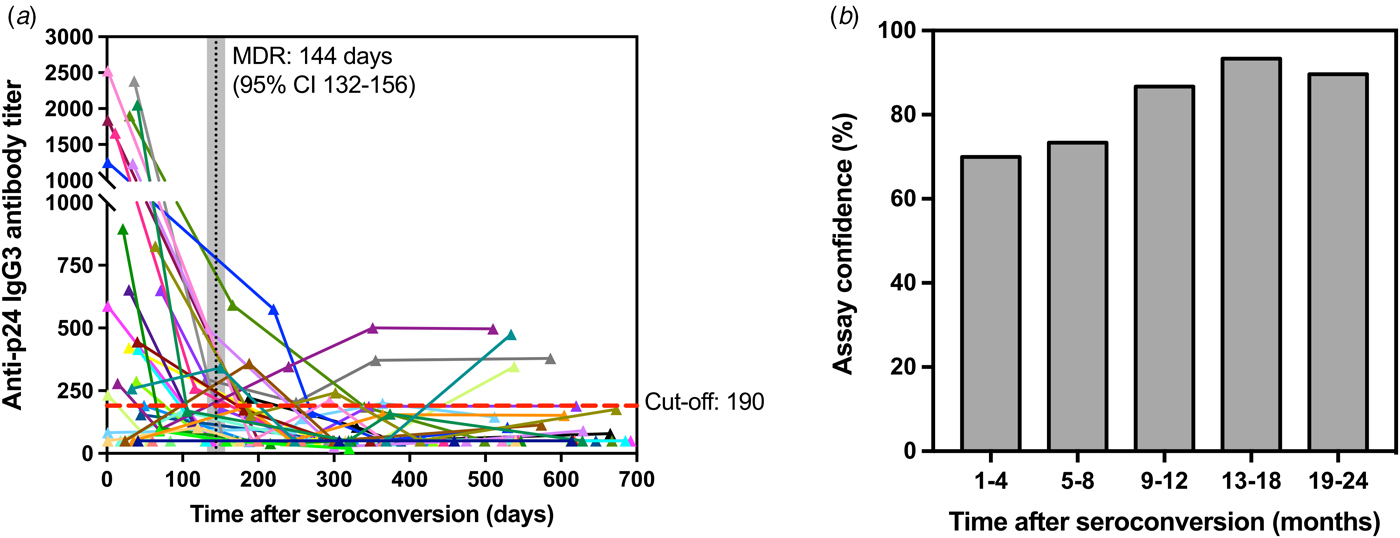
Fig. 4. Kinetics of p24-specific IgG3 antibodies as measured by our ELISA assay in 150 sequential serum samples from 30 HIV-1 positive and recently seroconverted individuals in relation to time since seroconversion (days). (a) – Each line represents a single individual with sequential specimens collected over time post-seroconversion (in days). Cut-off (titre = 190) is shown as a red dashed line, whereas the mean duration of recent infection (144 days) and corresponding confidence interval (95% CI 132-156) are shown as a vertical black line and shaded grey area, respectively. (b) – Confidence levels of the developed assay are shown as the frequency of individuals correctly classified as recent (1–4 months) and non-recent (5–24 months) according to the assay cut-off described in (a).
Discussion
Intensive efforts by HIV-control programs from many countries have made a significant impact on reducing transmission of HIV-1 infection [Reference Duong6]. This achievement is largely due to the development of laboratory-based incidence assays. Although some HIV-1 incidence assays are commercially available, the establishment of an easy-to-perform assay that is capable of accurately discriminate early from long-term HIV-1 infections in resources-constrained settings is still critically needed for both public health improvement and epidemiological surveillance. In the present work, a designed recombinant p24 protein was applied as an antigen to two different assay formats to detect p24-specific IgG responses: singleplex LMA and ELISA. We have also developed a simple and reproducible ELISA assay to assess the kinetics of p24-specific immunoglobulin 3 (IgG3) responses over the early stages after seroconversion with reduced inter-run variations. The data has shown that anti-p24 IgG3 antibody titres exhibit a unique early and transient peak after seroconversion. This distinct behaviour enabled the use of elevated anti-p24 IgG3 titres as an early infection marker capable of differentiating recent from long-standing HIV-1 infections. Therefore, the IgG3 capture ELISA assay was also used to establish the optimal cut-off threshold value for recent infection analyses.
In summary, the folding and conformational stability of a designed p24 recombinant protein was confirmed by CD spectroscopy (Fig. S1). The recombinant protein was used to develop a singleplex LMA to detect specific total IgG antibodies in serum samples from 45 HIV-1 chronically infected participants as a preliminary immunoreactivity evaluation method. The results showed that our p24-based antigen exhibits the high power of discrimination between positive and negative sample sets and exhibited 100% of sensibility and 98.95% of specificity (Fig. 1). In agreement with the LMA data, the developed p24-based ELISA assay allowed the detection of p24-specific total IgG antibodies in all serum samples from 48 HIV-1 chronically infected participants from the MACS cohort (Fig. 2a). The antibody titration assay, designed in the same ELISA format, showed the presence of p24-specific total IgG titres up to 55 000 in samples from 11 seroconverters (seroconversion time >6 months) (Fig. 2b).
In addition to p24-specific total IgG antibodies, the IgG subclasses responses triggered by this protein can mark the progression throughout the early infection phase, facilitating the identification of recent infections and stratification of participants in clinical cohorts. During the HIV-1 infection, the antibody response to Gag appears at an average time of 18 days after seroconversion, being primarily directed against p24 and p17 proteins and leading to the appearance of IgG antibodies of the IgG3 subclass, followed by IgG1, IgG2 and IgG4 [Reference Tomaras and Haynes21–Reference Ferrante, Beard and Feldman23]. Previous studies suggest that IgG subclass responses to HIV-1 Gag proteins may vary according to infection time and progression status [Reference Banerjee24, Reference McDougal25]. IgG3 is one of the second most predominant subclasses in the antibody response against HIV [Reference Tomaras and Haynes21, Reference Wilson22, Reference McDougal25] and, although anti-p24 IgG3 is known to appear within the first 6 months after seroconversion, the time point when the response reaches the maximum and then declines lacks to be defined. The development of a new recent infection assay described here was geared to address this limitation. Due to their early appearance in the context of the HIV-1 infection, IgG3 antibody titres directed against p24 were evaluated as an early infection marker in this study. Using our developed ELISA assay to titrate p24-specific total IgG antibodies as a platform, a modified version of this assay was set up to titrate p24-specific IgG3 antibodies in a cohort of sequential serum samples from untreated HIV-1 positive individuals collected over the period of 24 months after seroconversion (Figs 3 and 4). Monitoring of the calibration curves over 20 plates demonstrated that our assay is consistent and shows inter- and intra-assay variability <20% (Fig. S2), which meet the intra- and inter-assay precision determined by the FDA guidance acceptance criteria [26].
Our findings reveal that, while the p24-specific total IgG antibodies titres are maintained markedly high in untreated HIV-1 individuals, IgG3 antibody titres are found at high levels only during a limited early period after seroconversion (Figs 3 and 4), regardless of the presence of high plasma viral loads (above 10 000 copies/ml of blood) (data not shown for conciseness). After a single transient peak of IgG3 titres during the first 5 months after seroconversion, the response declines, probably reflecting the antibody deficient recycling, which leads to a shorter half-life [Reference Stapleton12, Reference Vidarsson, Dekkers and Rispens27] and a decrease in the IgG3 antibody levels. Although out of the scope of this paper, it is worth mentioning that IgG3 responses are predominantly linked to T-helper 1 (TH1) responses [Reference Snapper and Mond28, Reference Germann29] and the presence of IgG3 in the first 4–5 months after seroconversion may also be a marker of well-preserved Th1 response in the early stages of infection. It is also important mentioning that, although individuals with long-standing infections under ARR present a reestablishment of normal T-cell counts, those individuals did not present measurable levels of anti-p24 IgG3 antibodies in our assays (data not shown for conciseness). We have also demonstrated that titration of p24-specific IgG3 antibodies has a MDRI of 144 days (95% CI 132–156), which is between 4 and 5 months and sufficiently long to detect new infections for good incidence estimates (Fig. 4a). Our results are comparable with the results from Duong and colleagues [Reference Duong6], who have reported a Lag-Avidity EIA with a MDRI of 141 days (95% CI 119–160) with a low CV. On the other hand, among 119 individuals tested in this study with long-standing HIV-1 infections (seroconversion time >144 days), the misclassification rate (false-recent rate – FRR) was 14.2%, which is considerably higher than the LAg-Avidity EIA developed by Dung and colleagues (0.2%) and the BED assay (2.9%) [Reference Parekh7]. However, it is important to note that precision of seroconversion time and frequency of sample collection may affect FRR values. Therefore, testing of more seroconverters and additional longitudinal specimens representing different populations will be required to further refine our findings as part of future studies by our group.
In conclusion, in the current study, we have demonstrated the potential of a recombinant p24 protein-based ELISA assay for fast and reproducible titration of p24-specific IgG3 antibodies in human sera to accurately differentiate recent from long-standing infections. Our application in a longitudinal specimen set suggests that a decrease in IgG3 titre against p24 reflects entering in the non-recent phase of HIV-1 infection. This assay may be useful for better allocation of scarce resources as well as for research and public health applications, specifically for research cohort stratification purposes and similar studies (such as the design and efficacy evaluation of therapeutic and prophylactic vaccines).
Supplementary material
The supplementary material for this article can be found at https://doi.org/10.1017/S0950268818001218
Acknowledgements
The authors would like to thank the Multicenter AIDS Cohort Study team for its valuable cooperation with this project. Dr Seth Horn, Department of Chemistry, University of Pittsburgh, is acknowledged for providing access to the circular dichroism facility. This work was supported by the Coordination for the Improvement of Higher Education Personnel (I.F.T.V., Coordenação de Aperfeiçoamento de Pessoal de Nível Superior – CAPES, grant number 9848-12-6), Brazil; by the National Institutes of Health – NIH in a partnership with the Brazilian National Council for Scientific and Technological Development (I.F.T.V., E.T.A.M., Conselho Nacional de Desenvolvimento Científico e Tecnológico, grant number PA-14-328); by the NIH (C.R.R., R.B.M., grant number U01 AI035041, University of Pittsburgh Multicenter AIDS Cohort Study (MACS)); by the Molecular Biology Institute of Paraná – IBMP, Brazil (L.F.O.L., L.F., M.A.K., no specific grant); and by the Center for Vaccine Research at the University of Pittsburgh, USA (M.L.P., D.F.C., E.J.M.N, G.G., no specific grant). The other authors received no specific grant from any funding agency, commercial or not-for-profit sectors to perform this research.
Authors contribution
I.F.T.V. designed and produced the p24 protein, acquired the CD spectra, designed and performed Luminex and ELISA assays against p24-specific total IgG and IgG3 antibodies, performed statistical analysis and wrote the paper; D.F.C. produced the p24 protein, performed ELISA against p24-specific total IgG and IgG3 antibodies and wrote the paper; M.L.P. performed ELISA against p24-specific total IgG and IgG3 antibodies and wrote the paper; E.J.M.N. designed and performed ELISA against p24-specific total IgG and IgG3 antibodies; G.G. performed SDS-PAGE and western-blot analysis; L.F.O.L. and L.F. designed and performed LMA against p24-specific total IgG antibodies; M.A.K. selected serum samples for LMA analysis; C.P. selected and provided the CEPHIA panel samples; C.E.C.S. designed the DNA sequence codifying for the p24 protein; R.M. and C.R. selected the MACS samples for analysis; R.D. optimised the DNA sequence coding for the p24 protein and designed LMA experiments; E.T.A.M. designed experiments and coordinated study.
Compliance with ethical standards
Conflicts of interest
The authors declare that they have no conflict of interest.
Ethical Approval
The human serum samples used in the LMA and ELISA experiments were commercially acquired or provided by the CEPHIA consortium. All the human serum samples from the MACS cohort reported by the authors in this article were provided by the MACS team after approval by the Ethical Committee of the University of Pittsburgh.


