


Introduction
Pertussis, or whooping cough, is an acute upper respiratory infection of humans primarily caused by Bordetella pertussis bacterium. Transmission occurs via airborne droplets expelled from coughing- or sneezing-infected individuals. Despite high vaccination coverage and very large reductions in incidence of serious disease, pertussis infection remains endemic in most settings, including Australia [Reference Jackson and Rohani1].
Pertussis epidemics are known to cycle with peaks occurring every 3–5 years [Reference Jackson and Rohani1, 2]. This pattern has been attributed to the replenishment of the susceptible population fraction due to births, waning of immunity or mortality amongst the immune population, leading to cyclic changes in incidence in endemic settings [Reference Jackson and Rohani1, Reference Broutin3]. Unlike other respiratory infections, there is a lack of consensus around the nature and extent of pertussis seasonality. While studies have suggested that pertussis exhibits seasonality, there remains debate as to the timing of infection peaks and the causes of these seasonal fluctuations. For instance, evidence of seasonal fluctuations in pertussis incidence in some countries has suggested increases during the spring–summer months [Reference Skowronski4–Reference Bhatti8]. However, there are also studies which, through exploring relationships between notifications and environmental factors, have suggested pertussis may be more evident during winter months [Reference Gosai, Salinger and Dirks9, Reference Huang10]. The US Centers for Disease Control and Prevention has stated that pertussis has no distinct seasonal pattern, but acknowledged that the infection may increase during summer–fall [Reference Hamborsky, Kroger and Wolfe11]. As with many respiratory infections, pertussis transmission is thought to be influenced by seasonal variations in the environment, human behaviours and to some extent host immune responses, potentially leading to seasonal oscillations in incidence [Reference de Greeff7, Reference Fisman12–Reference Nelson14].
In Australia, pertussis is a nationally notifiable disease with laws mandating that both confirmed and probable cases of the infection must be reported to the Commonwealth's National Notifiable Diseases Surveillance System (NNDSS) [2]. Among vaccine-preventable diseases of childhood, pertussis is the most frequently notified, with Australia reporting the highest rates of notifications amongst high-income countries since the early 1990s [2, Reference McIntyre and Nolan15]. There have been many proposed reasons for the increase in reported incidence of pertussis in Australia, including increased and more sensitive testing and declining population immunity [Reference Jackson and Rohani1, Reference He and Mertsola16, Reference Wood and McIntyre17].
Multiple epidemics of pertussis occurred in Australia beginning 2000s with varying timing and frequency across different states and territories [2, Reference Pillsbury, Quinn and McIntyre18]. Descriptive analyses of notification trends suggest that epidemic peaks occur every 3–4 years [2] and that monthly notifications increase from late winter to early summer in Australia [Reference Chiu19]. A recent Australian study evaluated both notification counts and proportions of tests positive for pertussis via polymerase chain reaction (PCR) and serological tests from 2008 to 2011 in Queensland (QLD), Australia, finding a peak in the positive test proportion from October to February (spring to summer) [Reference Kaczmarek6]. This contrasts, however, with another QLD study using spatio-temporal analysis of monthly notifications and meteorological data for pertussis, which found a negative association between temperature and pertussis cases suggesting increased winter transmission [Reference Huang10].
This article aims to characterise seasonal variations in incidence of notification rates in Australia from a statistical perspective with the use of time-series models, which have been extensively used to study infectious diseases surveillance data. Given varying climatic conditions across Australian states and territories, we also aim to determine if seasonal patterns vary by state and territory. Finally, as pertussis infection burden is very different across all age groups, we examine seasonality by age group.
Methods
Data and study setting
We obtained monthly counts of pertussis notifications in Australia from January 1991 until December 2016 from the NNDSS (see Acknowledgements) with additional stratification by age group and jurisdiction. In Australia, both confirmed and probable cases are notifiable. Confirmed cases must have either a laboratory-definitive evidence (isolation of B. pertussis from a clinical specimen, detection by nucleic acid testing or seroconversion in paired sera tests for B. pertussis using whole cell or specific antigen/s in the absence of recent vaccination) or a combination of both laboratory-suggestive (significant change in antibody level to B. pertussis whole cell of antigen/s, or single high IgG and/or IgA titre to pertussis toxin, or single high IgA titre to whole cell B. pertussis antigen, all in the absence of recent vaccination) and clinical evidence (a coughing illness of ⩾2 weeks or specific whooping cough symptoms such as paroxysms of coughing an inspiratory whoop or post-tussive vomiting) [20]. Probable cases are those which have both clinical and epidemiological evidence (an illness 6–20 days after contact with a person likely to be infectious with pertussis and at least one case in the chain of epidemiologically linked cases having confirmatory or suggestive laboratory evidence) [20]. For a complete description of the case definition, see [20]. These definitions are standardised across states and territories in Australia [2].
Data were made available for all states and territories except for the Australian Capital Territory (ACT). We requested data that combined some jurisdictions due to small cell counts, with the analytic regions provided as follows: (1) New South Wales (NSW); (2) Victoria and Tasmania (VIC/TAS); (3) QLD and Northern Territories; (4) South Australia (SA); and (5) Western Australia (WA). Count data were also stratified into the age groups <6 months, 6 months to 4 years, 5–9, 10–64 and ⩾65 years, with the width of these groups reflecting the changing disease rates with age [Reference Pillsbury, Quinn and McIntyre18] and potential vaccination strategies [Reference Campbell21].
Statistical analysis
Monthly pertussis notifications were standardised to a 30-day month, i.e. $\hbox{adjusted count}_t = \displaystyle{{\hbox{count}_t \times 30} \over {\hbox{number of days in month }t}}.$
Prior to fitting the full model, we first identified the appropriate multiannual cycle lengths in the overall and state/age notification series via inspection of peaks in the periodograms generated by applying the Fast Fourier Transform.
A time-series model applying the decomposition method, previously applied to other respiratory pathogens [Reference Poljak, Carman and McEwen22, Reference Willis23], was used to extract information on seasonality while accounting for other components (e.g. trends). Such models are useful in this context because they can provide robust estimates of seasonal effects while controlling for other known factors such as changes due to epidemic cycles and change points [Reference Zhang24]. In this regard, we formulated a generalised additive model (GAM) to characterise seasonal patterns in pertussis notifications (counts per month), which offered two advantages for our purpose: (1) flexibility to specify the distribution from which our series is generated; and (2) the ability to fit polynomial-based spline functions to complex trend patterns. A quasi-Poisson log-link function was used to account for overdispersion. A change point was also included to account for observed changes in both mean and variance late in the series. In addition, we tested for autocorrelation (AR) in the series to decide if the model needs to include AR terms.
The model was formulated as:
 $$\log y_t = P(t) + \mu I(t-t_0) + \beta \log y_{t - 1} + A_1\cos (\omega _{t,\; 1} - P_1) + A_1\cos (\omega _{t,\; 2} - P_2) + \varepsilon _t$$
where
y t: =monthly-adjusted pertussis notifications for month t
P(t): =smoothed polynomial-order splines trend component at time t
μI(t − t 0): =shift in the mean where I(t − t 0) is the Heaviside unit-step function, t 0 is the change point and μ is the magnitude of the shift
βlog y t−1: =autoregressive component of lag order 1
A 1cos (ω t,1 − P 1): =cosinor corresponding to monthly effects
A 2cos (ω t,2 − P 2): =cosinor corresponding to multiannual cycle
ω t,s: = 2π(t − 1/D s), where D 1 = 12 and D 2 is the multiannual cycle length in months determined from the periodogram for the relevant notification series
εt: =model random error assumed to follow a white noise process with t = 1, 2, …, 312 as indices for the months beginning January 1991 up to December 2016.
Both annual and multiannual seasonal components were formulated as full-cycle cosinor terms (i.e. the seasonal cycle can be explained by sines and cosines) in the model. We tested inclusion of higher frequency cosinor terms but did not find substantial improvements in model fit or changes in estimates of seasonal components. For each cosinor component, A corresponds to the amplitude of the cycle and P (the phase) determines the timing of peaks for each cycle. In our model, we assumed stationary seasonal effects, i.e. the intra- and inter-annual seasonal effects do not change with time. Further technical details are provided in Supplementary Material S1.
We also used a long time series (spanning 26 years) in order to have more statistical power in determining seasonal and multiannual components. We report peaks in terms of calendar months based on the estimated phase of the cosinor component. In addition, we specify this more accurately using a month fraction reported as either early, mid or late. Since this is a Poisson-type model, the yearly amplitude is interpreted as the % increase observed in notifications during the peak month as compared with the yearly average. Estimates of the multiannual period and amplitude are also reported for completeness.
All analyses were conducted in R, with individual models fitted using the gam function of the ‘mgcv’ package [Reference Wood and Wood25]. Confidence intervals (CI) were estimated using the δ-method. Goodness-of-fit was assessed using the model deviance explained (D 2) metric.
Sensitivity analysis
In addition, we conducted sensitivity analyses investigating the interaction between the changepoint and the multiannual cycle lengths and how seasonal and multiannualcomponent estimates changed when removing the AR term from the model.
Ethical approval
Ethical approval for this research was provided by the UNSW Human Research Ethics Advisory Panel (approval number HC17623).
Results
Descriptive summary
The data consisted of 306 147 pertussis notifications between January 1991 and December 2016. The monthly mean was 981 notifications but this masked a strong increasing trend, subject to large fluctuations, with the mean rising from 376 notifications/month during the 1990s through 875 notifications/month during the 2000s to 1910 notifications/month during the period 2010–16.
Identification of other model components
Estimates of the multiannual cycle length based on the periodograms are provided in Table 1. In general, the multiannual cycle length of pertussis was just below 4 years, with the exception for VIC and TAS (3.0 years) where it was shorter, and SA (4.4 years) and the ⩾65 years old age group (5.3 years) which had longer cycles. Despite these differences, the estimated values are reasonably consistent with previous Australian literature that identifies epidemic cycles of around 3–4 years [2].
Table 1. Summary of key seasonal signatures of monthly pertussis notifications from January 1991 to December 2016 for all of Australia and for each subgroup (by states and territories and by age groups)

Numbers inside ( ) are the estimated 95% CIs. Numbers corresponding to the peak month are interpreted as the month and its part in a 12-month calendar. Amplitude is interpreted as the % increase observed in notifications during the peaks as compared to the seasonal average.
The change point analysis found structural breaks in July 2008 in all series, except for WA where the break occurred in June 2004. We found that both the mean and variance of each series increased at the change points.
Model fit
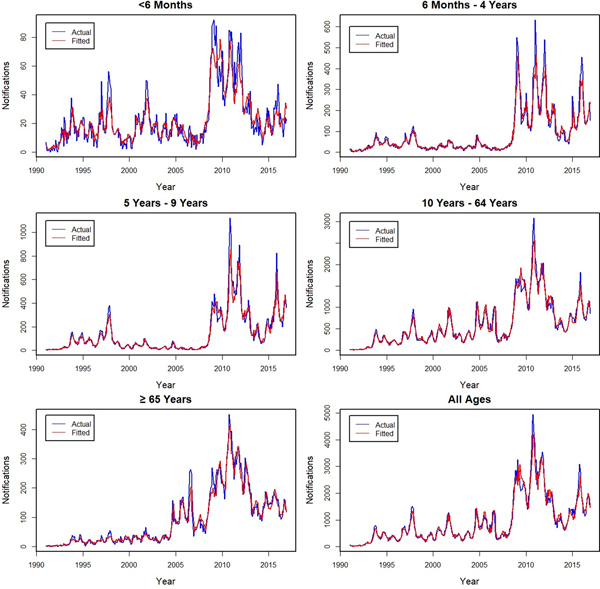
The actual and fitted monthly notifications are shown for Australia and by state and territory (Fig. 1), with the age group fits shown in Figure 2. The models fit well for all series, with individual D 2 values ranging from 90% to 97% for all subgroups, except for the youngest age group for which it was lower at 79%. Errors in the fit were primarily related to underestimating peaks, with younger age groups for which peaks were more common having lower D 2 values. The influence of peaks is especially apparent during the year 2010 for all series.

Fig. 1. Actual (blue −) and fitted (red −) monthly pertussis notifications from January 1991 to December 2016 by states and territories and for all of Australia (from upper left: New South Wales (NSW), Victoria and Tasmania (VIC and TAS), Queensland and Northern Territory (QLD and NT), South Australia (SA), Western Australia (WA) and Australia).

Fig. 2. Actual (blue −) and fitted (red −) monthly pertussis notifications from January 1991 to December 2016 by age groups and for all ages (from upper left: <6 months, 6 months to 4 years, 5–9, 10–64, ⩾65 years and all ages).
The fitted trend and shift components are provided in Supplementary Material S2. Notification series in other states were estimated to increase by >20% from 2008 with the exception of WA. For these series, change appeared to be driven by rises in notifications in children aged <5 years (around 40–50%) with relatively small changes observed for ⩾65-year olds (around 10%). In the case of WA, an earlier change point was found (2004) but the scale of change was minimal (≈3%).
Seasonal characteristics of pertussis notifications
Table 1 summarises key seasonal characteristics of pertussis notifications for the whole of Australia and for each subgroup as estimated by the model. Figure 3 provides visual representations of the fitted seasonal components for each series. For Australia as a whole, we estimated that pertussis notifications peak during early November, with the peak notifications around 15% higher than the yearly average. The amplitude and timing of peaks was similar in most states and territories with the exception of an earlier peak in SA (early October), and later peaks in VIC and TAS (late December to early January).
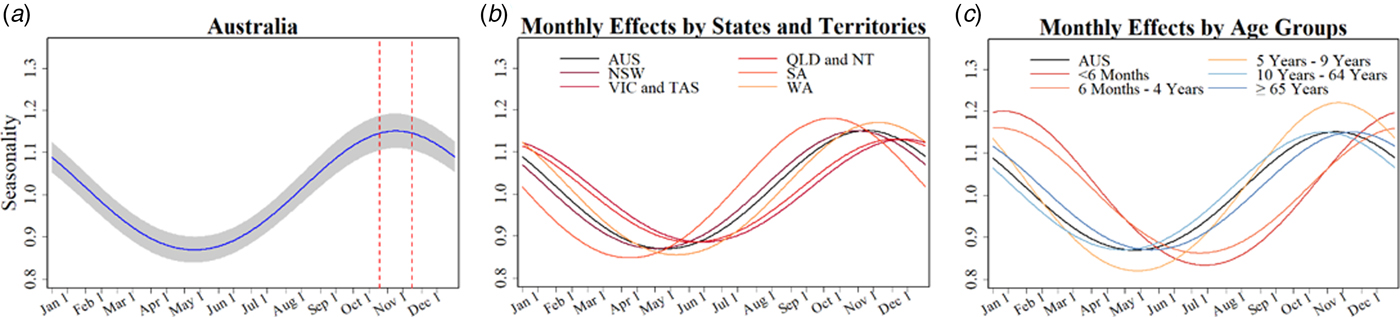
Fig. 3. (From left to right) (a) Estimated monthly % changes in amplitude for the general Australian population (shading indicates 95% CI) and dashed lines delineate 95% CI for peak month. (b) Estimated monthly changes in % by states and territories (colours as shown in legend) and for all of Australia (black). Abbreviations: New South Wales (NSW), Victoria and Tasmania (VIC and TAS), Queensland and Northern Territory (QLD and NT), South Australia (SA), Western Australia (WA), and (AUS) Australia. (c) Estimated monthly changes in % by age groups (colours as shown in legend) and for all of Australia (black).
In respect to the age-group models, we found larger peak-and-trough variations of ≈20% in two of the younger age groups, <6 months and 5–9 year olds, compared with ≈15% in the older age groups. Peak months in those children <5 years were similar but were delayed by almost 2 months.
Sensitivity analysis
Multiannual cycle lengths based on the entire series and the data prior to the identified change points are provided separately in Supplementary Material S3 Table S1. In most cases, this led to a minor decrease in cycle lengths (<2 months), but for WA, it rose from 46 to 54 months, while for the ⩾65-year groups, it fell from 64 to 54 months. For these larger changes, we refitted the models with adjusted multiannual cycle lengths but found no changes in seasonal estimates, while the absolute changes in amplitudes for multiannual estimates were smaller by <0.03.
Results from the models without the autocorrelation term are provided in Supplementary Material S3 Table S2 and Figures S3 and S4. Model fits were much poorer (D 2 dropped by at least 5% to as much as 15%). However, we still found strong evidence of seasonal and multiannual effects with increased amplitudes. In the case of the national data, yearly amplitude increased from 1.15 to 1.30, multiannual amplitude increased from 1.04 to 1.31, and peak month has shifted from November to January. These suggest that there are some identifiability issues in regard to the multiannual, seasonal and AR(1) components. Nevertheless, while model estimates were sensitive to the removal of the AR(1) component, the relative timing and relative amplitude sizes among subgroups were similar to the results of the original model.
Discussion
This article describes the seasonal characteristics of pertussis notifications in Australia as observed from 1991 to 2016 using a time-series decomposition approach. We found that pertussis notifications in Australia exhibit seasonal variation with peaks beginning from early November in the overall population but with delays until January and February for younger children. These findings add to previous descriptive studies that have noted seasonality in pertussis in Australia by establishing more robust estimates of its phase and amplitude. The study provides an important additional insight, evaluating in detail how timing and seasonal amplitude varied by geographic locations and age groups, which were not analysed in the previous Australian studies [Reference Kaczmarek6, Reference Huang10] or in several studies for other countries [Reference Skowronski4, Reference de Greeff7, Reference Bhatti8].
Our findings were largely in line with the previous Australian results of Kaczmarek et al. [Reference Kaczmarek6] which examined the proportion of positive tests (PCR and serology) for pertussis from 2008 to 2011 in the state of QLD. Based on descriptive statistics, they found peaks during October to February (spring to summer) for the proportion of tests positive. However, they also examined seasonality in notifications for the same time period but were not able to establish a clear seasonal pattern in notification count data. For our analysis, having a longer data series (26 vs. 4 years) and a model which was able to account for long-term trends, epidemic cycles and a change point allowed us to establish a clear seasonal pattern for pertussis using notification counts alone. The peak notifications we found during spring to summer months were also consistent with observations in some other countries, particularly Canada and The Netherlands [Reference Skowronski4, Reference de Greeff7], but were almost a season earlier compared with the USA (summer to fall) [Reference Hamborsky, Kroger and Wolfe11].
Our results did contrast with another Australian study on QLD [Reference Huang10] which observed that pertussis counts were negatively associated with monthly minimum mean temperature, thus suggesting that pertussis infection must be more prevalent during colder seasons. The study utilised a spatio-temporal statistical model; however, they did not appear to first de-seasonalise pertussis counts and temperature. This could have potentially led to inherent seasonality serving as a confounding variable and a risk of a spurious association between these two series.
We also found new evidence in support of seasonal patterns differing by age group in Australia. It has been hypothesised that age-specific seasonality in infectious diseases is driven by the seasonality of contact patterns [Reference Nguyen and Rohani26] and age-based activities such as opening of schools [Reference de Greeff7, Reference Huang10]. We found that for children <5 years of age, the peak months were observed 1–2 months later than the general population. The delay in peak timing for these children suggests that pertussis epidemics in Australia could be driven by growth in cases in older children and adults resulting from more activities and social interactions among these age groups [Reference Skowronski4], with a delayed rise in younger children who have less community contacts. It is also consistent with evidence that shows younger children tend to catch the infection from their older household members [Reference Biellik27–Reference Skoff29]. Our finding is broadly consistent with the results from British Columbia, Canada which noted that pertussis incidence among adolescents peaked in June which is earlier than peaks for younger children [Reference Skowronski4]. Likewise results from The Netherlands study which found bimodal summer peaks reflecting the impact of school holidays found the first (July) peak in incidence rates among 13–18 years old [Reference de Greeff7] more than a month before the peak in infants.
We found that pertussis notifications in Australia have multiannual cycles of approximately 4 years in length, consistent with interepidemic periods observed in pertussis incidence in many countries [Reference Jackson and Rohani1, Reference de Greeff7, Reference Hethcote, Horby and McIntyre30]. We note however that our estimated amplitudes were small. We suspect that this may reflect the autocorrelation term in our model absorbing some of the amplitude of the multiannual cycles. As evidence of this, when we removed the AR(1) term, the multiannual amplitude increased from 4% to 30%, although the model fits to the data were inferior. The multiannual period of 4 years appears to be longer than pre-vaccination cycles in Australia [Reference Campbell21, Reference Hall31] and this agrees with observations from Broutin et al. based on data from 64 countries, showing an increase in the interval between epidemics (of 1.3 years) after introduction of vaccination [Reference Broutin3].
We note that there appears to be some differences in multiannual cycle lengths across states and territories in Australia. However, since cycle length was a model input, we were not able to assess the statistical significance of these differences across jurisdictions. Nevertheless, these findings provide evidence of geographic differences in the epidemiology of pertussis across Australia [Reference Quinn and McIntyre32]. Previous studies have identified smaller population and/or geographic isolation as possible explanations of differences in multiannual cycle lengths [Reference Quinn and McIntyre32] (see Supplementary Material S3 Table S1). In addition, some of these differences may be potentially related to variation in vaccination schedule between states with some states funding additional doses during this period beyond the nationally funded National Immunisation Programme (NIP) [2]. For example, NSW funded maternal vaccination during the third trimester of pregnancy in March 2015, before when the strategy was included in the NIP (July 2018).
We estimated a sharp increase in average monthly notifications of about 18% starting in 2008, coinciding with the start of the largest epidemic of pertussis in Australia during our observation period, with a peak of 38 732 notified cases in 2011 [2, Reference Pillsbury, Quinn and McIntyre18]. Aside from the epidemic, a switch to predominant use of PCR to confirm pertussis in children and increase use of PCR even in adolescents and adults is likely to have contributed to a rise in the proportion of infections that were notified. Reimbursements for PCR testing under the Medicare Benefits Schedule became available beginning late 2005 which could have influenced the behaviour to conduct more tests across Australia [33]. Indeed, it has been noted that high levels of laboratory testing inflated Australian pertussis case numbers by identifying more ambulatory cases in children and adults [Reference McIntyre and Nolan15]. Put together, the increased availability of PCR testing (which is more sensitive than culture) and better awareness on pertussis infection have led to increased testing over time, and may have led to a sustained increase in notification rates [Reference Kaczmarek, Ware and Lambert34, Reference Kaczmarek35]. In terms of the epidemic itself, we note that in late 2003, routine pertussis immunisation in Australia saw the introduction of an adolescent booster dose and simultaneous removal of an 18-month booster dose [36]. Dynamic models of the impact of this change suggested a short-term rise in herd immunity, before a larger pertussis epidemic [Reference Hethcote, Horby and McIntyre30] at around the time the real epidemic occurred.
Limitations
There are several limitations in the analysis presented here and the data on which it was based. The routinely collected data requested did not distinguish between test type that resulted in notification. This is important as different testing patterns within a year are observed for PCR and serology tests [Reference Kaczmarek6], the tests differ in diagnostic performance [37] and time trends in testing have occurred, notably the switch to more widespread PCR use [Reference Kaczmarek35]. Notification data are also known to underestimate the true incidence of pertussis in Australia, particularly in older age groups [Reference Bertilone, Wallace and Selvey38]. These data represent only a proportion of all cases which have occurred due to under-reporting, representing only those for which health care was sought and the case definition was met (e.g. a laboratory test was conducted). The degree of under-representation is unknown and may vary by jurisdiction due to varying reporting mechanisms and other factors [Reference Dey39]. For example, while Australia has universal healthcare coverage through Medicare, healthcare seekers still incur out-of-pocket expenses which may bias health-seeking behaviour towards those who can access health facilities more readily [Reference Duckett and Willcox40]. However, notification data can still provide useful information on the distribution of cases. Lastly, our model assumed stationary seasonal effects throughout the study period. While this is reasonable to assume with our data, we note the danger of our model not being able to reflect dynamic changes in seasonality resulting from events such as epidemics.
Conclusion
We found evidence that pertussis exhibits seasonality in Australia notification data. Peaks begin from early November for the overall population but are delayed until January and February for younger children. This supports the theory that older household members remain an important source of pertussis infection for younger children. We illustrate that using a rigorous statistical approach, routinely collected notification count data in aggregated form can provide useful information about the seasonality of pertussis. The pertussis seasonality we have identified suggests that it may be useful to consider seasonal forcing in future population transmission models of pertussis. Further research is needed to identify the drivers of the seasonal variations in pertussis incidence.
Supplementary material
The supplementary material for this article can be found at https://doi.org/10.1017/S0950268818003680
Author ORCIDs
R. N. F. Leong, 0000-0003-2230-9247
Acknowledgements
National Notifiable Diseases Surveillance System (NNDSS) data on pertussis notifications were provided by the Office of Health Protection, Department of Health on behalf of the Communicable Disease Network Australia (CDNA).
Mr R. N. F. Leong is supported by the University International Postgraduate Award (UIPA) for study towards a Ph.D. in the Faculty of Medicine, School of Public Health and Community Medicine, University of New South Wales, Australia.
Conflict of interest
None.


 Open access