


Key results
-
• The estimated incidence of domestically acquired waterborne LD in Canada was 3.06 (90% CrI: 2.02–4.76) illnesses per 100,000 population per year.
-
• LD was underascertained in Canada, with an estimated 2.8 illnesses, 2.5 hospitalizations, and 2.5 deaths occurring in the population for every case, hospitalization, and death that was reported in surveillance, respectively.
-
• The primary diagnostic test for LD can only detect Legionella pneumophila serogroup 1; this resulted in greater underreporting and underdiagnosis of disease caused by other serogroups and species (non-serogroup 1 L. pneumophila and non-L. pneumophila).
Introduction
Context
Opportunistic premise plumbing pathogens (OPPPs) are increasingly important causes of waterborne illness, especially in developed countries. These OPPPs are normal inhabitants of natural waters, and they can attach, grow, and persist in a variety of engineered systems that support conditions for biofilm growth, including drinking water distribution systems and premise plumbing [Reference Falkinham1–Reference Hayward4]. These OPPPs include, among others, species of Legionella, Mycobacteria, and Pseudomonas, which can be transmitted by inhalation of aerosols and cause infections in individuals with predisposing conditions [Reference Falkinham1–Reference Falkinham, Pruden and Edwards3]. A recent estimate of the burden of waterborne disease in the United States [Reference Collier5] showed that OPPPs are responsible for the vast majority of hospitalizations and deaths associated with domestically acquired waterborne illnesses. No comparable Canadian estimate exists; however, a provincial (Ontario) study also estimated that most hospitalizations and deaths attributed to waterborne disease, between 2006 and 2015, were caused by OPPPs [Reference Greco6]. Among the OPPPs, Legionella is the leading cause of reportable drinking water-associated disease outbreaks in the United States, accounting for nearly half of reported outbreaks [7, Reference Holsinger8]. While outbreaks get much attention, over 90% of Legionella cases in the United States and other countries are sporadic cases for which the primary exposure source is never identified [7–Reference Beauté9].
Legionella can cause illnesses collectively referred to as legionellosis, which includes Legionnaires’ disease (LD), a severe pneumonia that can be fatal and, less commonly, Pontiac fever, a milder illness without pneumonia. Most human cases are associated with L. pneumophila, mainly serogroup 1, but other species and serogroups can also cause disease [Reference Cunha, Burillo and Bouza10]. LD affects and kills more people in the United States than any other reportable waterborne disease [7]. In Canada, the reported incidence of legionellosis increased more than eightfold between 2000 and 2018, with more than 600 illnesses per year reported in 2018 and 2019 [11, 12]. It is not possible to determine how much of this incidence is due to LD, as the Canadian Notifiable Disease Surveillance System (CNDSS) does not distinguish between LD and Pontiac fever cases. Data from the United States suggest that 97–98% of cases reported to surveillance are LD [Reference Shah13]. There is also reason to believe that Canadian surveillance data underestimate the true burden of illness, as LD is underdiagnosed and underreported [Reference Yu and Stout14–Reference Cassell16]. Globally, the actual burden of LD is recognized as being underascertained by as much as 8- to 10-fold [7].
An understanding of the ‘true’ burden of disease attributed to Legionella in Canada is critical to reducing rising illness rates. This can only be achieved by accounting for the degree of underascertainment, which is achieved by assessing underdiagnosis (case does not seek medical care, failure to diagnose a condition) and underreporting (failure to report cases that have sought health care) in the population [Reference MacDougall17, Reference Castillo, Rajasekaran and Ali18]. In so doing, estimates of disease burden can be developed that more accurately reflect risk and can be used in identifying public health priorities, directing prevention activities, and setting public health goals. Analyses accounting for underreporting and underdiagnosis have previously been used to establish pathogen-specific estimates of domestically acquired foodborne and waterborne enteric illnesses, hospitalizations, and deaths [Reference Collier5, Reference Scallan19–Reference Thomas22].
Objectives
The objective of this study was to estimate the number of domestically acquired waterborne illnesses, hospitalizations, and deaths associated with LD in Canada, based on national surveillance data from 2015 to 2019.
Methods
Analytical approach
A stochastic model was developed using @Risk (Version 7, Palisade, NY; an add-in for Microsoft Excel, version 2016), and was based on the approach and inputs used by the U.S. CDC [Reference Collier5], aside from some key differences (Supplementary Table S1). The model also followed the schematic and multiplier approach developed by Thomas et al. [Reference Thomas21, Reference Thomas22] (Figures 1, 2). In brief, the methodological approach scaled up reported illnesses, hospitalizations, and deaths that were identified within the Canadian surveillance databases to account for underreporting and underdiagnosis. Details of the modelling approaches, inputs, and assumptions are available in the appendices (Supplementary Appendix S2, Tables S3, S4).

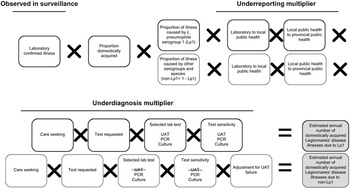
Figure 1. Schematic of the multiplier approach used to estimate the annual number of domestically acquired Legionnaires’ disease (LD) illnesses in Canada from 2015 to 2019, adapted from Thomas et al. [Reference Thomas21]. Laboratory confirmed illnesses were based on the data from the Canadian Notifiable Disease Surveillance System (CNDSS). Illnesses caused by Legionella pneumophila serogroup 1 (Lp1) comprised roughly 95% of lab confirmed illnesses, and the other 5% were due to non-serogroup 1 L. pneumophila and non-L. pneumophila serogroups and species (non-Lp1). The selected lab test (UAT) cannot diagnose non-Lp1 LD; therefore, separate models were used to achieve a final estimate.

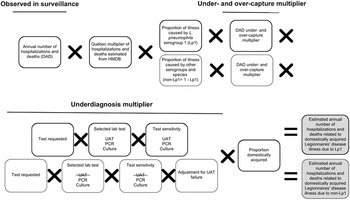
Figure 2. Schematic of the multiplier approach used to estimate the annual number (based on national surveillance data from 2015 to 2019) of hospitalizations and deaths attributable to domestically acquired Legionnaires’ disease (LD) in Canada, adapted from Thomas et al. [Reference Thomas22]. National hospitalizations/deaths were based on data from the Canadian Institute for Health Information Discharge Abstract Database (DAD) and the Hospital Morbidity Database (HMDB). Hospitalizations/deaths caused by Legionella pneumophila serogroup 1 (Lp1) comprised roughly 95% of cases, and the other 5% were due to non-serogroup 1 L. pneumophila and non-L. pneumophila serogroups and species (non-Lp1). The selected lab test (UAT) cannot diagnose non-Lp1 LD; therefore, separate models were used to achieve a final estimate.
Surveillance data from 2015 to 2019 were gathered, and the estimated incidence rates were based on the average Canadian population during this period [23]. This time period represents the most recent period for which there were no concerns of possible impacts of the COVID-19 pandemic on rates of legionellosis. Preference was given to nationally representative data for Canada, followed by provincial/territorial data and Canadian-based published literature. If there was a gap in the Canadian-based literature, values and references from the U.S. CDC [Reference Collier5], or more up-to-date literature from other countries, were used as a proxy. No Canadian data were available for proportion of cases that were acquired while travelling (proportion travel-related), care seeking behaviour, proportion of cases that were tested using a test that can diagnose LD (test requested), or proportion waterborne. However, feedback and validation of model inputs were gathered through two expert review sessions.
Estimating illnesses
This modelling approach is further described in the appendices (Supplementary Appendix S2, Table S3). National laboratory-based surveillance data were obtained from the CNDSS (2015–2019) [12] and used to develop a distribution to describe the average annual number of reported legionellosis illnesses. Given the severity of LD and data reported to CDC’s surveillance system that found 97–98% of submitted cases were categorized as LD [Reference Shah13], all reported illnesses of legionellosis were assumed to be LD. This same assumption was made by Collier et al. [Reference Collier5]. To account for illnesses that were domestically acquired, a factor was applied to remove travel-related illnesses [Reference Shah13]. Data from Public Health Ontario (PHO) were used to estimate the relative proportions of illnesses captured in surveillance that would be attributed to L. pneumophila serogroup 1 (Lp1) and to all other serogroups and species (non-serogroup 1 L. pneumophila and non-L. pneumophila) (non-Lp1) [Reference Peci, Winter and Gubbay24]. Burden estimates were calculated separately for the number caused by Lp1 compared to non-Lp1 to account for differences in sensitivities of diagnostic tests when detecting members of these two Legionella subtypes (Figure 1).
Underreporting multiplier
All confirmed illnesses of LD were assumed to be reported from the laboratory to local public health, and from local public health to provincial public health, and then to the CNDSS. Therefore, it was assumed that there was no underreporting for LD.
Underdiagnosis multiplier
Care seeking
As Canadian data related to care seeking behaviour for those suffering from LD were unavailable, the estimate (99% of LD illnesses seek care) from Collier et al. [Reference Collier5] was used.
Test requested
In patients with community-acquired pneumonia (CAP), a causative agent is not always identified because antimicrobials are prescribed empirically instead of testing [Reference Mandell25]. To account for the possible underdiagnosis of LD in these patients, data from three studies were included [Reference Hollenbeck, Dupont and Mermel26–Reference Henry28], which captured the likelihood of a physician requesting a laboratory diagnostic test for Legionella using standard testing guidelines (i.e., those that have met the Infectious Disease Society of America – American Thoracic Society (IDSA-ATS) criteria for testing [Reference Mandell25, Reference Mandell29]). Based on these data, a distribution was developed with a low, modal, and high value of 56%, 59%, and 65%, respectively.
Specimen submission
The proportion of illnesses for which a specimen was submitted to the laboratory, if a physician requested a test, was estimated to be 90–100% based on input from the expert review.
Selected laboratory test
Data from PHO [Reference Peci, Winter and Gubbay24] and expert consultations were used to develop distributions to describe the proportions of clinical specimens tested by three different laboratory test methods. The mean values for these distributions were: 80% urine antigen test (UAT), 5% culture, and 15% PCR. The selected lab test proportions remained the same in both Lp1 and non-Lp1 models.
Selected laboratory test sensitivity
The UAT is the most widely used method for detection of Legionella in clinical samples in Canada and worldwide. However, it cannot detect non-Lp1 strains [30], while other test methods, such as culture and PCR, can. To account for test sensitivity, data from PHO [30] and the available literature [Reference Fields, Benson and Besser31, Reference Cristovam32] were used to determine input values. In the case of non-Lp1 illnesses, the selected lab test sensitivity for UAT was 0% because it cannot detect them.
Adjustment for UAT failure
This model input used combined theory from ‘selected laboratory test’ and ‘selected laboratory test sensitivity’ regarding the inability of UAT to detect non-Lp1 infections. Of all LD patients presenting to a physician, an estimated 80% were tested using UAT, 5% were tested using culture, and 15% were tested using PCR, for a total of 100%. If all cases were caused by a non-Lp1 strain of LD, 20% of these patients received a test that could properly diagnose their illness and 80% were underdiagnosed. Therefore, to account for these missed cases, a median multiplier of five, which represented the reciprocal value of the proportion of tests that were not UAT (i.e., 1/0.2), was applied to non-Lp1 cases. The multiplier ranged from 3.33 to 10 depending on the minimum and maximum distribution values for the ‘selected laboratory test input (UAT)’.
Proportion waterborne
No Canadian data on the proportion of LD illnesses that were waterborne in nature were available; thus the model relied on an estimate from an expert judgment panel [Reference Collier5, Reference Beshearse33].
Estimating hospitalizations and deaths
This modelling approach is further described in the appendix (Supplementary Table S4). Reported annual hospitalization data were obtained from the Canadian Institute for Health Information (CIHI) Discharge Abstract Database (DAD) by extracting records that included LD in the first 16 diagnostic codes (A48.1 in the International Classification of Diseases, Tenth Revision (ICD-10)). For reported deaths, only records that had LD identified as the most responsible diagnosis code were counted. However, since the DAD does not include data for the province of Québec, historic data (2006–2010) from the Hospital Morbidity Database (HMDB), which included data from all provinces and territories, were used to calculate the proportion of national hospitalizations that occurred in Québec. This proportion was then converted to a multiplier and applied to the DAD counts for 2015–2019, as described by Glass-Kaastra et al. [Reference Glass-Kaastra34].
As in the model of estimated illnesses, the schematic and multiplier approach of Thomas et al. [Reference Thomas22] was used to estimate the number of hospitalizations and deaths attributable to domestically acquired LD in Canada from 2015 to 2019 (Figure 2). These models were again partitioned by Lp1 and non-Lp1.
A data quality study of pneumonia-associated diseases captured within the DAD from 2009 to 2010 was used to develop multipliers for under- and over-capture of LD, as either reported on a patient’s chart and not reported in DAD (under-capture) or not reported on a patient’s chart but reported in DAD (over-capture) [35]. Similar underdiagnosis considerations to those used in estimating illnesses were used here, such as the selected laboratory test and corresponding test sensitivities. The proportion travel-related and waterborne were also the same.
Uncertainty analysis
To capture the uncertainty associated with the estimates, inputs were described using probability distributions (PERT distributions) that captured the range (minimum, maximum) and mode value. Empirical data were used to inform these distributions whenever possible; however, expert feedback was used where data were not available. The final estimates (reported as mean with 90% credible intervals (CrI) around the mean) using these uncertainty inputs were generated using Monte Carlo simulation (100,000 iterations in @Risk software).
Results
Illnesses
From 2015 to 2019, there were an average 438 LD illnesses reported in the CNDSS, 433 of which were estimated to be domestically acquired. The estimated total number of domestically acquired waterborne LD illnesses occurring annually was 1,113 (90% CrI: 737–1,730) (Table 1). Therefore, it is estimated for every one case of LD reported in surveillance, there were an estimated 2.78 cases in the population after accounting for underreporting and underdiagnosis.
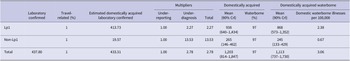
Table 1. Mean (and 90% credibility interval (CrI)) estimated annual Legionnaires’ disease illnesses in Canada, 2015–2019, after accounting for underreporting, underdiagnosis, and proportion attributed to waterborne sources

Note: These values are reported for Legionella pneumophila serogroup 1 (Lp1), non-L. pneumophila serogroup 1 (non-Lp1), and a combined total estimate.
The estimated magnitude of underreporting and underdiagnosis differed for Lp1 and non-Lp1. For every case of Lp1 reported in surveillance, an estimated 2.27 cases occurred in the population. For every case of non-Lp1 reported in surveillance, an estimated 13.53 cases occurred in the population – approximately five times the estimated rate of underascertainment of Lp1 cases. Of the estimated 1,113 total domestic waterborne LD illnesses, 868 (90% CrI: 573–1,352) illnesses were estimated to be caused by Lp1 and 245 (90% CrI: 133–429) caused by non-Lp1.
Overall, there were an estimated 3.06 (90% CrI: 2.02–4.76) domestic waterborne LD illnesses per 100,000 people annually in Canada.
Hospitalizations
The average annual number of LD hospitalizations reported in the DAD for 2015–2019 was 236. After applying the multiplier for reported hospitalizations in Québec, an estimated 386 (90% CrI: 117–945) reported hospitalizations occurred annually in Canada during this period (Table 2). After accounting for under- and over-capture of disease in the DAD and underdiagnosis metrics, an estimated 1,008 (90% CrI: 271–2,244) hospitalizations occurred annually due to domestically acquired waterborne LD in Canada. Of these, 799 (90% CrI: 215–1,774) and 210 (90% CrI: 52–487) were estimated to be caused by Lp1 and non-Lp1, respectively. This corresponded to approximately 83% and 74% of estimated domestically acquired waterborne Lp1 and non-Lp1 LD illnesses, respectively, were hospitalized each year in Canada.
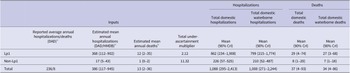
Table 2. Mean (and 90% credibility interval (CrI)) estimated annual Legionnaires’ disease hospitalizations and deaths in Canada, 2015–2019, after accounting for under- and over-capture of cases in the Discharge Abstract Database (DAD), and underdiagnosis

Note: These values are reported for Legionella pneumophila serogroup 1 (Lp1), non-L. pneumophila serogroup 1 (non-Lp1), and a combined total estimate.
a Reported average annual number of hospitalizations and deaths refers to the number reported to Canadian Institute for Health Information Discharge Abstract Database (DAD) from 2015 to 2019. This value does not include hospitalizations or deaths from the province of Québec.
b Estimated mean annual hospitalizations and estimated mean annual deaths are the number of hospitalizations and deaths after the Québec multiplier was applied to the reported values in DAD from 2015 to 2019, providing an estimated national value.
Deaths
The average annual number of LD deaths reported in the DAD for 2015–2019 was 8 (Table 2). After accounting for the number of reported deaths that occurred in Québec, an estimated 13 (90% CrI: 2–36) deaths occurred annually in Canada from 2015 to 2019. After accounting for under-capture, over-capture, and underdiagnosis, there were an estimated 34 (90% CrI: 4–86) deaths due to domestic waterborne LD annually in Canada, 27 (90% CrI: 3–68) of which were caused by Lp1 and 7 (90% CrI: 1–18) of which were caused by non-Lp1.
For every hospitalization or death attributable to LD reported in the DAD (thus excluding Québec hospitalizations and deaths), there were approximately 2.54 hospitalizations/deaths estimated to occur in the population, after adjusting for underreporting and underdiagnosis. For national estimates, Québec data are not included in the DAD; therefore, an additional multiplier of 1.64 is needed.
Discussion
Key results
To our knowledge, this is the first attempt to assess the true national burden of Legionnaires’ disease in Canada, which will inform future waterborne disease risk assessments and research of LD. We estimated that there were 1,113 illnesses, 1,008 hospitalizations and 34 deaths related to domestically acquired waterborne LD occurring annually in Canada from 2015 to 2019. Data from a PHO Laboratory study [Reference Peci, Winter and Gubbay24] were used as the basis for the serogroup division of illnesses captured in surveillance in this model (95% L. pneumophila serogroup 1; 5% other serogroups and species); however, after model adjustments, 22% of the estimated domestic waterborne LD illnesses in Canada were caused by serogroups and species other than Lp1. This estimate is similar to the value of 20% proposed for the United States by the National Academies of Sciences, Engineering, and Medicine (NASEM) Committee [7] and within the range (9–40%) reported by others in North America and Europe [Reference von Baum36–Reference Dooling38]. There is a need to better understand the prevalence and diversity of Legionella species and serogroups causing clinical disease in order to improve treatment measures and disease surveillance. Development of more inclusive Legionella testing guidelines could increase case capture and identification [7, Reference Mercante and Winchell39].
Our general approach was similar to that used by the U.S. CDC in developing its estimates [Reference Collier5]; however, there were some key differences (Supplementary Table S1). In the U.S. estimate, 100% use of UAT was assumed and a value for UAT test sensitivity was used to account for the underascertainment of all Legionella species and serogroups. We employed specific values for the test selection and test sensitivity of three different methods in detecting cases caused by both Lp1 and non-Lp1. Our approach is likely to result in a higher estimate of underascertainment when compared with the U.S. approach because of our decision to specifically examine the effect of UAT and its inability to detect non-Lp1 serogroups and species.
Another model difference was that we used additional literature to support the test requested model input [Reference Hollenbeck, Dupont and Mermel26, Reference Henry28], which contributed to a greater distribution for this input compared to the U.S. model. The elevated distribution values increased the proportion of cases that would have been tested under standard testing guidelines for Canada (60%) in comparison with those of the United States (56%).
The methods used to estimate hospitalizations and deaths also differed from the U.S. CDC approach. In the United States, data on hospitalizations and deaths are captured in their national LD surveillance system to which an underascertainment factor of 2.3 was applied. In Canada, the CNDSS captures the number of reported legionellosis illnesses each year; however, these data are not linked with the legionellosis hospitalizations/deaths reported in the DAD. Therefore, the DAD data, augmented with a multiplier to account for Québec data, was used as the data source for the Canadian estimates, and underascertainment estimates (based on using ICD-10-CA for bacterial, unspecified and aspiration pneumonia codes) were calculated using the DAD Reabstraction Study results [35]. Additionally, the previously described values for test selection and test sensitivity were also employed to account for underdiagnosis, similar to what was done for the illness estimates. The first 16 diagnostic codes in the DAD were used to identify an LD hospitalization, versus the most responsible diagnosis code for death, as it generates a more representative measure of hospitalizations related to the disease [Reference Thomas22].
The advantage of burden of illness estimates is that they allow for international comparisons, as unadjusted incidence rates derived from surveillance systems alone provide an incomplete assessment due to differences in demographics, access to healthcare, laboratory testing, and reporting. This work highlighted the degree to which LD may be underascertained in Canada. We estimated that for every reported illness, hospitalization, and death there were approximately 2.8 illnesses, 2.5 hospitalizations, and 2.5 deaths that occur in the population. This translates to 36% of LD illnesses and 39% of hospitalizations and deaths being captured in surveillance systems. There have been some published estimates of the degree of surveillance system underascertainment of the total burden of LD from all transmission routes. The magnitude of underascertainment of LD illnesses is estimated at 1.6 times in France [Reference Nardone40], 2.3 times in the United States [Reference Collier5], from 2.4 to 13.0 times in the Netherlands [Reference van Hest41, Reference van Lier42] and 12.4 times in Belgium [Reference Fastl43]. From their own assessment, the NASEM’s Committee on Management of Legionella in Water Systems predicts that the rate of LD per year in the United States is 10 times the reported annual rate [7]. Differences in the methodology, data sources, and assumptions have major impacts on the estimated burden of LD, and the values are, therefore, not directly comparable between countries. Nevertheless, the findings highlight that globally, LD is highly underestimated by surveillance systems. Others have shown that Legionella and other OPPPs are significant contributors to waterborne disease-related hospitalizations, deaths, and healthcare costs [Reference Collier5, Reference Greco6]. This study likely provides a conservative estimate of the true burden of LD in Canada, and this information can be used for prioritizing and planning of infectious disease prevention and control measures.
Limitations
There are some limitations with this model. First, it was assumed that all cases of legionellosis reported to the national surveillance system were LD. This hypothesis was supported by the 2014–2015 CDC surveillance data demonstrating 97–98% of legionellosis cases were categorized as LD [Reference Shah13], and 98% of legionellosis illnesses were hospitalized, representing the severity of this disease [Reference Dooling38]. However, data regarding the proportion of reported legionellosis cases that were Pontiac fever were not available in Canada; thus, U.S.-based data were used as a proxy for this assumption. Not accounting for the proportion of reported cases that were Pontiac fever could have resulted in an overestimation of the incidence of LD. A further limitation considers the lack of available and complete Canadian administrative data. The multiplier used to account for Québec assumed that the geographic distribution of LD hospitalizations remained constant between the years 2006–2010 and 2015–2019.
No Canadian data or literature sources were identified for proportion travel-related, care seeking, test requested, or proportion waterborne model inputs. Published literature was used as data sources for a number of model inputs where surveillance data were not available, and the accuracy of our estimates relied on the accuracy of the inputs. Model inputs based on international LD clinical or burden of illness contexts may not accurately reflect the Canadian situation due to differences in healthcare systems; however, all model inputs were discussed, adjusted where needed, and validated with experts identified as knowledgeable in the clinical context of LD in Canada. The values for the proportions of illnesses captured in surveillance that were attributed to Lp1 and non-Lp1 and the proportions for the diagnostic test methods selected in laboratory confirmations were based on Ontario laboratory data [Reference Peci, Winter and Gubbay24]. These values may not be representative of all testing practices in provinces/territories across Canada; however, in consultation with experts, no other Canadian sources providing serogroup breakdown were identified. For the selected lab test input, if UAT is used more in practice than the 80% value used in our model, the underdiagnosis multiplier for non-Lp1 would be greater than it is presently observed. Similarly, if the ratio of national cases attributed to Lp1 and non-Lp1 differs from our input values of 95%:5%, the final output of the model would be significantly impacted. Data on the proportion of legionellosis cases that would have been tested with a laboratory diagnostic test for Legionella were based on the U.S. studies that applied testing criteria established by the Infectious Disease Society of America – American Thoracic Society (IDSA-ATS). Canadian guidelines suggest that testing criteria similar to the IDSA-ATS criteria are used in clinical settings in Canada [Reference Mandell25], which was also confirmed through expert review.
Assessment of our model approach indicated that the proportion of cases with a test requested, the selected test, and test sensitivity were the factors having the largest influence on the underascertainment estimates. Review of the methodological approaches used in the U.S. CDC estimate and in a study of the burden of LD in Belgium [Reference Fastl43] showed similar findings. A survey of Canadian clinical laboratories would refine our understanding of current laboratory practices and test sensitivities. The model input on the proportion of travel-related cases is based on U.S. data and this may not accurately reflect the Canadian situation. Structured expert judgment [Reference Beshearse33] was used for the proportion of disease attributed to waterborne transmission and may be prone to bias. Lastly, we examined nation-wide data and presented an estimate of disease for Canada. This work did not make separate estimates for different demographic or risk groups.
Conclusions
This work provides a current estimate of the true number of illnesses, hospitalizations, and deaths associated with domestically acquired waterborne LD in Canada. These estimates provide evidence that LD causes more burden to healthcare systems than shown through surveillance alone due to important underdiagnosis and underreporting considerations. These findings will be useful for policy makers to inform risk assessments and for directing prevention and control measures to those pathogens that cause the greatest illness burden to Canadians. This analysis identified important data and knowledge gaps and future research and surveillance efforts could explore these elements to develop refined LD burden estimates.
Supplementary material
The supplementary material for this article can be found at https://doi.org/10.1017/S0950268824000013.
Data availability statement
The authors confirm that the data supporting the findings of this study are available within the article and its supplementary materials.
Acknowledgements
We would like to thank all LD and modelling experts who took part in our expert review sessions to discuss the practicality and applicability of this model to clinical practice in Canada. Additional thanks to the authors of the CDC model [Reference Collier5] and other CDC Legionella experts for meeting with us to discuss their model inputs and context specific burden of LD.
Author contributions
Formal analysis: B.D., K.T., C.K.M.M.; Investigation: B.D., K.T., C.K.M.M.; Methodology: B.D., K.T.; Resources: B.D., D.T.M., K.T., D.S., G.Y., C.K.M.M.; Validation: B.D., D.T.M., D.S., G.Y., C.K.M.M.; Writing – original draft: B.D., D.T.M., D.S., G.Y., C.K.M.M.; Writing – review & editing: B.D., D.T.M., K.T., D.S., G.Y., C.K.M.M.; Conceptualization: D.T.M., K.T., G.Y.; Project administration: D.T.M., K.T., C.K.M.M.; Supervision: K.T., D.S.; Data curation: C.K.M.M.; Visualization: C.K.M.M.
Funding statement
This work was funded by the Public Health Agency of Canada (C.K.M.M., B.D., K.T.) and Health Canada (D.T.M., G.Y., D.S.).
Competing interest
The authors declare none.


 Open access