


To the Editor
Segmented regression models are commonly used for ‘before-and-after’ comparison in interventional program evaluation [Reference Linden and Adams1]. Smiddy et al. [Reference Smiddy2] analysed the bloodstream infection (BSI) rate time series in exploring the change in their temporal trends before and after the implementation of observational hand hygiene auditing in Ireland. They reported that the decreasing trends of methicillin-resistant Staphylococcus aureus (MRSA) BSI rate significantly slowed, with P-value = 0.007, from 5% to 2% decrease per quarter pre- and post-intervention, respectively, see their Table 2. In other words, they found that the structural break, i.e. the change in slope in [Reference Smiddy2], in the decreasing trends of MRSA BSI rate is statistically significant. However, by observing the temporal trends presented in their Figure 2 (the panel at row 1 and column 2), I considered this structural break is not obvious, and it may not reach statistical significance. In this study, I re-analysed the data in [Reference Smiddy2] to examine the likelihood of the structural break in the decreasing trends of MRSA BSI rate.
The raw data in [Reference Smiddy2] were unavailable, and thus I digitised the panel at row 1 and column 2 in Figure 2 of their work using WebPlotDigitizer (version 4.2, https://automeris.io/WebPlotDigitizer). I considered two regression models as follows. They were
• the baseline model: E[ln(BSIt)] = α 0 + α 1t + α 2Gap, and
• the full model: E[ln(BSIt)] = β 0 + β 1t 1 + β 2t 2 + β 3Gap, which was the segmented regression as the same as in [Reference Smiddy2].
The E[⋅] denoted the expectation and the BSIt denoted the MRSA BSI rate at the tth time interval. The settings, meaning and interpretation of other notations were exactly the same as in [Reference Smiddy2], but the fitting was conducted with full likelihood frameworks. In this re-analysis, I examined the following three aspects relevant to the estimate of a structural break in BSIt. They included
• the consistency, i.e. the effect size and statistical significance, between the β 1 and β 2 estimates in this study and those in [Reference Smiddy2],
• the consistency between the statistical significance of the change in slope, i.e. (β 1 − β 2), in this study and that in [Reference Smiddy2], and
• the statistical significance of the likelihood-ratio (LR) test of the full model against the baseline model.
All analyses were carried out in R software (version 3.6.0) [3].
I reported that the β 1 and β 2 estimates were consistent with those in Table 2 of [Reference Smiddy2]. Different from the significant level estimated in [Reference Smiddy2], I found the P-value = 0.088 appears not statistically significant at the 5% level, against P-value = 0.007 < 0.05 in [Reference Smiddy2], for the change in slope, which indicated the difference in slopes was statistically unclear. Moreover, I noticed that the 95% confidence intervals (95%CI) of exp(β 1) (from 0.93 to 0.97) and exp(β 2) (from 0.97 to 0.99) estimates in [Reference Smiddy2] were extremely close. This might also be a sign of no difference in β 1 and β 2, and thus a structural break may not have occurred. For the LR test, the P-value = 0.066, which implied the structural break unlikely occurred. As shown in Figure 1 (of this study), the fitting results of the baseline and full models almost overlapped.
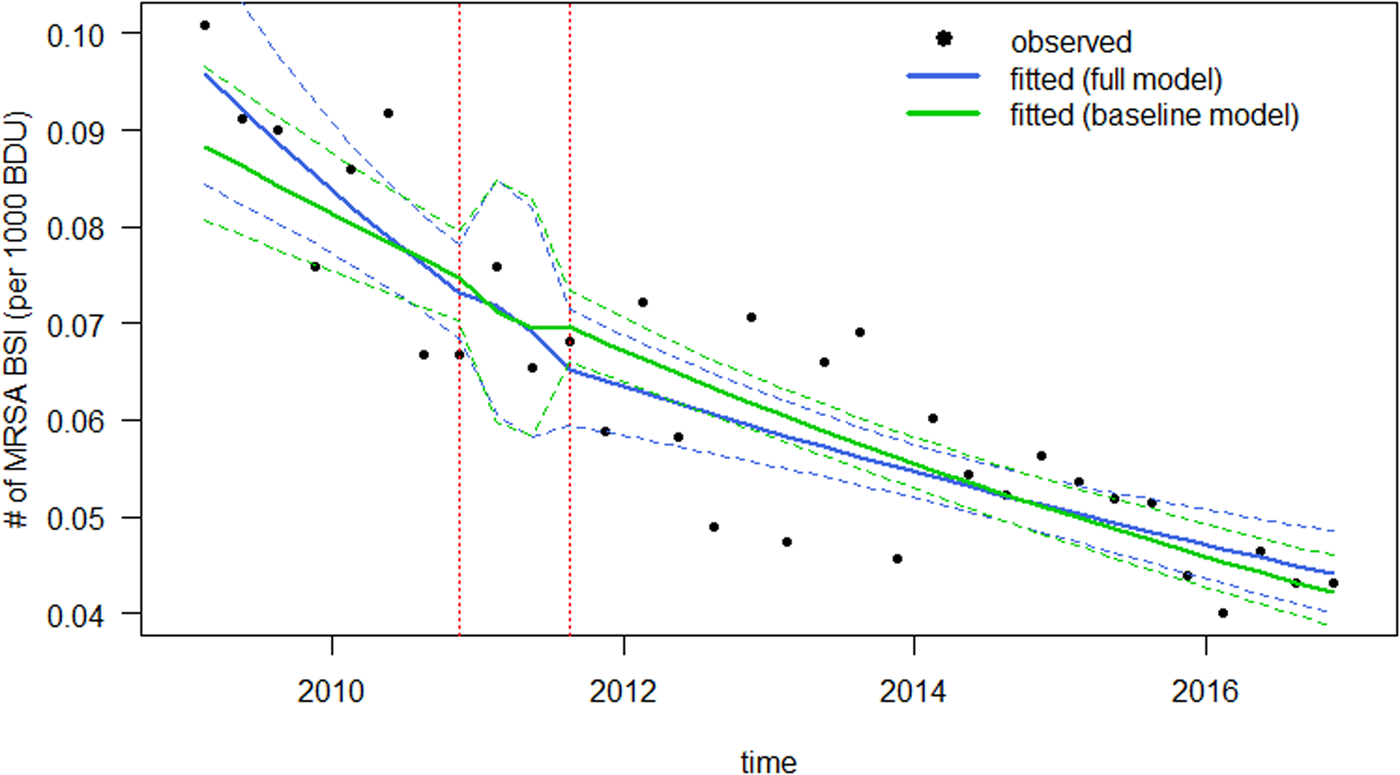
Fig. 1. The fitting results of the association between MRSA BSI incidence per 1000 bed days used (BDU) in Ireland from 2009 to 2016. The black dots are the observed data in Figure 2 (the panel at row 1 and column 2) of [Reference Smiddy2]. The blue curves are the fitting results from the full model and the green curves are the fitting results from the baseline model. Bold curves are the mean fitting results and the dashed curves are the 95%CI.
I note that different fitting framework, as well as, the testing methods were adopted in this study and in [Reference Smiddy2]. The likelihood inference with LR test was used in this study, whereas the robust estimation with Wald test was carried out to obtain an estimate of the variance (Huber-White) for the data as a whole in [Reference Smiddy2]. However, as pointed out in [Reference Hausman and Palmer4],
‘white robust standard errors are universally used in econometrics, (and) their finite sample properties lead to over-rejection under the null hypothesis, sometimes by a large amount.’
This difference in thecourse of analysis probably leads to the inconsistency in the estimates or testing outcomes.
Although this inconsistency between Smiddy et al.'s findings and the findings in this study was unlikely to affect the main conclusions in [Reference Smiddy2], the inconsistency in analysis outcomes from different model setting or frameworks should be considered with caution.
Supplementary material
The supplementary material for this article can be found at https://doi.org/10.1017/S0950268820002733.
Acknowledgements
I acknowledge that reference [Reference Hausman and Palmer4] was initially mentioned by Professor Gabrielle Kelly, who provided statistical adjudication, during the reviewing process of this work.
Author contributions
SZ conceived the study, carried out the analysis, discussed the results, drafted the first manuscript, critically read and revised the manuscript, and gave final approval for publication.
Financial support
This work was not funded.
Consent for publication
Not applicable.
Disclaimer
The funding agencies had no role in the design and conduct of the study; collection, management, analysis and interpretation of the data; preparation, review or approval of the manuscript or decision to submit the manuscript for publication.
Conflict of interests
The author declared no competing interests.
Ethical standards
Ethical approval or individual consent was not applicable.
Availability of data and materials
The raw data digitised from the panel at row 1 and column 2 in Figure 2 of [Reference Smiddy2], and R codes were both available via the online supplementary files.


 Open access