


INTRODUCTION
Hand hygiene is considered to be the single most important infection control intervention to prevent healthcare-associated infections (HAIs). Despite overwhelming evidence and multiple guidelines from national and global health organisations [Reference Boyce and Pittet1], compliance with hand hygiene practice falls short of the desired targets in many healthcare settings. Various measures to increase hand hygiene compliance have been proposed but two interventions, namely multifaceted approaches [Reference Patel2, Reference Al-Tawfiq3] and failure mode effectiveness analysis [Reference Song4] have shown favourable outcomes.
The factors contributing to low compliance rates include knowledge of health care workers (HCWs), system design and provision of suitable products [Reference Pittet5]. We previously used a multifaceted approach to markedly improve hand hygiene compliance among HCWs from 38% in 2006 to 85% in 2011 [Reference Song4]. In this study, we describe the implementation of the Joint Commission Centre for Transforming Healthcare's Web-based targeted solutions tool® (TST®) for improving hand hygiene [6]. The TST programme simplifies the process to address low compliance and other quality and safety issues by identifying root causes of non-adherence to hand hygiene and allows tracking of compliance in the healthcare setting; specific interventions can then be tailored to resolve these causes [Reference Chassin7].
METHODS
The study was conducted at a 350-bed community hospital located in eastern Saudi Arabia and performed in a 30-bed oncology/haematology inpatient unit. The baseline period ran from 1 May to 31 August 2014 and the intervention period from 1 September 2014 to 30 September 2015. The study was part of a quality improvement project and was approved by the Institution Review Board.
The TST is a web-based programme which incorporates the observations made by trained unknown observers and just-in-time coaches with change management strategies. TST has the five stages of a Six Sigma project: Define, Measure, Analyze, Improve and Control [Reference Shabot8]. As such, the program allows accurate measurement of hand hygiene, identification of barriers to full adherence and then use specific solutions to address identified barriers [6]. Monitoring of hand hygiene compliance was done by trained observers (unknown) and just-in-time coaches (known), subsequently referred to as observers and coaches, respectively. All observers and coaches had extensive training on how to make observations and collect data related to these activities. In addition, the coaches were given further training to probe HCWs to provide reasons for non-compliance. In accordance with the World Health Organisation (WHO) 5-moments, the TST® utilised Wash-In/Wash-Out (Pump-In/Pump-Out) methodology adapted for ‘before’ moments for entry and ‘after’ moments for the exit. The coaches interacted with HCWs to determine factors contributing to low compliance while observers monitored practice without any interaction with the staff. Data collected by the secret observers were used to monitor the compliance in the baseline and the improvement phases. The coaches also collected data on barriers to hand hygiene which were used to identify specific solutions from the TST program itself or through literature review. These solutions were implemented in the improvement phase and both observers and coaches continued to collect data and monitor the progress in practice and compliance. Data were generated in the form of control charts to display hand hygiene compliance by the time of the day and specific staff groups and a Pareto chart to identify the key contributing factors for non-compliance.
Data on HAIs rates were also monitored and included central line-associated bloodstream infections (CLABSIs), healthcare-associated Clostridium difficle infection (CDI) and catheter-associated urinary tract infections (CAUTI), according to US CDC NHSN surveillance definitions [Reference Al-Tawfiq3,Reference Al-Tawfiq, Amalraj and Memish9]. Device-associated infection rates were expressed per 1000 device-days for CLABSI and CAUTI; and CDI rates were expressed per 10 000 patient-days.
The impact of interventions on hand hygiene compliance was assessed using paired t test to compare differences in the baseline and intervention phases, and for data collected according to day and night shifts and graphically displayed as P control charts. Differences in HAI rates were also compared by a paired t test; a P value <0·05 was considered significant.
RESULTS
During the study period, a total of 5669 hand hygiene observations were recorded of which, 1741 were during the baseline phase and 3928 in the intervention phase with respective compliance rates of 75·4% and 88·6%, respectively (P < 0·0001). (Fig. 1). Compliance rates for day-time shifts were higher than that observed for night–time shifts (base line, 73·9% vs. 83·9%; intervention, 92·4% vs. 87·3%, respectively) (Figs 2a and 2b ).
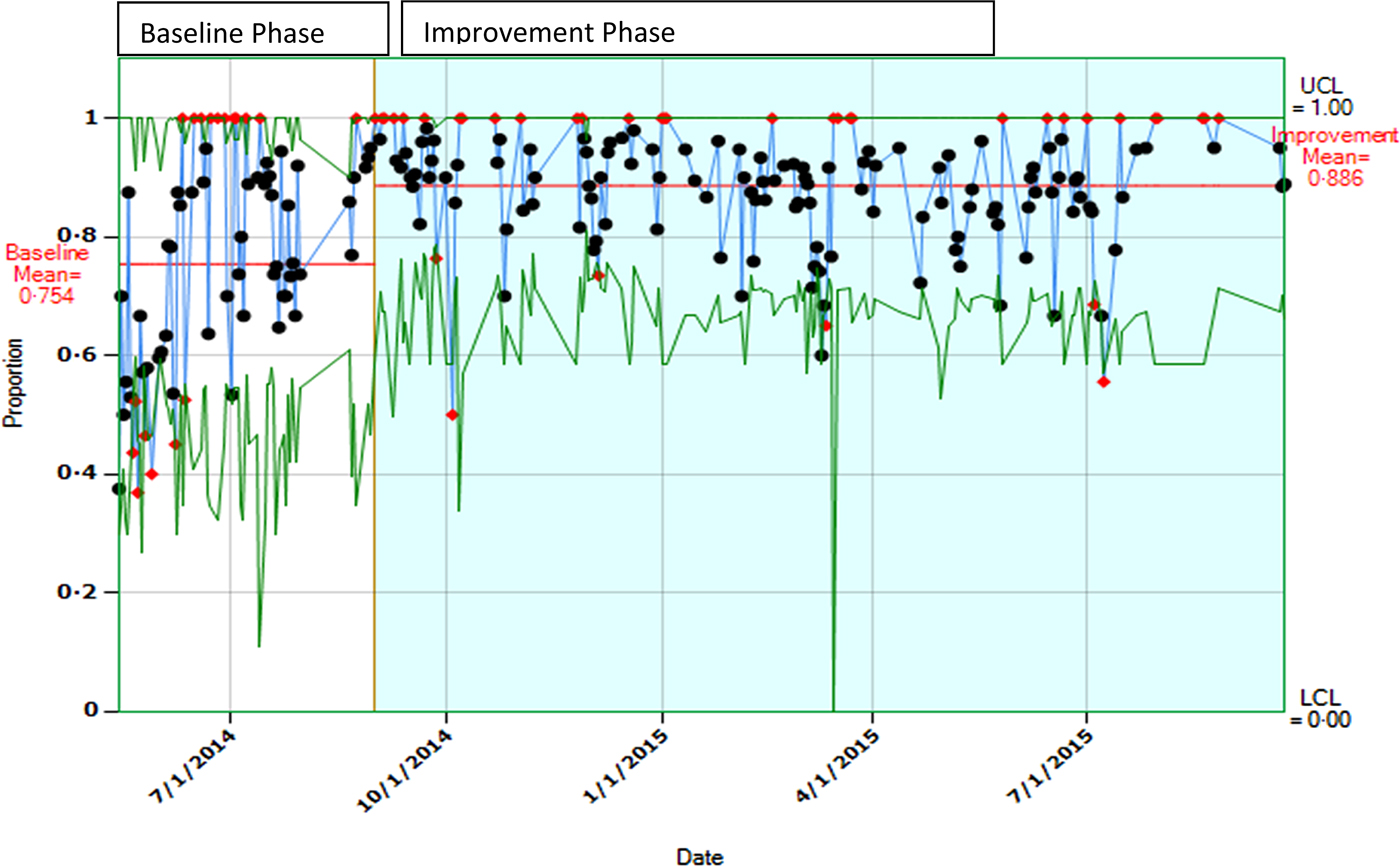
Fig. 1. A control chart showing baseline and improvement rates of hand hygiene compliance. The horizontal line indicates mean compliance rate by ‘secret shoppers’ observations.
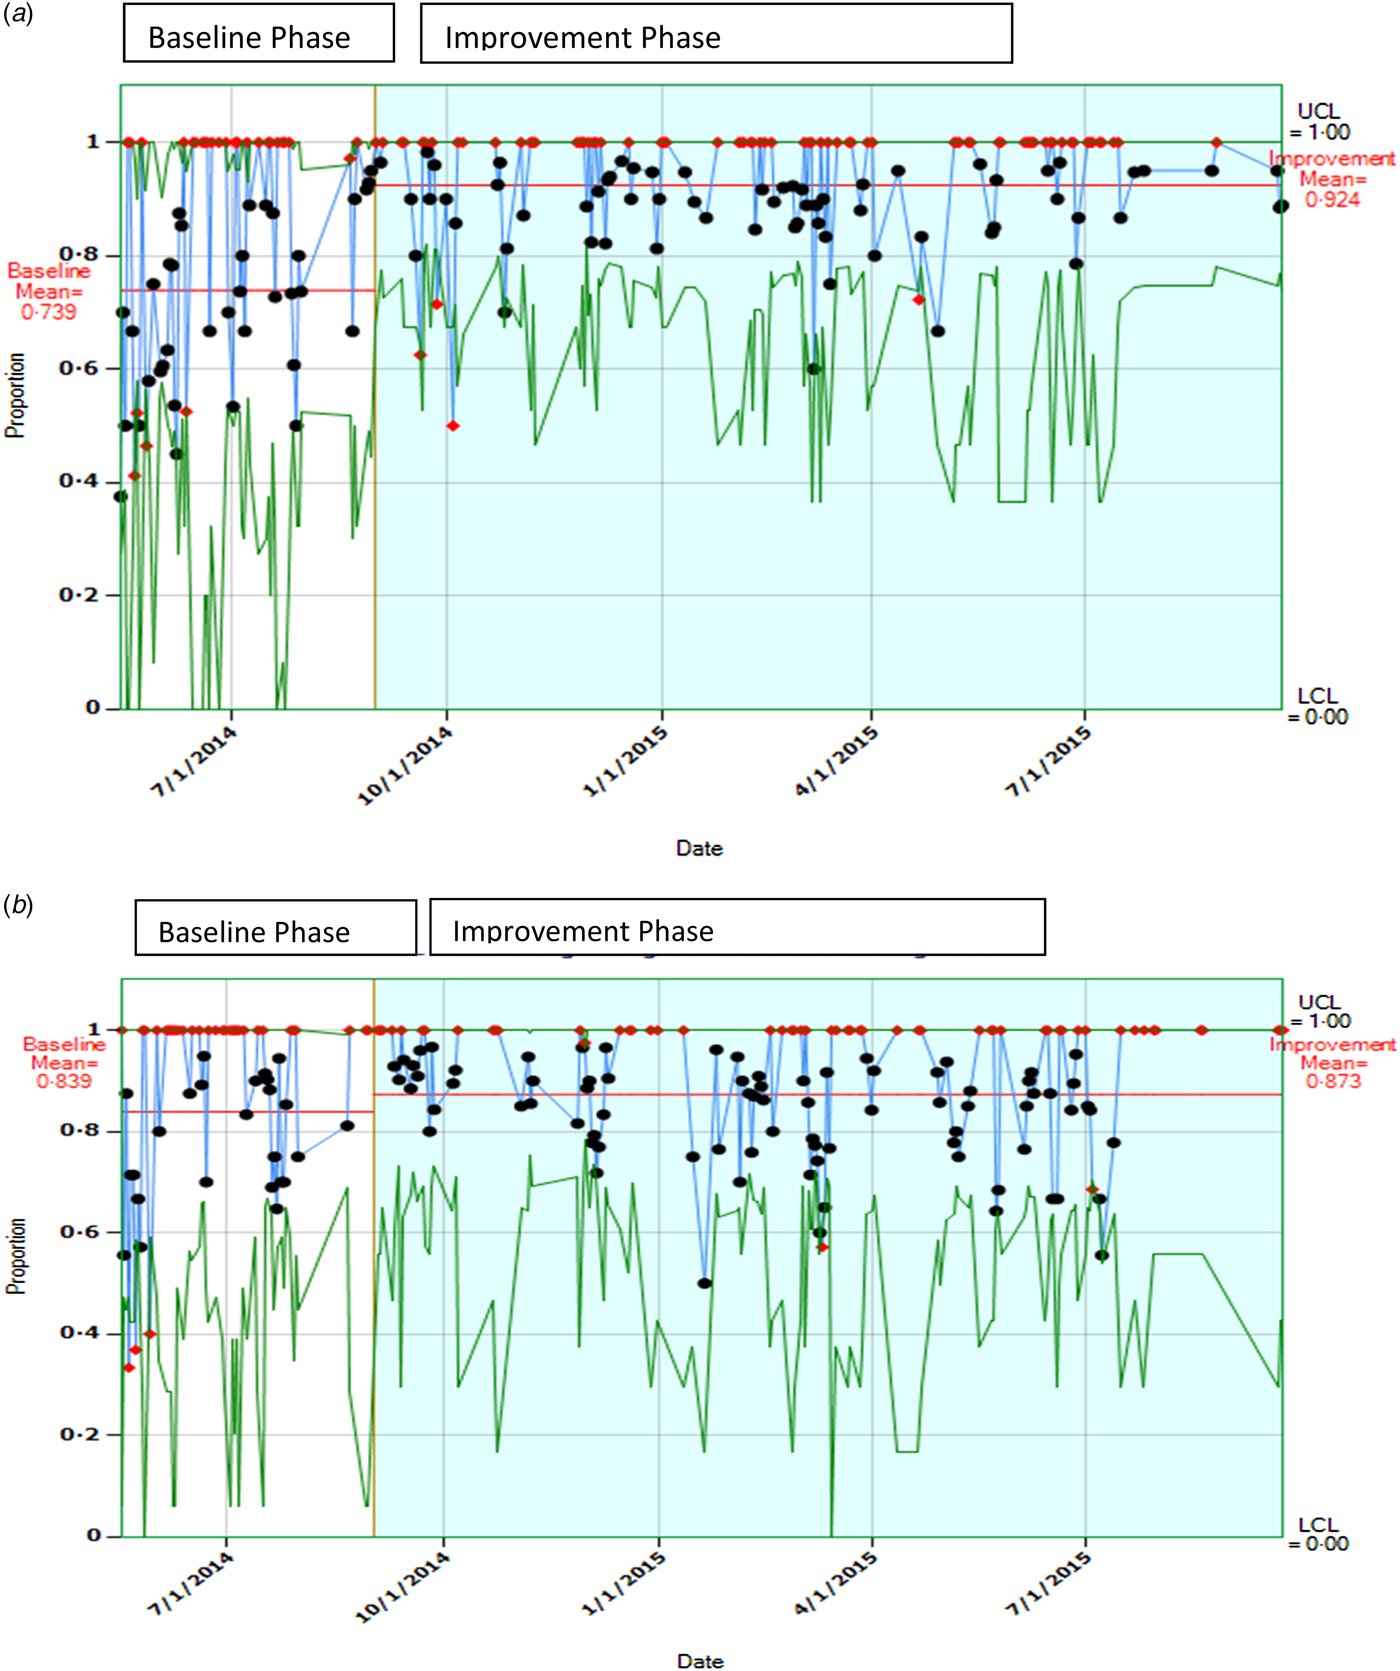
Fig. 2. (a) Control chart showing hand hygiene compliance rates during baseline and improvement phase (day time;7:00–19:00 h). The horizontal line indicates mean compliance rate by ‘secret shoppers’ observations. (b) A control chart showing hand hygiene compliance rates during baseline and improvement phase (night time;19:00–07:00 h). The horizontal line indicates mean compliance rate by ‘secret shoppers’ observations.
The major contributing factors identified for non-compliance to hand hygiene were: hands full of supply (27·5%), use of gloves (27·2%) and hands full of medications (23·4%) (Fig. 3). The groups of staff least likely to comply with hand hygiene practice were housekeepers (44% compliance, dieticians (51%) and laboratory technicians (67%) while nurses showed the highest compliance rate (90%). Based on this information, an action plan was developed to decrease improper glove use through education and focussing particularly on the primary non-compliant groups. Infographic materials were introduced to overcome language barriers in training of staff and the rate of improper use of gloves decreased markedly over the study period 60% – 18%. Figure 4 shows that improper use declined to zero in October 2014 but following the September 2014 meeting it had increased to 40% by January. This increase resulted from new staff joining medical housekeeping necessitating further meetings and educations.

Fig. 3. Pareto chart showing contributing factors to hand hygiene noncompliance.

Fig. 4. The monthly rate of improper glove use. HSK, housekeeping staff; IC, infection control, NSG: nursing staff.
Non statistically significant reductions in HAI rates were recorded for CDIs from 7·95 (CI 0·8937–28·72) to 1·84 (CI 0·02411–10·26) per 10 000 patient-days (P = 0·23), for CLABSI from 5·9 (CI 1·194–17·36) to 2·9 (0·7856, 7·475) per 1000 device days (P = 0·37) and CAUTI from 5·941 (CI 1·194–17·36) to 0 per 1000 device days (P = 0·42).
DISCUSSION
In order to improve hand hygiene practice and identify contributing factors to non-compliance, the TST program was implemented in one unit in our hospital. This resulted in an increase in compliance from 75·4% at baseline to 88·6% during the intervention phase. We were able to identify obstacles to hand hygiene such as inappropriate use of gloves, particularly within the housekeeping department. The majority of housekeepers were not fluent in either English or Arabic and educational levels varied substantially. As a consequence an extensive training program was developed for such staff utilising in-action learning tools and targeted use of translators; these action plans were then rolled out in other clinical areas.
The main factors for success relied on management buy-in and support by project team leaders. However, the impact of the Hawthorne effect – where subjects alter their behaviour due to awareness of being watched – leading to inflation of rates could not be entirely excluded. Staffs were made aware of the project by the use of just-in-time coaches and this had the potential to influence compliance rates but the use of secret observers may nullify this effect. Other strategies to overcome this impact included the use of multiple observations at different times, different observers and validation of observed compliance rates [Reference Al-Tawfiq3].
The TST methodology allowed improvements to be focused on educational, facility and/or process activities with particular attention being paid to hand hygiene education of specific groups and activities. In addition, the programme suggested multiple solutions to problem areas with implementation guides that could be applied according to the identified specific contributing factors. A previous study in our hospital applying a multifaceted hand hygiene program had shown that multiple interventions might be needed to achieve improvements in hand hygiene compliance rates [Reference Al-Tawfiq3] and it was recognised that approaches based on improving knowledge of hand hygiene alone may not achieve the desired outcome of better adherence to healthcare practice guidelines [Reference Hysong10, Reference O'Boyle, Henly and Larson11].
Establishing a goal at the beginning of any project for hand hygiene compliance rates is important to monitor the progress of the effect of various activities and a 50% improvement represents a reasonable target [6]. However, in our project, the target was set at 95% as the compliance rate was already 75% at baseline. A key factor for success was the appointment of coaches to actively engage with non-compliant staff in order to identify perceived barriers to optimal hand hygiene and inform the development of action plans. It was noted that non-compliance of practice by certain professions such as physicians were observed less frequently (<30 observations) and were not included in the further sub-group analysis [Reference Shabot8].
Correlation of hand hygiene improvement with reduction of HAIs has been reported previously [Reference Al-Tawfiq3, Reference Song4, Reference Roberts12]. Although we did not find a statistically significant reduction in the infection rates, a marked decrease in infection rates was evident. Potential explanations for the lack of statistical significance may have been related to the relatively low number of device-days and patient-days studied and the small study size.
Improper use of gloves was the primary contributing factor for non-compliance with hand hygiene which is consistent with a previous study utilising TST [Reference Shabot8]. A recent study also reported inappropriate use of non-sterile gloves in 59% of procedures and the authors suggested that the application of human factors and ergonomics to glove misuse may be more effective than education and policy alone [Reference Wilson, Bak and Loveday13]. Other measures to improve practice include the wider use of hand gel dispensers, visual reminders to prompt hand hygiene and providing a surface for individuals carrying meals, supplies, or medications [Reference Shabot8]. In this study, we have depended on education and monitoring of staff and found this to be the most appropriate approach for reducing improper use of gloves.
There are several limitations of this study. It was conducted in one inpatient area of the hospital and the small number of beds meant that it was not powered to detect significant differences in HAI rates. Also, it formed part of an overall quality improvement project and thus was pre-and post-intervention in design and observational in nature. Other factors contributing to increased compliance of staff with hand hygiene such as altered behaviour when knowingly observed and the effect of the just-in-time coaches may also have influenced outcome as well as inter-observer reliability which was not measured. Nevertheless, we consider that the observed improvement in hand hygiene compliance reflects the adequacy of the methodology used which has been shown to be comparable with results of staff adherence obtained by the WHO 5 moments hand hygiene ‘wash in–wash out’ method [Reference Sunkesula14].
ACKNOWLEDGEMENT
No funding was received for the study.
DECLARATION OF INTEREST
All authors have no conflict of interest to declare.


