


Completed suicide (CS) is a leading cause of death worldwide, particularly among young people (Patton et al., Reference Patton, Coffey, Sawyer, Viner, Haller, Bose, Vos, Ferguson and Mathers2009). According to the World Health Organization (WHO), in 2015, there were 788 000 deaths worldwide by CS; this is equivalent to an annual global age-standardised suicide rate of 10.7 per 100 000 (WHO, 2015). While CS rates are usually provided by most developed countries, there are almost no national statistics on attempted suicide (AS) (Bertolote et al., Reference Bertolote, Fleischmann, De Leo, Bolhari, Botega, De Silva, Tran Thi Thanh, Phillips, Schlebusch, Varnik, Vijayakumar and Wasserman2005). Therefore, little is known about the worldwide burden of AS.
Lack of knowledge of AS rates is a concern because AS represents the most relevant risk factor for CS (Oquendo et al., Reference Oquendo, Currier and Mann2006). Few authors have explored the relationship between AS and CS: (1) Anestis and Bryan compared the ratio of non-lethal AS to CS in the US military general population (Anestis and Bryan, Reference Anestis and Bryan2013); and (2) Hawton et al. calculated a correlation coefficient between AS and CS in young people in various countries across Europe (Hawton et al., Reference Hawton, Arensman, Wasserman, Hulten, Bille-Brahe, Bjerke, Crepet, Deisenhammer, Kerkhof, De Leo, Michel, Ostamo, Philippe, Querejeta, Salander-Renberg, Schmidtke and Temesvary1998). This editorial proposes a ratio of AS/CS rates which might assist health providers in better allocating the always-scarce resources directed towards fighting suicidal behaviour (SB), and open new avenues of research by comparing the ratio across countries.
In the current editorial, we aim to: (1) explore the difficulties in developing a ratio for AS/CS rates; (2) describe prior studies comparing AS and CS; (3) make a first attempt to calculate this ratio across several countries worldwide; (4) review its major limitations; and (5) explore its potential use.
Difficulties in developing a ratio of AS/CS rates
Developing a ratio of AS/CS rates is not easy. If one starts with the CS rates, one needs to acknowledge that there are no common criteria for certifying a death as a CS, and values and cultural beliefs about suicide still influence its registration (e.g. countries with majority Muslim populations tend to under-report CS (Hawton and van Heeringen, Reference Hawton and van Heeringen2009)). As a matter of fact, Giner and Guija (Reference Giner and Guija2014) demonstrated that, between 2006 and 2010, the agency responsible for conducting autopsies in Spain provided higher rates of CS (per 100 000) than the demographic agency. In 2006, the rates were 7.85 v. 7.05, and in 2010, 7.61 v. 6.32, with an average difference during these 5 years between these two rates of 0.97 (SD 0.10) (Giner and Guija, Reference Giner and Guija2014).
If one focuses on AS, one finds that most developing countries do not have an adequate register and AS remains misclassified due to a mixture of obstacles (Vijayakumar et al., Reference Vijayakumar, Nagaraj, Pirkis and Whiteford2005) including (1) nomenclature problems and (2) lack of homogeneity in AS rate reporting.
Regarding the first issue, even after the seminal work on nomenclature developed mainly by Silverman et al. and O'Carroll et al. (O'Carroll et al., Reference O'Carroll, Berman, Maris, Moscicki, Tanney and Silverman1996; Silverman et al., Reference Silverman, Berman, Sanddal, O'Carroll and Joiner2007), the concept of AS is more ambiguous than the more ‘objective’ concept of CS; thus, Borges et al. have stated that we ‘lack a data-driven method to assess the risk of suicide attempts’ (Borges et al., Reference Borges, Nock, Haro Abad, Hwang, Sampson, Alonso, Andrade, Angermeyer, Beautrais, Bromet, Bruffaerts, de Girolamo, Florescu, Gureje, Hu, Karam, Kovess-Masfety, Lee, Levinson, Medina-Mora, Ormel, Posada-Villa, Sagar, Tomov, Uda, Williams and Kessler2010a). This lack of homogeneity in evaluating AS manifests in many countries’ registries as an absence of national statistics (Christiansen and Jensen, Reference Christiansen and Jensen2004).
Regarding the lack of homogeneity of AS rate reporting, at present, we find three AS rates per 100 000 based on two parameters: (a) time schedule: either annual or lifetime; and (b) data source: either population surveys or clinical registers: (1) annual prevalence from AS population surveys, (2) annual prevalence from AS national clinical registers or (3) lifetime prevalence from AS population surveys. AS population surveys should provide the first and third rates. However, population surveys: (1) usually calculate lifetime AS prevalence and do not calculate annual prevalence (Welch, Reference Welch2001); (2) are based on retrospective self-reporting information of SB that can be affected by recall bias and under-reporting; and (3) can vary in how the AS questions are formulated (Borges et al., Reference Borges, Nock, Haro Abad, Hwang, Sampson, Alonso, Andrade, Angermeyer, Beautrais, Bromet, Bruffaerts, de Girolamo, Florescu, Gureje, Hu, Karam, Kovess-Masfety, Lee, Levinson, Medina-Mora, Ormel, Posada-Villa, Sagar, Tomov, Uda, Williams and Kessler2010a).
Annual prevalence of AS from national clinical registers underestimates AS rate by ignoring suicide attempters who are not seen by any health providers. In a Mexican study, the population survey provided an AS annual prevalence of 0.8%, while the clinical data indicated that only 0.13% were seen by health providers (Borges et al., Reference Borges, Orozco, Benjet and Medina-Mora2010b). A WHO study indicated that medical attention following a SA ranged in various countries from 22 to 88% (Bertolote et al., Reference Bertolote, Fleischmann, De Leo, Bolhari, Botega, De Silva, Tran Thi Thanh, Phillips, Schlebusch, Varnik, Vijayakumar and Wasserman2005). Other sources of confusion in the estimation of AS rates are the use of different ways of targeting the population and diverse recruiting methodologies (Welch, Reference Welch2001).
Despite all of these inconveniences, recent international studies are trying to provide better data on AS rates. The literature provides annual rates of 0.3% in developed countries (Borges et al., Reference Borges, Nock, Haro Abad, Hwang, Sampson, Alonso, Andrade, Angermeyer, Beautrais, Bromet, Bruffaerts, de Girolamo, Florescu, Gureje, Hu, Karam, Kovess-Masfety, Lee, Levinson, Medina-Mora, Ormel, Posada-Villa, Sagar, Tomov, Uda, Williams and Kessler2010a), 0.4% in developing countries (Borges et al., Reference Borges, Nock, Haro Abad, Hwang, Sampson, Alonso, Andrade, Angermeyer, Beautrais, Bromet, Bruffaerts, de Girolamo, Florescu, Gureje, Hu, Karam, Kovess-Masfety, Lee, Levinson, Medina-Mora, Ormel, Posada-Villa, Sagar, Tomov, Uda, Williams and Kessler2010a), 0.5% in the USA (ranging from 0.1 to 1.5) (Crosby et al., Reference Crosby, Han, Ortega, Parks and Gfroerer2011), and 0.46 and 0.045% in European females and males, respectively (Platt et al., Reference Platt, Bille, Kerkhof, Schmidtke, Bjerke, Crepet, De, Haring, Lonnqvist and Michel1992; Schmidtke et al., Reference Schmidtke, Bille-Brahe, De Leo and Kerkhof2004).
The literature provides lifetime AS rates of 1.3% (or 1300 per 100 000) in six European countries (Bernal et al., Reference Bernal, Haro, Bernert, Brugha, de Graaf, Bruffaerts, Lepine, de Girolamo, Vilagut, Gasquet, Torres, Kovess, Heider, Neeleman, Kessler and Alonso2007), and 0.4–4.2% (or 400–4200 per 100 000) in an intervention study of ten countries (Bertolote et al., Reference Bertolote, Fleischmann, De Leo, Bolhari, Botega, De Silva, Tran Thi Thanh, Phillips, Schlebusch, Varnik, Vijayakumar and Wasserman2005).
Prior articles exploring the greater frequency of AS v. CS
Reviews propose that AS is 10–40 times more frequent than CS (Platt et al., Reference Platt, Bille, Kerkhof, Schmidtke, Bjerke, Crepet, De, Haring, Lonnqvist and Michel1992; Schmidtke et al., Reference Schmidtke, Bille-Brahe, De Leo and Kerkhof2004). In a more recent worldwide study, the authors reported a mean of 14.6 AS per each CS with a range of 9.1–53.7 (Borges et al., Reference Borges, Nock, Haro Abad, Hwang, Sampson, Alonso, Andrade, Angermeyer, Beautrais, Bromet, Bruffaerts, de Girolamo, Florescu, Gureje, Hu, Karam, Kovess-Masfety, Lee, Levinson, Medina-Mora, Ormel, Posada-Villa, Sagar, Tomov, Uda, Williams and Kessler2010a). In 2015, the WHO provided a global age-standardised CS rate of 10.7 per 100 000 people (WHO, 2015). If it is correct that AS is 10–40 times higher than CS, the rate of AS should range between 107 and 428 per 100 000.
Our calculation of a ratio for AS/CS rates
We have described three possible ratios, depending on the numerator (AS), as the denominator (CS) is always the same (annual suicide rate per 100 000). The first possibility is using population surveys to obtain annual AS rates, which would probably be the best choice but, unfortunately, we lack information on AS annual rates for most countries worldwide. The same problem faces the second possibility: we could use clinical registers to obtain AS rates, but there are almost no AS registers with some notable national exceptions (Christiansen and Jensen, Reference Christiansen and Jensen2004). Thus, we are only left with the third possibility, which uses lifetime AS in the numerator and annual CS rates in the denominator. As the numerator uses lifetime rates and the denominator uses annual rates, the AS/CS ratio is probably inflated due to the different time schedules used (lifetime v. annual).
Table 1 and Fig. 1 summarise the values of the third ratio: lifetime AS/annual CS rates. Our numerators, the lifetime rates of AS per 100 000 were extracted from a WHO review (Nock et al., Reference Nock, Borges, Bromet, Alonso, Angermeyer, Beautrais, Bruffaerts, Chiu, de Girolamo, Gluzman, de Graaf, Gureje, Haro, Huang, Karam, Kessler, Lepine, Levinson, Medina-Mora, Ono, Posada-Villa and Williams2008), which includes previous surveys carried out in the following continents (and countries): Africa (Nigeria and South Africa); the Americas (Colombia, Mexico, and the USA), Asia/Pacific (Japan, New Zealand and China), Europe (Belgium, France, Germany, Italy, the Netherlands, Spain and Ukraine) and the Middle East (Israel and Lebanon). The estimated global lifetime prevalence of AS was 2.7%. Although there were remarkable differences in prevalence cross-nationally, they found similar results between developed and developing countries. Our denominator (annual suicide rate per 100 000) for the ratio was extracted from the publicly available data from the WHO web page (http://apps.who.int/gho/data/node.sdg.3-4-data?lang=en). Given that it was not always possible to match data for AS and CS from the same year in some countries, we used the most proximate year with available AS and CS in each country.
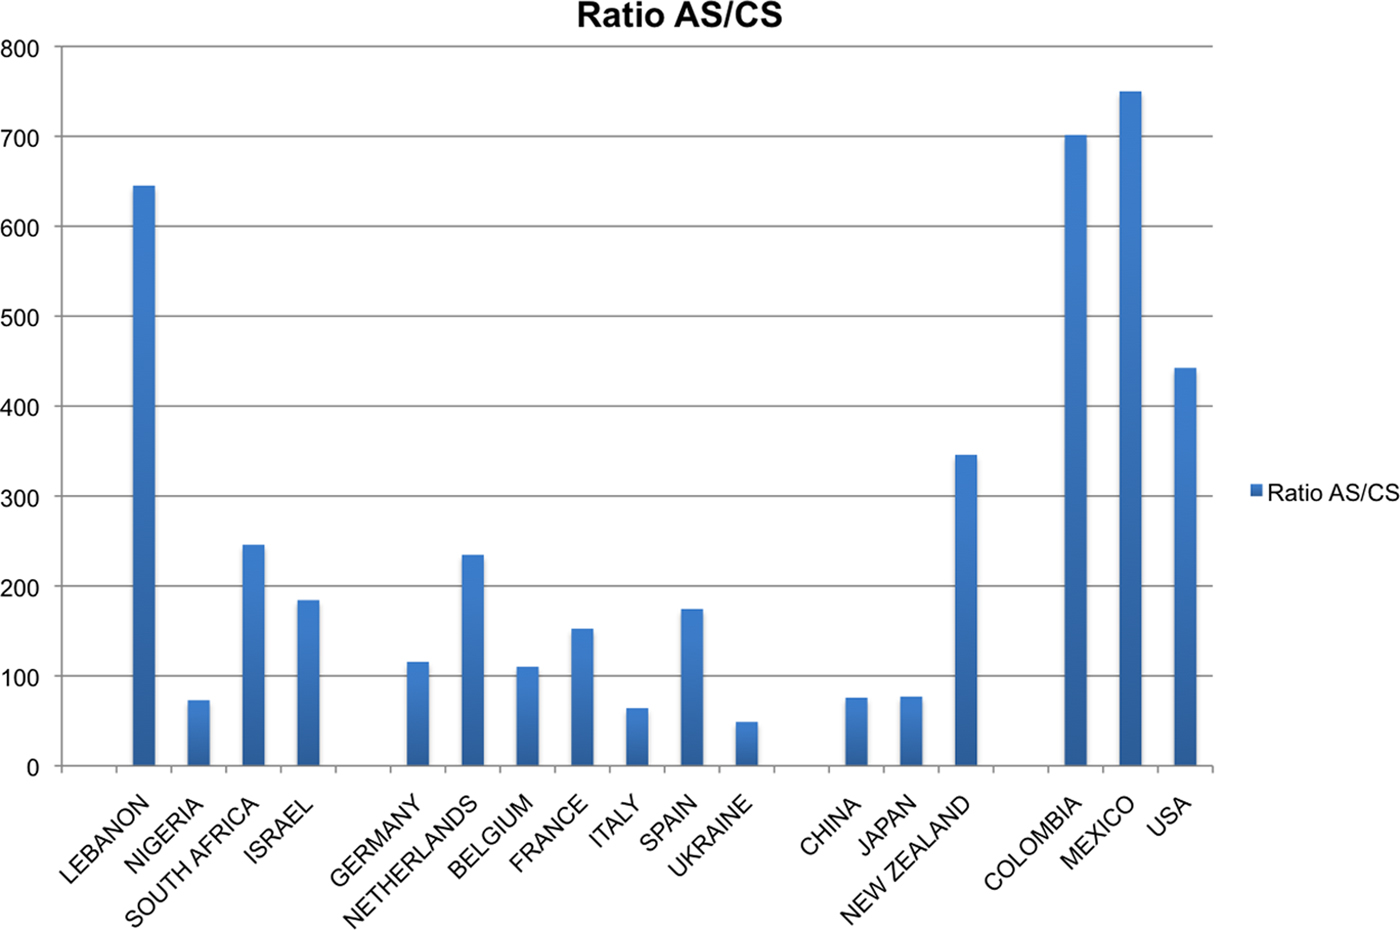
Fig. 1. Ratio AS/CS across several countries worldwide.
Table 1. Rate of suicide attempts and suicides, and AS/CS ratio in the general population in selected countries worldwide
a The WMH Survey Initiative includes information from previous surveys carried out in selected countries: ESEMeD (The European Study Of The Epidemiology Of Mental Disorders); NSMH (The Colombian National Study of Mental Health); NHS (Israel National Health Survey); the World Mental Health (WMH) Survey; WMH-J (World Mental Health Japan Survey); M-NCS (The Mexico National Comorbidity Survey); NZMHS (New Zealand Mental Health Survey); B-WMH (The Beijing World Mental Health Survey); CMDPSD (Comorbid Mental Disorders during Periods of Social Disruption); NCS-R (The US National Comorbidity Survey Replication).
b For retrieving the rate of CS we used the publicly available data from the WHO web page (http://www.who.int/mental_health/prevention/suicide/suicideprevent/en/).
Our AS/CS ratio ranged from 48.8 (Ukraine) to 750 (Mexico). We consider an AS/CS ratio >200 as ‘high’ (with low risk for lethality); high values were found in the Americas (Mexico, Colombia and the USA), Lebanon, South Africa, the Netherlands and New Zealand. We consider an AS/CS ratio <100 as ‘low’ (with high risk for lethality); low values were found in Nigeria, China, Japan, Italy and Ukraine. The countries with the lowest ratios, Japan and Ukraine, appear to have very high rates of CS. In Ukraine, tragic life events (wars and nuclear explosions), economic hardship and a high rate of alcohol abuse are some of the factors that have been pointed to as influencing the high rates of CS (Nordstrom, Reference Nordstrom2007). Japan has a social organisation strongly idiosyncratic when compared with Western developed countries. Devotion to authority, high sense of responsibility and honour, and the lack of religious taboos against CS make CS a culturally accepted tradition in Japan. Historically, hara-kiri has been considered an extreme but honourable way to put an end to personal crises (McCurry, Reference McCurry2006).
We observed no big regional differences in our ratio of AS/CS rates with two remarkable exceptions. In Europe, Spain and France had greater ratios (174.41 and 152.46, respectively) than Italy (64.1). This difference is difficult to explain because they are usually considered culturally similar countries. Low AS and CS rates characterise all three of these European countries, but both France and Spain appear to have more AS than Italy. If this difference is correct, one possible explanation is that Spain and France may have too many suicide attempters for their cultural background. Thus, health providers might consider investing more money to preventing AS in France and Spain. In the Asia/Pacific area, New Zealand (345.9) has a much higher ratio compared with China (75.8) and Japan (76.9). These differences are probably explained by ethnic and cultural differences.
Major limitations in our ratio for AS/CS rates
Our limited attempt to develop a ratio has taught us about the absence of national statistics or registers on annual rates of AS in most countries worldwide. By using lifetime rates instead of annual rates of AS, we are probably providing ratios that are too high. However, all countries faced the same limitation, thus making the data comparable across countries worldwide. In any case, there is an urgent need of spreading adequate national registers with homogeneous international criteria that allow better comparisons and allow us to estimate a ratio of AS/CS rates. Furthermore, there is still an important misclassification in CS registers, especially in developing countries (Vijayakumar et al., Reference Vijayakumar, Nagaraj, Pirkis and Whiteford2005; Wei and Chua, Reference Wei and Chua2008). Until that is resolved, we must be aware of potential biases when using the ratio of AS/CS rates in those countries. Finally, the potential use of our ratio of AS/CS rate to compare trends in SB in different age groups (see below) might be compromised because of the nature of the numerator (lifetime information). Thus, ratios are probably too high when using younger populations, as AS and CS are more and less frequent, respectively, in them. Reversely, our ratio of AS/CS will be lower in older populations. In the same way as expressed above, given that all countries would face the same limitation, the data will be comparable across countries worldwide.
Potential use of the ratio of AS/CS rates
We see potential for the ratio of AS/CS rates here proposed, despite its limitations and, more importantly, once a better version of the ratio can be calculated. The ratio may provide help regarding several issues related to the prevention of SB, such as: (1) improving the accuracy of comparing trends in SB between socially or geographically distinct groups (age, sexes, ethnicity, culture, etc.) and the exact magnitude and impact of SB (Giner and Guija, Reference Giner and Guija2014); (2) identifying populations with high risk of fatal SB (low index), so that specific prevention programmes could be implemented; and (3) assisting governments in deciding where to allocate the mental health resources to prevent SB (either AS or CS, or both). Some have said that limited mental health resources are a reason for the high suicide rates in the West (https://www.wscos.org/in-the-news/2017/3/7/the-hidden-epidemic). But even in high-resource countries, resources allocated to suicide prevention are finite (McPhedran and Baker, Reference McPhedran and Baker2012). How can a manager decide where to allocate these limited resources? To AS or CS? Or to both? For instance, there were significantly fewer suicides in regions with a lower ratio of psychiatric beds or a higher ratio of psychiatrists compared with residents in Japan (Nakanishi and Endo, Reference Nakanishi and Endo2017).
But even considering all these potential uses, the ratio by itself does not provide information on causality. In conclusion, we believe that the ratio of AS/CS rates here presented can be considered a first approximation for the development of a ratio of AS/CS rates using homogeneous and standardised data worldwide. This is a first step towards the development of a simple working tool potentially useful in helping health service managers make evidence-informed decisions when allocating resources to the prevention of SB, and generating hypotheses for future studies in this field.
Acknowledgements
The authors thank Lorraine Maw for English editing.
Financial support
None.
Conflict of interests
In the last two years, Dr. Hilario Blasco-Fontecilla has received lecture fees from AB-Biotics, Rovi, Praxis, and Shire. He has been paid by Praxis for the elaboration of an article. He is the recipient of a FIPSE Grant. He has been involved in a clinical trial (NEWROFEED Study). The remaining authors declare that they have no competing interests.


