


Introduction
Many studies have investigated the extent to which Western Europeans support (liberal) democracy Footnote 1 , concluding that support for (liberal) democracy has been close to universal (Dalton et al., Reference Dalton2007; Inglehart, Reference Inglehart2003; Lagos, Reference Lagos2003). More recent studies discussed whether this support has waned (Foa and Mounk, Reference Foa and Mounk2016; Inglehart, Reference Inglehart2016; Wuttke et al., Reference Wuttke2020), but have not found robust evidence for a decline in citizens’ support for democracy (Inglehart, Reference Inglehart2016; Wuttke et al., Reference Wuttke2020). Other recent studies however suggest that this support is not to be taken for granted. Citizens in many liberal democracies are willing to forego infringements on liberal democracy (Carey et al., Reference Carey2022; Frederiksen, Reference Frederiksen2022; Gidengil et al., Reference Gidengil2021; Graham and Svolik, Reference Graham and Svolik2020; Simonovits et al., Reference Simonovits2022), for example in times of high polarization (Graham and Svolik, Reference Graham and Svolik2020) or when the infringements are conducted by their preferred government (Carey et al., Reference Carey2022; Gidengil et al., Reference Gidengil2021). Are citizens’ self-reported levels of support for democracy pure lip-service? Footnote 2 Two unresolved methodological problems could lie at the bottom of this issue: self-reported levels of support for democracy might be misleading because of social desirability and untested and violated assumptions about concept-measurement consistency. Footnote 3
This study presents findings from a novel survey experiment with 3,500 respondents from France, Germany, Italy, and the UK, each (total N = 14,000). These were representative of their country’s population based on age and gender (cross-quotas applied), education, and size of locality. I use a list experiment to unravel potential problems with social desirability, and topic models to explore open-ended questions about the meaning of democracy to citizens. The design and hypotheses were pre-registered with the OSF. Footnote 4 The survey was administrated by YouGov and fielded to their online sample in early 2020, shortly before the Covid pandemic hit Europe.
First and foremost, this study shows diverse levels of support for democracy across the four countries, ranging from approximately 81 percent in Italy to 92 percent in Germany. These levels of support across countries are not further biased due to social desirability. Citizens who support “democracy” describe the meaning of “democracy” in diverse ways reflecting basic norms and institutions of electoral democracy, but only rarely think of institutions related to liberal democracy such as the rule of law, checks and balances, and the protection of minority rights. Thus, researchers should be wary of potential issues with concept-measurement inconsistency when using standard survey items referring to “democracy” in general as a proxy for citizens’ support for anything going beyond a vague image of a good way of governing and ensuring freedom and participation.
These results have two important implications. First, while social desirability is most likely not an issue for researchers studying citizens’ support for democracy, at least via online surveys, construct validity is a serious issue. Although what citizens think about when they hear the term democracy is most often compatible with minimal electoral conceptions of democracy, citizens mention a wide variety of different things and only rarely mention features of liberal democracy, namely checks and balances, the protection of minority rights, and the rule of law. Second, support for electoral democracy is lower than I expected in Western Europe. If we assume that citizens’ attitudes toward liberal democracy are important for the stability of liberal democratic systems (Almond and Verba, Reference Almond and Verba1963; Easton, Reference Easton1975; Norris, Reference Norris2011), this is a worrisome finding. Citizens’ self-proclaimed support for “democracy,” after all, should not be misunderstood as citizens’ support for all (liberal) democratic institutions, but rather as a genuine support for something “good” related to the freedom, equality, and some form of government by the people.
The following section reviews literature on measurement issues when studying citizens’ support for democracy, followed by the data and research design section. After presenting the results from the list experiment and the exploratory topic modeling, I discuss implications for assessing levels of contemporary support for liberal democracy.
Measuring citizens’ support for liberal democracy
Survey items referencing democracy without further clarification of what this term shall mean are among the most used survey items in political science research. Because they are widely used, there has been a growing body of research regarding their comparability, their validity and potential issues with social desirability. For example, Canache et al. (Reference Canache2001), Lagos (Reference Lagos2003), and Linde and Ekman (Reference Linde and Ekman2003) have shown that respondents think about different things, e.g., the economy vs. political leaders, when they state how satisfied they are with how democracy works in their countries. Likewise, Canache (Reference Canache2012) shows that Latin Americans do not share one common understanding of what democracy means, even within countries. These different understandings have implications for the response behavior of survey participants (Canache, Reference Canache2012). Similarly, Schedler and Sarsfield (Reference Schedler and Sarsfield2007) find that for a substantial amount of Mexicans, support for democracy does not imply support for liberal democracy, but oftentimes support for combinations of illiberal attitudes toward minorities and features of minimal democracy. They conclude that “standard questionnaire items that ask directly and abstractly about attitudes towards democracy suffer from fundamental problems of validity. Their failure to explicate the concrete ideas and ideals respondents associate with democracy clouds their substantive meaning” (Schedler and Sarsfield, Reference Schedler and Sarsfield2007, p. 637).
Not all political scientists share this pessimistic outlook on questions referring to “democracy.” Ariely and Davidov (Reference Ariely and Davidov2011) study the measurement equivalence of two scales often used to assess the degree to which respondents support democracy from the World Values Survey. Again, these items do not explicitly define democracy. Still, the commonly used scale that weights citizens’ support for democracy against their support for alternative forms of government (military, technocracy, strong leader) performs comparably across countries. Footnote 5 In addition, both Canache (Reference Canache2012) and Kiewiet de Jonge (Reference Kiewiet de Jonge2016) argue that although citizens might have different understandings of democracy, by far most of them have an understanding compatible with minimal conceptions of democracy encompassing elections and certain freedoms.
These studies strongly focus either on countries from the Southern hemisphere or on cross-country comparisons, ignoring potential within-country variations. However, the issue that political scientists have liberal democracy in mind, while most respondents do not when they respond to questions about democracy (Schedler and Sarsfield, Reference Schedler and Sarsfield2007, p. 639) might equally apply to respondents from established liberal democracies in Western Europe. In addition, liberal democracy might be more strongly normatively loaded in established liberal democracies than in new democracies. Thus, social desirability might be a real problem in studying citizens’ support for democracy in the Western hemisphere (Inglehart, Reference Inglehart2003; Kiewiet de Jonge, Reference Kiewiet de Jonge2016; Osterberg-Kaufmann et al., Reference Osterberg-Kaufmann2020).
Concluding, to study citizens’ support for democracy based on standard survey items, the following two assumptions must hold: First, citizens must have an understanding of democracy that is compatible with the researchers’ understanding of what the item measures (concept-measurement consistency, see Goertz (Reference Goertz2006, chapter 4)), and second, citizens must respond truthfully to this question, even if democracy might be the perceived norm in their social and political environment. Before discussing these two assumptions further, I briefly define electoral and liberal democracy, the two concepts against which to compare citizens’ understandings of democracy in the analysis.
Differentiating between electoral and liberal democracy
In this study, I use two different definitions of democracy as benchmarks against which to compare citizens’ understandings of democracy: Electoral or minimal forms of democracy and liberal democracy. The first mirrors Dahl’s definition of polyarchy: In every existent democracy, citizens must at least have the opportunity to formulate and signify preferences and to have their preferences weighted equally in conduct of government. His criteria focus on free and fair elections with universal suffrage and universal rights to be elected at least for all adult citizens, free access to information and free expression of opinions (Dahl, Reference Dahl1971, p. 3). This definition is also mirrored, inter alia, in definitions proposed by Collier and Levitsky (Reference Collier and Levitsky1997, pp. 433–4) and Przeworski et al. (Reference Przeworski2000). Most importantly, these minimal definitions do not mention checks and balances, nor the protection of minority rights - unless subconsciously subsumed under civil liberties - nor the rule of law.
Liberal democracy is considered to be a sub-type of minimal democracies with additional features: the rule of law, the protection of minority rights, and effective checks and balances (Coppedge et al., Reference Coppedge2018, p. 38-9; Diamond, Reference Diamond1999, pp. 1–19). Thus, references to liberal democracy could entail things such as equality before the law, independent courts, the separation of powers or specific minority rights. Of course, an understanding of democracy that is incompatible with liberal democracy is not necessarily incompatible with electoral democracy. For example, some respondents claimed that in democracies, governments should do what a majority of the population wants - irrespective of minority positions. Although this statement is incompatible with liberal democracy, it is not in itself incompatible with electoral democracy. The opposite is however true: An understanding of democracy that is incompatible with electoral democracy cannot be compatible with liberal democracy. Thus, positive references to electoral democracy should not be taken as evidence for citizens’ support for liberal democracy, but only as evidence for citizens’ support for electoral democracy.
Civil liberties form a borderline case, mostly because it remains unclear what the speaker subsumes under civil liberties. Civil liberties such as freedom of the press, assembly or speech are obviously necessary criteria for any scientific understanding of democracy. However, the protection of minority rights, such as rights for religious minority groups or gay rights are not defining elements of minimal democracies, as long as these minority groups have an equal chance of participating in political decision-making processes. For example, a democratically elected government could conduct a legal referendum and follow the majority decision from this referendum to ban Mosques from city centers. This would clearly violate the freedom of religious minorities to worship in Western Europe but does not per se restrict their rights to participate in free and fair elections and to hold governments accountable, for example by protesting against such measures. Thus, this decision would violate standards of liberal, but not electoral democracy. Footnote 6
These are not necessarily the definitions used by previous researchers investigating the extent of support for (liberal) democracy in Western Europe. Dalton et al. (Reference Dalton2007), for example, have not differentiated clearly between minimal and liberal conceptions of democracy. However, this differentiation is fruitful, since most contemporary democracies are liberal democracies rather than direct or other types of democracies. While support for free and fair elections might be quite universal, that does not necessarily mean that citizens also support constraints on the majority will to be formulated in these elections, such as judicial independence or minority rights for which there is no majority support. I furthermore only focus on electoral and liberal democracy because a lack of support for direct or other forms of democracy might not affect the stability of liberal democracies, but a lack of support for liberal elements of democracy might undermine liberalism, and a lack of support for electoral democracy could be detrimental to any democratic institution in Western Europe (Almond and Verba, Reference Almond and Verba1963; Easton, Reference Easton1975; Norris, Reference Norris2011).
Concept-measurement consistency
Democracy is a contested concept (Collier and Daniel Hidalgo, et al., Reference Collier and Daniel Hidalgo2006; Gallie, Reference Gallie1969), defined differently by different researchers (Collier and Levitsky, Reference Collier and Levitsky1997) and citizens of different Western European countries (Dalton et al., Reference Dalton2007; Ferrín and Kriesi, Reference Ferrín and Kriesi2016; Hernández, Reference Hernández, Ferrín and Kriesi2016). This has implications for the conclusions that we can draw from survey research. At the same time, most studies on the level of citizens’ support for democracy fall back to the standard questions used in large cross-country surveys such as the European Social Survey and the World Values Survey that refer to “democracy” in general without further specifying what the term means.
Problems with measurement equivalence have been found to affect the comparability of levels of support for democracy across countries because citizens from different countries seem to understand the question differently (Ariely and Davidov, Reference Ariely and Davidov2011). Footnote 7 However, problems might even arise in studies focusing on single countries. In this case, it is not only measurement equivalence we should worry about, but concept-measurement consistency (Goertz, Reference Goertz2006, chapter 4; Schedler and Sarsfield, Reference Schedler and Sarsfield2007): When citizens claim to support democracy, it remains unclear whether they speak of the same thing as we do, as researchers. Citizens might genuinely believe that they support democracy but have an understanding of democracy that is not in line with scientific concepts of democracy (Schedler and Sarsfield, Reference Schedler and Sarsfield2007; Ulbricht, Reference Ulbricht2018).
Previous research provides mixed evidence about Western Europeans’ understanding of democracy. Studies based on data from the European Social Survey suggest that support for liberal democracy is widespread in Western Europe (Ferrín and Kriesi, Reference Ferrín and Kriesi2016; Kriesi et al., Reference Kriesi, Ferrín and Kriesi2016). However, Western Europeans’ understandings of democracy also vary across countries (Dalton et al., Reference Dalton2007; Ferrín and Kriesi, Reference Ferrín and Kriesi2016; Hernández, Reference Hernández, Ferrín and Kriesi2016) and at least some Western Europeans have understandings of democracy that are clearly not in line with liberal democracy (Alonso, Reference Alonso, Ferrín and Kriesi2016; Grossman et al., Reference Grossman2022; Kirsch and Welzel, Reference Kirsch and Welzel2018; Malka et al., Reference Malka2020; Miller, Reference Miller2017; Ulbricht, Reference Ulbricht2018; Wuttke et al., Reference Wuttke2020). Based on the overall results of these studies, it remains unclear to what extent we have wrongly assumed that citizens think of something compatible with minimal conceptions of democracy, or even liberal democracy when they claim to support democracy. I therefore test for:
Concept-measurement inconsistency
Western Europeans do not have the same thing in mind when responding to questions about democracy, even within countries, and they only rarely think of liberal democracy. Footnote 8
Social desirability
Alternatively, some citizens might feel socially pressured to state that they support democracy although they know and feel they do not. This has been an ongoing concern of political science research (Blair, Coppock, et al., Reference Blair and Coppock2020; Inglehart, Reference Inglehart2003; Kiewiet de Jonge, Reference Kiewiet de Jonge2016; Osterberg-Kaufmann et al., Reference Osterberg-Kaufmann2020), especially since Kiewiet de Jonge (Reference Kiewiet de Jonge2016) has shown that support for democracy is overstated in many Latin American democracies, although the bias is substantially small. Social desirability might be even more effective in Western European liberal democracies where liberal democracy is long established and the perceived norm. I therefore test for:
Social desirability
Western Europeans’ self-reported support for democracy is higher when they are asked directly, compared to when they are asked indirectly through a list experiment. Footnote 9
Additionally, Karp and Brockington (Reference Karp and Brockington2005) and Kim and Kim (Reference Kim and Kim2016) found differences in the extent of a social desirability bias in respondents’ self-reported turnout rates across different countries. They claim that social desirability for a given question can be an issue for some countries more than for others, potentially leading to wrong conclusions if only investigated across countries in the aggregate. The extent to which respondents are biased because of social desirability when reporting their support for democracy might thus differ across countries. Hence, a study investigating the extent to which responses are biased due to social desirability needs to test for social desirability in different countries.
Data and research design
I use novel survey data from 3,500 respondents from France, Germany, Italy, and the UK (total N = 14,000). The survey was conducted online as part of a larger research project Footnote 10 via YouGov between January 22, 2020 and February 5, 2020. Respondents represent their national population regarding their age and gender (cross-quotas applied), as well as their educational background and the size of the locality they live in (see Online Appendix C). The survey that includes a list experiment has received ethical approval from the Research Ethics Committee of the Faculty of Management, Economics and Social Sciences of the University of Cologne. The analysis has furthermore been pre-registered with the OSF (https://osf.io/wr3kn/, see also Online Appendix A).
The country selection is a convenience sample based on the countries included in the larger research project. Nonetheless, the selected countries vary in the expected support for and understanding of democracy among Western Europeans. Regarding the importance that citizens attributed to living in a democracy in 2012, responses to the ESS wave 6 show a mean of 8.21 ([8.10; 8.33]) for French respondents, and a mean of 8.38 ([8.27; 8.48]), 9.00 ([8.93; 9.07]), and 8.72 ([8.57; 8.86]) for British, German, and Italian respondents, respectively. Footnote 11 If we look at all Western European countries included in the ESS wave 6 Footnote 12 , France shows the third lowest mean importance of living in a democracy (rank 13 out of 15), the UK ranks 12th, Italy 8th, and Germany 6th out of 15 Western European countries (see Table F.6, Online Appendix F). Responses to the ESS wave 6 also show significant variations regarding the understanding of democracy that citizens had in 2012. For example, Italian respondents attribute more importance to referenda than citizens from France, Germany, or the UK (see Online Appendix F).
The country selection does not allow to draw conclusions for the whole of Western Europe, let alone all democracies, but it increases the variance in expected levels of support for liberal democracy and in citizens’ understandings of democracy across Western European countries. I, therefore, assume that problems with social desirability and concept-measurement inconsistency found in all or some of the countries under study will reflect similar issues for studying citizens’ democratic attitudes in other Western European countries.
Social desirability bias: list experiment
Respondents’ self-reported support for democracy has been measured in different ways (Lagos, Reference Lagos2003). These different measurements of support for democracy ask respondents to what extent they think having a democratic system is good or bad and sometimes compare democratic systems to authoritarian or undemocratic systems (see Online Appendix G for a list of them). These different questions might suffer from social desirability to different degrees.
List experiments have been widely used to detect social desirability biases in survey responses because they give respondents the possibility to hide their true preferences while simultaneously allowing researchers to assess the level of support for a sensitive statement among subgroups of respondents (Blair and Imai, Reference Blair and Imai2012; Glynn, Reference Glynn2013). However, they tend to be biased if they are used for assessing social desirability in responses to questions that are often affirmed (Kiewiet de Jonge and Nickerson, Reference Kiewiet de Jonge and Nickerson2014). In our survey, respondents were thus asked whether they agree or disagree with the statement “It would be better if [country] would not be a democracy.” In contrast to the statements above, this statement only asks about citizens’ attitudes toward democracy, without conflating them with their attitudes toward authoritarianism. Footnote 13 In addition, this is quite a blunt statement, and thus a most likely scenario for social desirability biases.
Table 1 shows the experimental design. Respondents were assigned randomly into one of three groups. (1) one-fifth of respondents were asked directly whether they agree or disagree with four statements, one of which measures support for undemocratic political systems: “It would be better if [country] would not be a democracy.” (2) About two-fifths of respondents were asked to state how many out of three statements they agree with. These respondents were not asked about their agreement with the undemocratic statement. (3) The remaining two-fifths of respondents were asked to state how many out of four statements they agree with. Since these respondents saw one statement more than the second group, the percentage of respondents who agree that it would be better if their country of residence would not be a democracy can be measured by subtracting the mean number of responses in group 2 from the mean number of responses in group 3 (Glynn, Reference Glynn2013).
Table 1 Design of list experiment

This percentage of respondents reflects the ‘true’ percentage of respondents who agree with the undemocratic statement if certain conditions are met. First, random assignment of the respondents to the experimental groups must be guaranteed (Blair and Imai, Reference Blair and Imai2012). Second, responses to three additional statements should be unaffected by whether respondents see the undemocratic statement (no design effects) (Blair and Imai, Reference Blair and Imai2012). Third, statements should be chosen in a way that they avoid situations in which respondents fear to reveal their preferences because they either agree with all or with none of the statements (no ceiling or floor effects) (Blair and Imai, Reference Blair and Imai2012; Glynn, Reference Glynn2013). Respondents in groups 2 and 3 were additionally asked how many of the statements they disagreed with to decrease under-reporting in list experiments (Tsuchiya and Hirai, Reference Tsuchiya and Hirai2010). Furthermore, the sensitive statement was worded negatively to avoid overestimations of the social desirability bias (Kiewiet de Jonge and Nickerson, Reference Kiewiet de Jonge and Nickerson2014).
Concept-measurement consistency: understandings of democracy
To test whether there are issues with concept-measurement inconsistency in questions about democracy, I ask respondents “Generally speaking, what does ‘democracy’ mean to you? There are no right or wrong answers. If you want to, you can list multiple things.” I use an open-ended question since this question format influences respondents’ understanding of what democracy means the least. It is therefore well suited to grasp what respondents think of when they speak about democracy (Ariely and Davidov, Reference Ariely and Davidov2011; Frankenberg and Buhr, Reference Frankenberg and Buhr2020; Osterberg-Kaufmann et al., Reference Osterberg-Kaufmann2020) and will also provide insights into other situations in which the term democracy is used in surveys without introducing it.
I first translate non-English responses to English with DeepL. Footnote 14 I then analyze responses using topic models with Latent Dirichlet Allocation (LDA), a method to quantitatively cluster words into topics based on their co-appearance in documents (Jelodar et al., Reference Jelodar2019; Roberts, Stewart, Tingley, and Benoit, Reference Roberts, Stewart, Tingley and Benoit2018; Roberts et al., Reference Roberts2014). This method has been designed for exploring texts such as survey responses (Roberts et al., Reference Roberts2014) and will explore which words respondents often mention together, irrespective of whether it ‘makes sense’, theoretically speaking, to mention these words together. These different clusters provide insights into the understandings of democracy respondents have, and if they are highly diverse, also into potential issues with concept-measurement inconsistency.
Since researchers need to choose one topic model with a specific number of topics K, I follow the recommendations by Grimmer and Stewart (Reference Grimmer and Stewart2013) and Roberts, Stewart, Tingley, and Benoit (Reference Roberts, Stewart, Tingley and Benoit2018) to select the appropriate K based on quantitative metrics for model fit. A detailed description of the model tuning and selection is provided in the Online Appendix I. Most importantly, I excluded responses with words that only appeared once or were shorter than three characters. For each topic, LDA provides an expected proportion for each open-ended response. Thus, LDA estimates the percentage of a document that is devoted to each of the topics. I planned to categorize the derived topics into different categories, most importantly into a liberal democratic and a general democratic category: (1) Topics are liberal democratic if they refer to any of the defining elements of a liberal democratic understanding that goes beyond the defining elements of electoral democracy. (2) Topics are democratic as long as they do not contradict democracy more generally or a liberal democratic understanding. However, respondents do not make this distinction, and so neither do the topics.
Results
The following subsections will first present results from the list experiment to test for social desirability, and then discuss what citizens have in mind when they state to (not) support democracy. Section 4.3 will briefly conclude, make recommendations for the usage of cross-country survey items referencing “democracy” without further clarifications, and finally discuss potential limitations and unaddressed issues.
Social desirability bias in responses of Western Europeans
Figure 1 shows the agreement with the undemocratic statement for each of the countries under study, once directly measured and once measured using the list experiment. The 95 percent confidence intervals for the list experiment are based on a Welch two-sample t-test of the difference in the mean number of statements agreed with in the control and in the treatment groups. I do not provide confidence intervals for the direct measure since the standard error of dummy variables is a direct function of the proportion of ones and zeros and does not reflect certainty of the point estimate. However, I test whether there is a significant difference between the average levels of support for the undemocratic statement in the direct and in the list experiment groups based on a one-sample t-test for whether the mean direct support is significantly lower than the ‘true’ support from the list experiment. Footnote 15

Figure 1. Social desirability bias in self-reported levels of support for democracy in France, Germany, Italy, and the UK.
First and foremost, agreement with the undemocratic statement varies considerably across the four selected countries. While agreement with the undemocratic statement is low in Germany and the UK, it is higher in France and Italy. When asked directly, about 7.87 percent of German, 10.08 percent of British, 15.01 percent of French, and 19.50 percent of Italian respondents stated that it would be better if their country would not be a democracy. When asked through a list experiment, the percentages were 10.60 (DE), 9.55 (UK), 17.01 (FR), and 20.81 (IT), respectively. These differences are not significant. Thus overall, respondents in each of the four countries do not feel socially pressured to state their support for democracy, at least in online surveys. Irrespective of the measurement strategy, over 15 percent of French and Italian respondents declare their lack of support for democracy, openly.
The results do not provide evidence for the existence of a social desirability bias. Neither are self-reported levels of support for democracy lower for respondents asked directly than for respondents who can hide their true preferences in list experiments, nor is social desirability more of a problem in one of the countries than in the other countries under study. Online Appendix H shows that the assumptions for list experiments to yield valid results are met.
Understandings of democracy among Western Europeans
But what do respondents have in mind when they respond to questions about democracy, especially those respondents who state that they do support democracy? Table 2 describes the topics from the selected topic model. Footnote 16 The underlying LDA model clusters words into topics based on the co-appearance of words in each of the open-ended responses. Thus, by structuring the text, the topic model allows us to explore what “democracy” means to respondents. For each topic, Table 2 shows the topic number, the seven words that predict the topic best and the expected proportion of each of these topics in all responses. Footnote 17 Due to their length, the related responses are only shown in Online Appendix I but should be equally considered for interpreting each of the topics.
Table 2 Description of selected topics
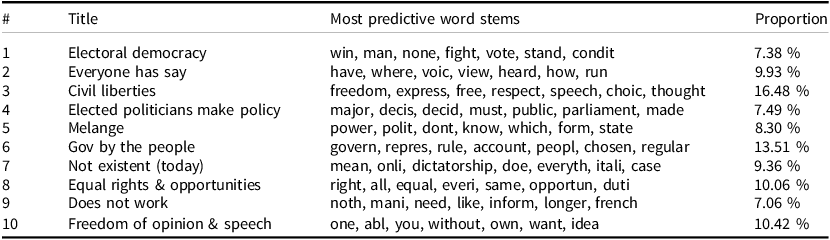
Notes: Words per topic selected based on frequency and exclusivity (frex). Sample responses are shown in Online Appendix I.
Respondents have diverse things in mind when they describe what “democracy” means to them. Most of the topics contained in their responses are descriptions of the term “democracy” that are clearly in line with an electoral understanding of democracy. Topic 1 (Electoral democracy) describes the role of citizens in elections along the lines of “one man, one vote,” “people voting,” and “the highest number of votes win the vote.” Footnote 18 Topic 2 (Everyone has say) is used by respondents who point out that in a democracy, everyone has a say “in how the country is run”. Topic 3 (Civil liberties) compounds several freedoms such as the freedom of the press, assembly and religion. Topic 4 (Elected politicians make policies) focuses on the role of political elites in democratic decision-making processes, most notably on the role of parliamentarians. Their policies should be enacted “for the greater good” or in line with the will of the “general public”. Topic 6 (Gov by the people) clearly describes respondents that mention that in a democracy, “it is the people who rule through their elected representatives.” Topic 8 (Equal rights & opportunities) refers to the idea that individuals have the “same rights and duties.” Topic 10 (Freedom of opinion & speech) describes responses that mention that in a democracy, people are able to “speak out freely,” “without being punished or censored,” and that “you can live […] as you want.”
However, some of the responses feature quite negative references to democracy. Topic 7 (Not existent (today)) flags responses that are highly skeptical about the implementation of democracy in Western Europe. For example, one respondent mentioned that “Democracy is a big word with a comprehensive meaning, but in Germany it is more appearance than reality.” Similar to Topic 7, Topic 9 (Does not work) features highly skeptical responses. In contrast to Topic 7, this topic focuses more on elements why democracy cannot work in the first place. For example, one respondent mentioned: “Sadly, I cannot trust the majority of voters when it comes to making complex decisions.” Footnote 19
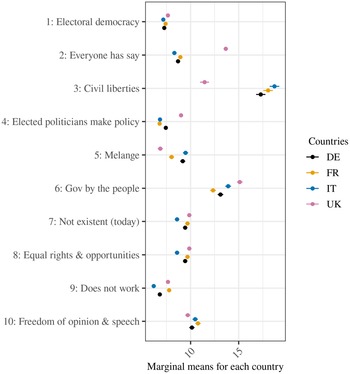
In line with findings by Ariely and Davidov (Reference Ariely and Davidov2011), Figure 2 shows that the prevalence of topics in open-ended responses varies quite substantially across the set of countries under study. Footnote 20 Responses from British respondents seem to differ most from other responses. For example, 13.76 percent of British responses mention that everyone should have a say (Topic 2), but only 8.94 of French, 8.70 percent of German, and 8.32 percent of Italian responses do so. Similarly, 18.04 percent of French, 17.92 of German, and 18.71 percent of Italian responses refer to Civil liberties (Topic 3), but only 11.45 percent of British responses do so. This re-iterates issues with cross-country differences in the meaning that citizens attribute to the term “democracy” (see for example Ariely and Davidov (Reference Ariely and Davidov2011)).
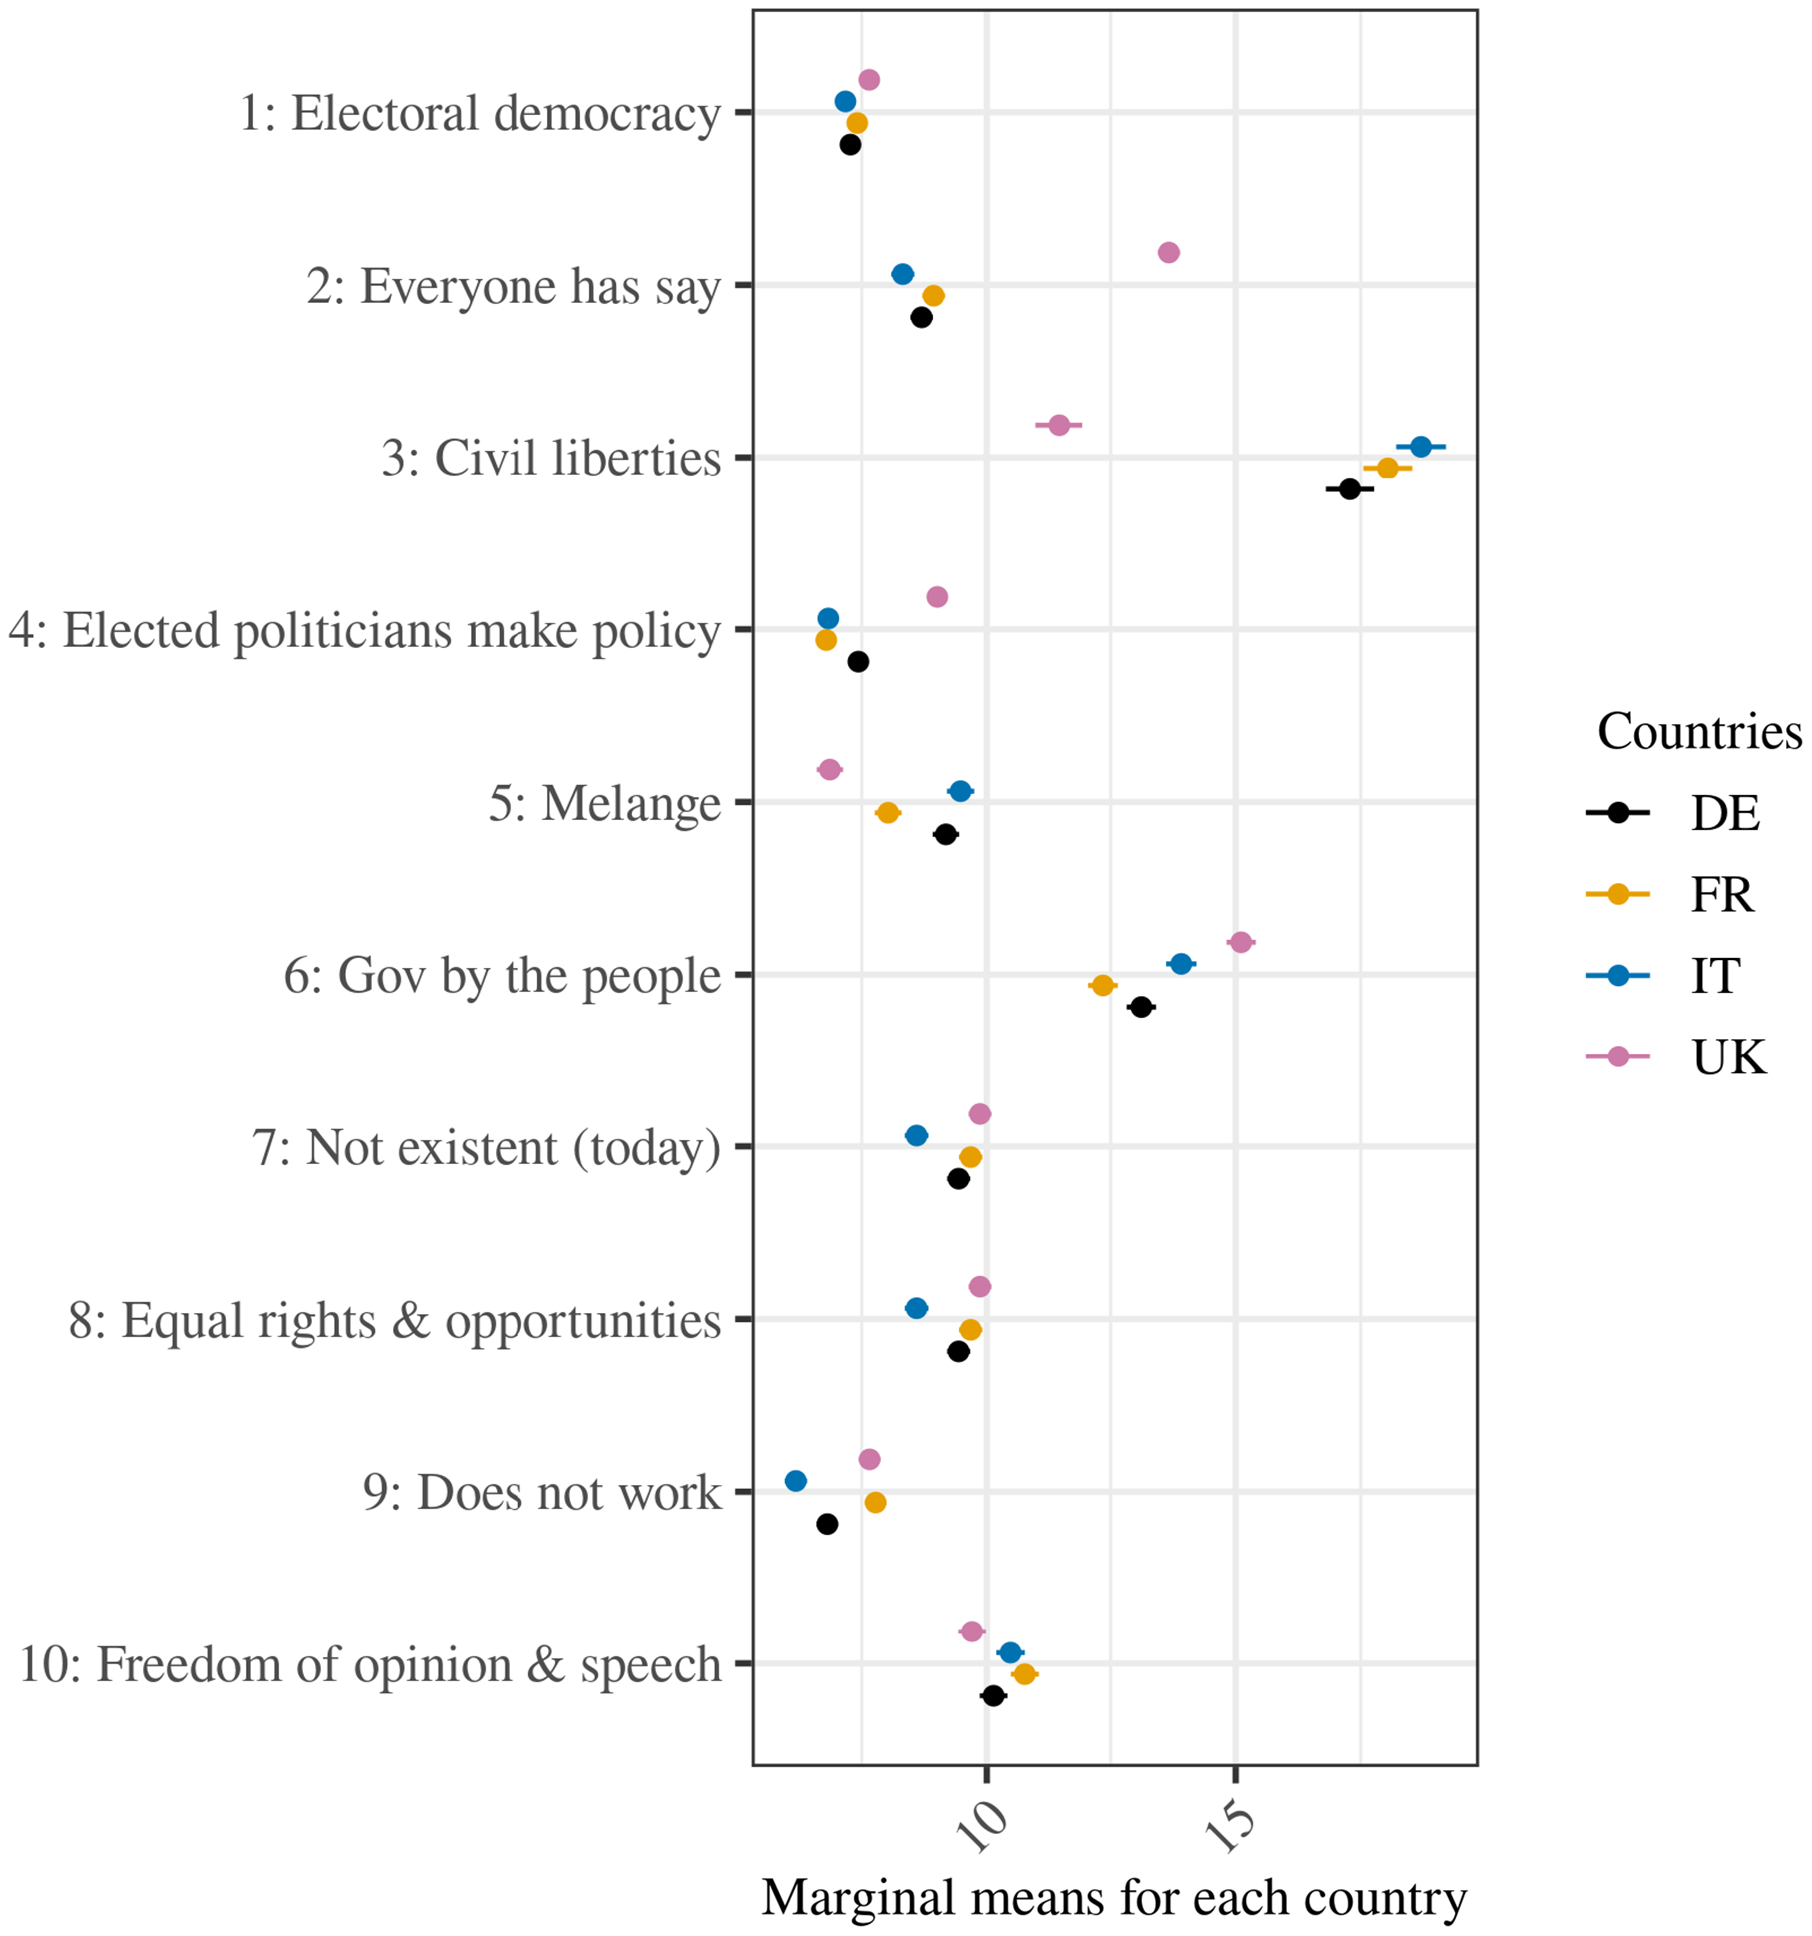
Figure 2. Topic proportions among responses from different countries. Notes: Marginal means are measured at the country level and based on linear regressions of the expected topic proportions for each topic and document on the age, sex, level of education, size of residential locality, political knowledge, and left-right self-placements of respondents, including population weights provided by YouGov.
What is clearly lacking are strong references to institutions of liberal democracy, namely the rule of law, the protection of minority rights, and the separation of powers. A large proportion of respondents mentions ideals and institutions defining electoral democracy, but only one topic touches upon liberal democratic institutions: Equal rights and opportunities (Topic 8) are connected to the idea that citizens are equal before the law, an important element of the rule of law. 9.68 percent of French, 9.44 percent of German, 8.60 percent of Italian, and 9.86 percent of British responses refer to this topic. As shown in Online Appendix I.2, respondents who tend to mention Topic 8 do not tend to mention Topics 4 (Elected politicians make policy), 5 (Melange), 6 (Gov by the people), 7 (Not existent) and 9 (Does not work), suggesting that citizens who refer to equal rights and opportunities are less likely to speak negatively about democracy and less likely to refer to the government by the people than respondents who do not mention Topic 8.
Most interesting, of course, are the understandings of democracy that citizens have who claim that they support democracy, if we are interested in the usefulness of survey items asking about “democracy” in general. Figure 3 compares the prevalence of topics for respondents who directly state that it would be better if their country of residence would not be a democracy with the prevalence of topics in responses by people supporting democracy. Footnote 21 Citizens supporting democracy are more likely to mention one of the substantial topics such as Everyone having a say (Topic 2), Civil liberties (Topic 3), and Freedom of opinion & speech (Topic 10), and substantially less likely to mention any of the negative Topics 7 or 9. Among those supporting (not supporting) democracy, 10.09 percent (8.96 percent) of the responses mention that everyone has a say, 17.11 percent (13.19 percent) feature Civil liberties, 10.60 percent (8.73 percent) refer to Freedom of opinion & speech, 9.11 percent (11.62 percent) claim that democracy does not exist, and 6.71 percent (10.10 percent) state that democracy does not work (see Online Appendix I.4 for the regression results). Hence, citizens who claim to support democracy think about norms and institutions related to minimal electoral conceptions of democracy but do not think about liberal democracy. Footnote 22
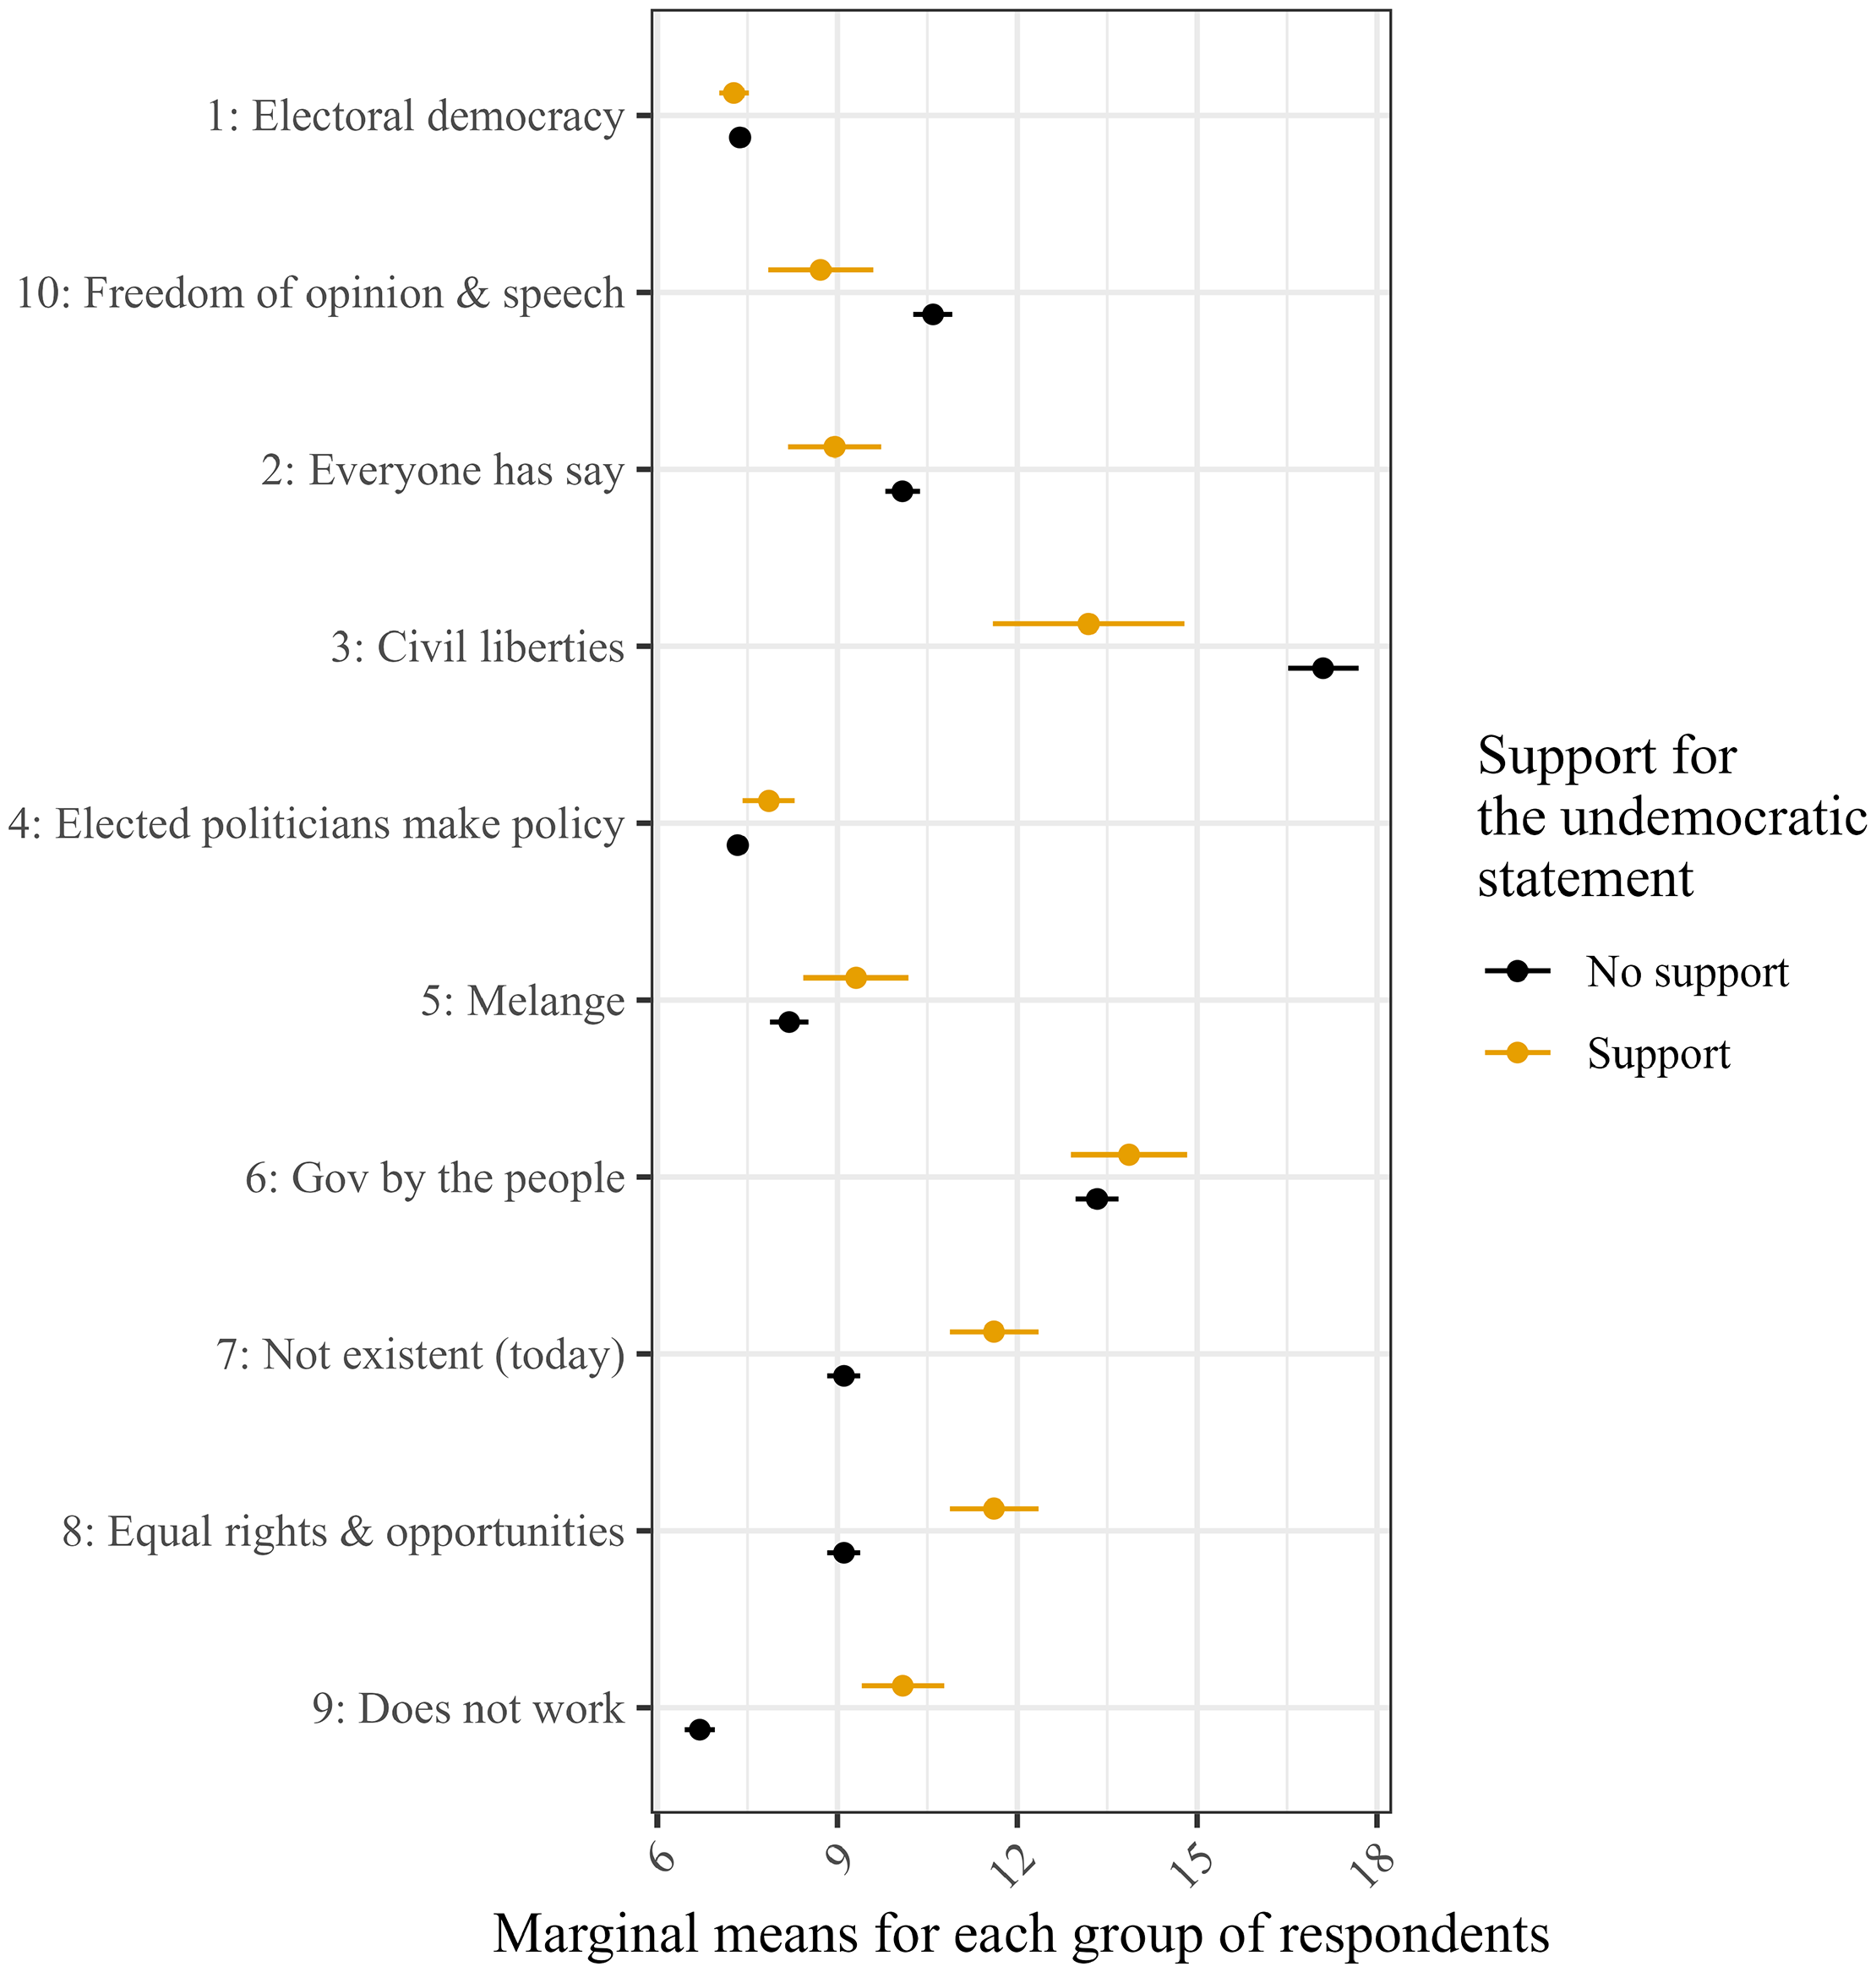
Figure 3. Topic proportions among responses from respondents who support or do not support the undemocratic statement when asked directly. Notes: Marginal means are based on linear regressions of the expected topic proportions for each topic and document on the age, sex, level of education, size of residential locality, political knowledge, and left-right self-placements of respondents, including population weights provided by YouGov.
Summarizing, only a few citizens seem to have specific liberal democratic institutions such as the rule of law, checks and balances, or the separation of powers in mind when they respond to questions about democracy without further qualifications. Although this does not necessarily mean that they would not agree that liberal elements of democracy such as the rule of law are important when directly asked about them, it shows that these are not the elements that citizens think of first when thinking about ‘democracy’. When they state that they support democracy, we cannot take for granted that they mean liberal democracy. What they think about are norms and institutions related to electoral democracy. Footnote 23 Although quantifying the number of citizens with certain understandings of democracy is difficult based on the data that I use, the findings presented in this sub-section lend support to the problem of concept-measurement inconsistency, the problem that citizens’ understandings are quite diverse even within countries and only rarely reflect scientists’ conception of liberal democracy.
Other measurement issues and limitations
Of course, other issues than social desirability and concept-measurement inconsistency might complicate the study of Western Europeans’ democratic attitudes, especially across time, countries and surveys. First and foremost, it might be that citizens have recently changed their democratic attitudes, signaling that democratic attitudes are much more unstable than previously assumed, and that differences found in different studies were merely period effects without strong theoretical implications. Literature on trends in the support for democracy among citizens worldwide do not suggest that levels of support for democracy measured with items similar to the ones discussed here are spurious (see for example Wuttke et al. (Reference Wuttke2020)). Recently published data from wave 10 of the ESS allows us to compare the understandings of democracy of French respondents in 2012 and 2022. Footnote 24 For most items, French respondents have not changed their response behavior between 2012 and 2022. However, they became slightly more likely to state that it is important that the media is free to criticize the government and that parties offer alternatives, and slightly less likely to state that it is important that citizens have the last say through referenda (see Online Appendix F). This does not suggest that citizens’ attitudes toward democracy are spurious or change rapidly over time.
Measurement variance is another issue when asking citizens about their attitudes toward democracy (Ariely and Davidov, Reference Ariely and Davidov2011; Davidov et al., Reference Davidov2014). While measurement equivalence is needed to compare average results from respondents across time and countries (or across groups in general), problems with concept-measurement inconsistency signal that citizens and researchers only rarely have the same thing in mind when thinking about democracy, even if they come from the same country. Nonetheless, the results presented in Figure 2 suggest that measurement variance, too, is an issue. The topic proportions are often-times substantially and significantly different for respondents from different countries. This corroborates findings by Ariely and Davidov (Reference Ariely and Davidov2011) who warrant against comparing levels of support for democracy across countries without further assessments of measurement equivalence.
Furthermore, it might be that our sample, out of bad lack, misrepresents citizens of each of the countries considerably. The sample mirrors the population aged 18 and older as described by the EUROSTAT data from 2011 in each of the countries with regard to age and gender (cross-quotas), educational achievement, and the size of the locality that respondents live in with two exceptions: lower educated citizens are under-represented in France, Italy, and the UK. Citizens from larger cities are over-represented in Germany and Italy, and under-represented in the UK. The cross-country comparison of topics in open-ended responses has taken these differences into account by using population weights provided by YouGov. When weighting the mean support for democracy in each of the countries under study using the same weights, results remain stable, too (see Online Appendix D). Footnote 25
The sample also mirrors data from the Eurobarometer (EB) and the ESS in terms of respondents’ left-right positions (see Online Appendix E). However, especially French respondents in our sample are more likely to report low levels of trust in parties and politicians than French respondents in the EB and the ESS (see Online Appendix E). Vote intentions, too, do not seem to reflect vote intentions in polls conducted during my field period and collected by Europe Elects (europeelects.eu) and Wikipedia. When comparing vote intentions for British, German, and Italian citizens Footnote 26 , supporters of the AfD, the Greens, and the Left, as well as supporters of 5 Stelle and Lega are over-represented. Supporters of other German and Italian parties are under-represented. Supporters of the Scottish National Party are slightly over-represented, while supporters of other larger British parties are under-represented. Re-weighting the average support for democracy in Germany, Italy, and the UK using the support for parties in polling data leads to similar averages across countries; in Germany, 7.51 percent, in Italy, 18.92 percent and in the UK, 7.26 percent of respondents agree with the statement that it would be better if their country would not be a democracy when applying party weights and when asked directly. The drop in support for the undemocratic statement in the UK is driven by a large proportion of respondents who do not support democracy and do not indicate a vote choice (see Online Appendix E), and therefore, data that takes only British party supporters into account is more heavily biased than data presented in the main analysis. Levels of support for democracy therefore do not seem to be strongly affected by this misrepresentation of party supporters. However, the under-representation of center mainstream party supporters in our sample may substantially affect the distribution of understandings of democracy in the data.
Besides measurement and sampling issues, issues could also arise from the usage of data from online panels. The results presented here are based on an online survey, conducted with a random selection of YouGov’s online panelists into the quotas set. While data quality from surveys conducted with different online panels varies substantially across providers (Smith et al., Reference Smith2016), the YouGov panel has been found to be of high quality (Twyman, Reference Twyman2008). Most importantly, panelists were randomly invited to our survey. They could opt-out, but not self-select into it. High-quality online panels have been found to mirror the quality of established surveys such as the ESS (Cornesse and Blom, Reference Cornesse and Blom2020; Revilla, Reference Revilla2012; Revilla et al., Reference Revilla2015), although a professionalization of panelists increases the likelihood to get data from more motivated and engaged respondents (Zhang et al., Reference Zhang2020). For the results presented here, this suggests that respondents might have provided longer responses to the open-ended questions, and might have thought longer about the meaning of democracy than “common” citizens or respondents to surveys not recruiting from panels.
Irrespective of data quality, respondents to self-administrative surveys, including online surveys, have been found to be less prone to report socially desirable responses than respondents to interviewer-administrated surveys (Kreuter et al., Reference Kreuter2009), although some of the differences found might be due to sampling errors across studies (Dodou and de Winter, Reference Dodou and de Winter2014). This suggests that the null findings reported here might not necessarily apply to surveys using face-to-face interviews.
Conclusion
The results presented in this article are promising and worrisome at the same time. First and foremost, researchers using standard survey items referring to “democracy” in general can now be more confident that social desirability is not biasing the responses. However, what citizens have in mind who claim to support democracy are by far not institutions of liberal democracy that are, for example, often the target of studies using survey experiments (Carey et al., Reference Carey2022; Frederiksen, Reference Frederiksen2022; Gidengil et al., Reference Gidengil2021; Graham and Svolik, Reference Graham and Svolik2020; Simonovits et al., Reference Simonovits2022). Furthermore, citizens across countries differ in the way in which they think about democracy, again highlighting issues with measurement variance across countries (Ariely and Davidov, Reference Ariely and Davidov2011).
Although we should not take citizens’ support for “democracy” as evidence that the same citizens support institutions such as the independence of courts or the protection of minority rights, we can take their self-proclaimed support for democracy as evidence for a general support of norms and institutions related to minimal conceptions of electoral democracy. This support might also be the reason why authoritarians today do not openly declare their ‘anti-democraticness’, but frame their attempts at democratic backsliding as democratic, as for example, the USA Republicans did by undermining the credibility of elections as “stolen,” or Orban did by campaigning for “illiberal democracy” rather than for the abolishment of democracy.
Moreover, this study has provided important substantial insights into the extent of Western Europeans’ support for democracy and the variance in their understanding of democracy. Levels of support for democracy are lower in France and Italy than in Germany and the UK. In addition, in none of the countries do citizens mostly think of liberal democracy when they state that they support democracy. Thus, levels of support for democracy seem to rather reflect support for electoral democracy than support for liberal democracy. Assuming that citizens’ support for liberal democracy is vital for electoral and liberal democracies (Almond and Verba, Reference Almond and Verba1963; Easton, Reference Easton1975; Norris, Reference Norris2011), a lack of support for electoral democracy among up to 20 percent of citizens should be worrisome.
When studying citizens’ democratic attitudes, researchers should therefore carefully discuss and think about their own conceptualization of democracy and the extent to which they can expect responses to reflect this conceptualization. When using available data on citizens’ democratic attitudes based on questions referring to democracy in general, we should be careful not to interpret self-reported support for “democracy” as support for specific democratic institutions. Researchers might be able to use answers to more specific questions about citizens’ preferences for institutions such as the ones provided by the ESS wave 6 to control for citizens who claim to support democracy but have a different understanding of democracy than the researcher.
Replication package
Data, materials, and analysis code are available at https://osf.io/wr3kn/.
Supplementary material
The supplementary material for this article can be found at https://doi.org/10.1017/S1755773924000079.
Acknowledgments
This research would not have been possible without the funding of the Fritz Thyssen Foundation and the support of Dominik Duell, Sven-Oliver Proksch, Jonathan Slapin and Christopher Wratil who have given valuable feedback on many occasions. I furthermore want to thank Nils-Christian Bormann, Stefan Stojkovic and the anonymous reviewers, the participants of the Cologne Center for Comparative Politics’s research seminar and the participants of the Elections, Public Opinion and Parties Conference in Glasgow in September 2019 for their helpful comments.
Competing interests
The author declares no competing financial or other interests.


 Open access