


1. Introduction
Many of humanity's practices impose external costs to the environment – whether in affecting soils, water or air quality, or degrading the environment in other ways [Reference Dalin, Wada, Kastner and Puma1–Reference Zhang, Dearing, Dawson, Dong, Yang and Zhang6]. These externalized costs, arising through developing private goods, affect a range of ecosystem services (ES). While ES are often valued – as they provide a range of public goods – they are typically unmonetized and thus unmarketized [Reference Nguyen, Laratte, Guillaume and Hua7]. Payments for ecosystem services (PES) schemes are an attempt to close this loophole, by incentivising actors to avoid benefitting from the devaluation of non-pecuniary public goods.
Since PES programs were devised in the 1990s, and widely implemented in the 2000s [Reference Gómez-Baggethun, de Groot, Lomas and Montes8], we have learned much about what makes them work well to deliver, as a primary goal, sustained benefit streams derived from ES (e.g., [Reference Kemkes, Farley and Koliba9–Reference Engel, Pagiola and Wunder11]). First, there should be one or more beneficiaries willing to pay more for a set of ecosystem service benefits than the opportunity costs to the provider(s) in facilitating them [Reference Engel, Pagiola and Wunder11]. Second, having a monopsony – a single buyer who reaps all the benefits of the service – can eliminate the problem of free-riding and make that willingness to pay clear and transparent, while having a larger number of potential sellers can help to break up the potential for monopoly pricing from the provider [Reference Kemkes, Farley and Koliba9]. Third, when either services or willingness to pay are spread across a large number of providers or buyers (e.g., land managers or farmers), transaction costs can dissipate much of the potential gains from exchange [Reference Goldman, Thompson and Daily12,Reference Jack, Kousky and Sims13], so that intermediaries such as brokers can be critical to enable PES programs to function [Reference Kemkes, Farley and Koliba9]. These intermediaries include extension agencies for smallholder farmers, or water or electric utilities [Reference Farley and Costanza14] for the consumers of drinking water and hydropower. Fourth, when not prohibited by transaction costs, and where poor smallholders are among the key providers, PES programs can provide pathways for poverty alleviation [Reference Jack, Kousky and Sims13], which may be a significant incentive for providers to engage. Where PES programs can be financed by beneficiaries, rather than government or other outside donors [Reference Wunder15], with some degree of permanence [Reference Engel, Pagiola and Wunder11], they are more likely to be sustained [Reference Farley and Costanza14].
However, unsustainable practices are often remarkably resilient to change, because externalizing costs are attractive for two main reasons. First, a lack of transparency – as different services trade-off against each other, and have different impacts at different scales [Reference Bennett, Peterson and Gordon16,Reference German, Thompson and Benton17] – means actors are often unaware of how their actions impact the wider environment. Second, without transparency and without accountability, internalizing the external costs is often prohibitively expensive [Reference Nguyen, Laratte, Guillaume and Hua7]. This can arise through other, competing incentives from markets or public money – for example, privileging cheaper food over ES through subsidizing production. Articulating this ‘lock-in’ within a dynamical systems framework suggests we can view the resilience of unsustainable practices as a stable state within a basin of attraction (Figure 1). While PES schemes have been well-studied in many regards, their potential to encourage transformation of the system from a less sustainable to a more sustainable state is under explored. Transforming the system from an unsustainable, undesirable state to a more sustainable, desirable state is a more fundamental goal than simply maintaining an ecosystem service arising from a system that is fundamentally unsustainable.
Fig. 1. Payments for ecosystem services (PES) can help shift the system from an unsustainable to a sustainable state by reducing ‘lock in’ to the former.
From dynamical systems theory, a basin of attraction describes a locally stable state that is by definition resilient to change. There may be more desirable stable states, but the basin creates lock-in, which makes it difficult for the system to transition. In many cases, the provision of ES benefits to local actors allows the existence of an alternative stable state that is more desirable for long-term sustainability (Figure 1), but which cannot be easily reached because of the local stability of the current basin. From this perspective, PES may serve primarily as a vehicle to lower the barriers preventing a shift of the system between basins of attraction (from a state that undermines ES provision to a state that enhances ES provision) (e.g., [Reference Scheffer, Brock and Westley18]) (Figure 1).
Using PES schemes as a means of transforming the system to create a long-term, stable, systemic shift to a more desirable state is a novel framing of the issue. Kemkes et al. (2010) note the potential for lasting change that can come when the PES program encourages services that are locally valuable to the providers themselves [Reference Kemkes, Farley and Koliba9] (such as where sustainable land management practices to discourage sediment loading also improve local soil and crop conditions [Reference Joshi, Ottaviani and Scialabba19]). Here, we develop a systems dynamical conceptual framework, for using PES to move between basins of attraction; once the shift to a more desirable state has occurred, the need for PES is reduced.
2. Stable states depend on feedbacks: a ‘feedback view’ of PES
For a system to be stable, when it is perturbed, negative feedbacks push the system back to equilibrium. In Figure 1, the feedbacks are represented by the cup: a perturbation pushes the system up the walls of the cup, but the feedbacks roll it back downwards. The key concept is for PES to act to reduce the lip between adjacent basins, such that the system moves to the adjacent basin for long enough that feedbacks can become established to ‘deepen’ the more desirable basin of attraction, in order to make it stable in the absence of PES.
To illustrate this process, we imagine the general problem of a physical landscape that would be better served by a practice (avoiding deforestation, soil conservation, etc) that individuals are (or believe themselves to be) made worse off by adopting (Figure 2A). Risks and costs borne or perceived by land users as they attempt the pro-environmental practice – lost income as forests are left to grow, or yields decline – dissuade adoption in a balancing feedback, so that the absence of the practice in the landscape is a stable state.
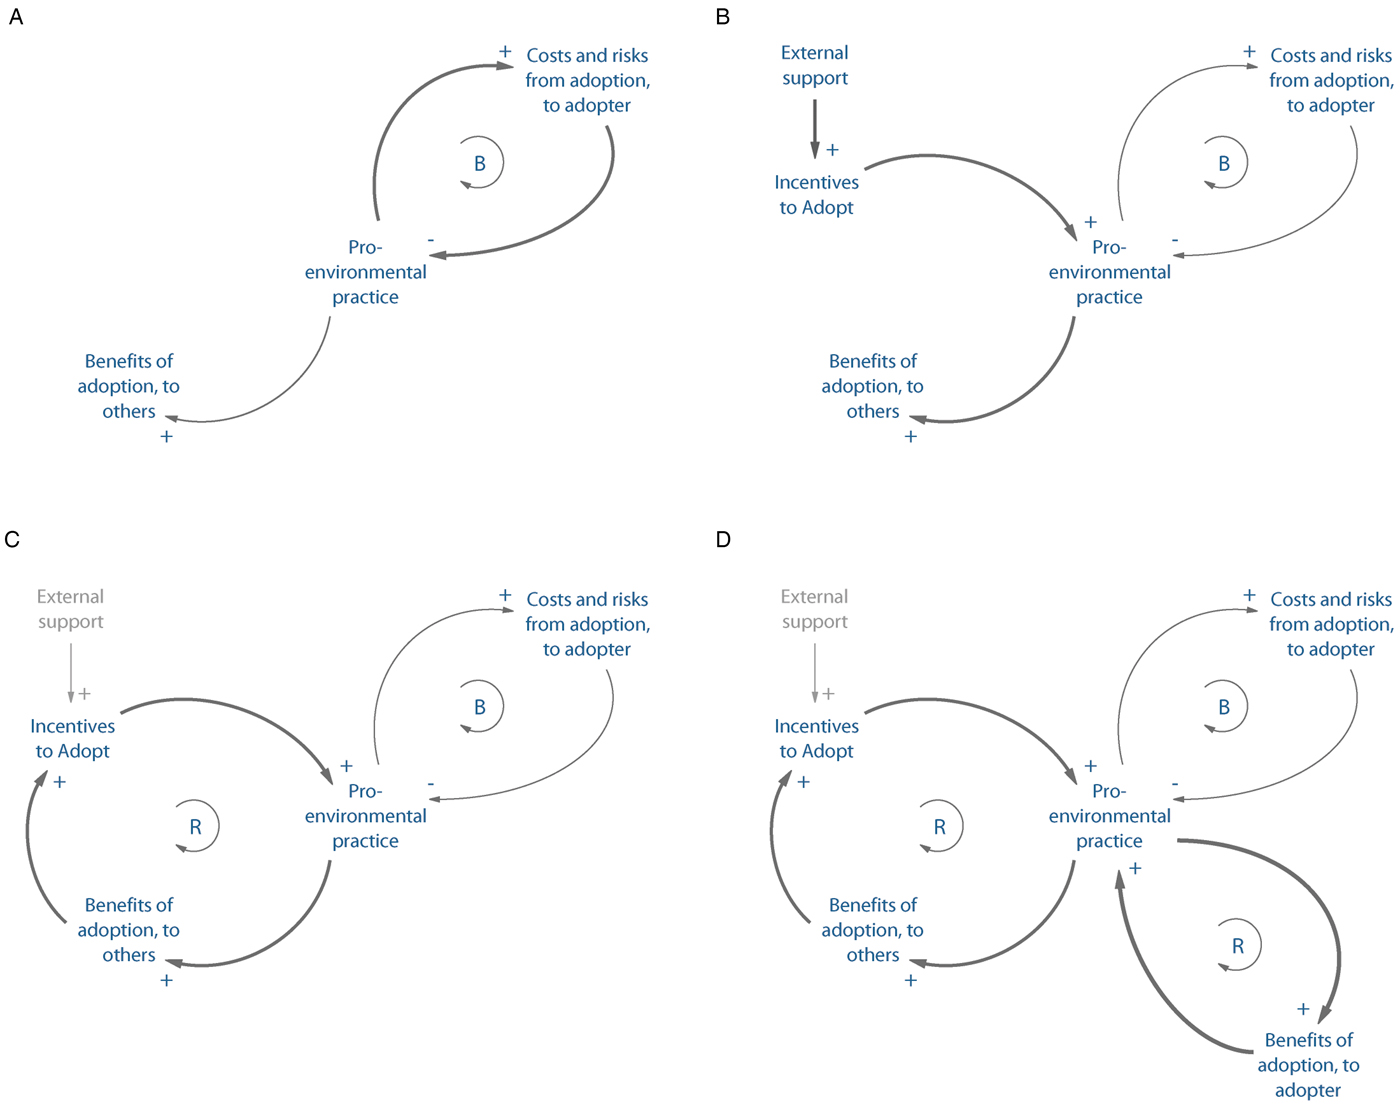
Fig. 2. A feedback model of Payments for ecosystem services (PES) programs, using causal loop diagrams. A) The general problem where actors are better off not adopting pro-environmental behaviour. B) An externally supported PES program, where incentives outweigh the costs and pro-environmental behaviour is adopted. C) A user-supported PES program, where users benefit sufficiently to fund the incentives without external income. D) A user-supported PES program with local private benefits, where both users and adopters directly benefit from the provision of ecosystem services. In all panels, a ‘B’ indicates a balancing feedback loop, and ‘R’ a reinforcing feedback loop. An arrow marked with a ‘+’ sign indicates a direct relationship between system components, while an arrow marked with a ‘-’ sign indicates an inverse relationship. The relative thickness of arrows indicates the expected relative importance of processes in shaping system outcomes.
The most basic opportunity in the PES space to address such problems is the externally supported PES program (Figure 2B). These programs – such as Brazil's Bolsa Floresta Program, in which government and international donor funds support a monthly stipend to families and communities for engaging in non-deforesting activities – are scalable to large areas, but typically lack the efficiency that a market feedback would provide [Reference Pagiola, Glehn and Von Taffarello20].
Where the beneficiaries of the generated ES are able and willing to pay for them, the next opportunity is the user-supported PES program (Figure 2C). While such programs might begin with or benefit to some degree from external support, they exploit a reinforcing feedback by linking beneficiaries’ willingness to pay through to providers’ ability and willingness to act. On its own, this qualitative leap improves the potential permanence of PES outcomes by weakening the role of external support and embedding a market feedback.
This reinforcing feedback has been the focus of much academic work on the design of PES schemes [Reference Engel, Pagiola and Wunder11,Reference Wunder15,Reference Pagiola, Glehn and Von Taffarello20], but there is often much greater potential for developing feedbacks that provide self-reinforcing benefits [Reference Kemkes, Farley and Koliba9]. In particular, where the goals of the PES program stand to directly provide private benefits to the providers themselves, there is greater potential for lasting ES benefits (Figure 2D), which may underpin the stability of the system in a more desirable state. In other words, enhancing the self-reinforcing management feedbacks can transform the system over time, diminishing the importance of risks, costs and even payments themselves in directing system behaviour, and with the actors valuing the transformed state more than the original state. In the terms of Figure 1, such feedbacks deepen the basin of attraction of the alternative state, making it more resilient and more beneficial over the long term.
3. A concrete example
To illustrate the potential for systemic transformation, we focus on the issue of conservation agriculture in a landscape context. Conservation agriculture is a set of land management practices that, while taking various forms across the globe [Reference Scopel, Triomphe, Affholder, Da Silva, Corbeels, Xavier, Lahmar, Recous, Bernoux, Blanchart, De Carvalho Mendes and De Tourdonnet21], typically includes (i) minimal or no tillage of soils; (ii) crop residue mulching or a permanent cover crop; and (iii) intercropping or rotation of legumes. The adoption of conservation agriculture over ‘conventional’ agriculture has short-term costs for farmers (principally in requiring more inputs, and also a reduction in yields). Over time, yields tend to recover as these interrelated practices build more fertile soils that store more carbon, hold more moisture and resist erosion under rainfall, leading to more resilient and sustainable agricultural livelihoods. Thus, while long-term benefits of adoption are clear, the short-term costs of adoption typically act as a barrier, trapping farmers in the less desirable state (Figure 1). In a two-year study in the Shire River Basin Catchment Area in Malawi, we designed and tested a PES scheme that has the potential to allow a systemic transformation, if implemented at scale and as a time-limited investment. Below, we show how we implemented an innovative PES scheme that significantly improved uptake over other PES schemes, and how uptake would create significant benefits for the hydropower sector. As adoption of conservation agriculture (CA) creates benefits for adopters over a 5-year time window, this scheme has the potential to drive systemic transformation through the development of feedback mechanisms (Figure 2D).
4. Study area – The Shire River Basin Catchment Area, Malawi
Our study was conducted in the three most upstream riparian districts to the Shire River in Southern Malawi (Balaka, Machinga and Zomba; Figure 3). Like much of Malawi, farming in this region focuses on maize production, encouraged by the Farm Inputs Subsidy Programme (FISP). Initiated in 2005, the FISP takes up 10–15% of Malawi's national budget through provision of subsidies on fertilizer (a coupon for two 50 kg bags at two-thirds the market price) and free improved seeds to the ‘productive poor’ [Reference Arndt, Pauw and Thurlow22], the approximately 1.5 million smallholders identified as standing to benefit from the program. Though the FISP has included legume seeds since 2008 [Reference Ngwira, Aune and Mkwinda23], a number of studies have found that any gains in maize production come at the expense of crop diversity, squeezing out legume crops for which strong markets do not exist [Reference Chibwana, Fisher and Shively24–Reference Franke, van den Brand and Giller26].

Fig. 3. Study area, showing the Extension Planning Areas (EPAs) chosen as the sampling frame.
Consequently, the FISP re-enforced intensive monocrop maize production, leading to erosion of exposed topsoil, which is a key issue for Malawi and the Shire River Basin region in particular, both for the smallholder livelihoods dependent upon the productive capacity of the soil as well as for its effect on the disruption of rivers’ sediment flow, consequently damaging fisheries and hindering hydropower generation [Reference Bell, Matthews and Zhang27]. To address this problem, the Government of Malawi has, as part of its Agriculture Sector Wide Approach (ASWAp) and the more recent National Agricultural Policy, promoted the adoption of CA [28,29] via such approaches as demonstration plots and improved extension services. These efforts by the government to encourage CA fit into a landscape of CA promotion efforts by other research or civil society organizations (e.g., [Reference Mango, Siziba and Makate30]), yet to our knowledge there have not been widespread efforts to reward CA adoption with individual compensation in the manner by which the FISP encourages the use of fertilizer.
However, the aforementioned linkage from smallholder land use through to hydropower generation – in the Shire Basin and elsewhere – provides a unique opportunity in that smallholders can potentially provide a valuable ecosystem service (avoiding sediment loading to rivers) for which there are direct beneficiaries (electricity consumers) willing to pay. While both of these groups (smallholders and electricity users) are spread widely across Malawi, there are clear ‘brokers’ for each that can facilitate payment from one to the other. On the consumer side, the utility provider ESCOM provides this service implicitly via billing to consumers (which could embed tariffs to pay for sediment management). On the smallholder provider side, extension agencies and input dealers are among the many potential ‘brokers,’ groups with established links to smallholder communities that can reduce the transaction costs that can drown many other similar systems [Reference Jack, Kousky and Sims13]. However ideal the context may be to encourage CA, it is currently practiced sparsely in Malawi (less than 1–2% of cropped land) [Reference Dougill, Whitfield, Stringer, Vincent, Wood, Chinseu, Steward and Mkwambisi31–Reference Ndah, Schuler, Uthes, Zander, Traore, Gama, Nyagumbo, Triomphe, Sieber and Corbeels33], with most topsoil left exposed after harvests, vulnerable to erosion and sedimentation of the Shire River.
5. Methods and analysis
To examine the potential for individual incentives, we evaluated an innovative ‘agglomeration payment’ scheme using a randomized control trial, contrasting a control (no payment) with a standard subsidy (for adopting the three CA practices, no-till, mulching and rotations) or agglomeration payment (a smaller base subsidy plus a bonus payment for each adopting contiguous neighbour) [Reference Parkhurst and Shogren34]. Our control reflects the background level of CA encouragement in the region, such as trainings and field demonstrations from extension officers, while our standard subsidy and agglomeration payment treatments added only the individual incentive, introduced via a basic village-level sensitization exercise and registration period, without any additional training on CA. The standard subsidy was approximately US$ 3 per tenth of an acre, for up to one acre across multiple plots. The agglomeration treatment included a base subsidy (approximately US$ 2.5 per tenth of an acre) plus a bonus payment for every neighbour who also participated in the experiment (about US$ 0.25 per contiguous neighbour, per tenth of an acre, up to a total of four neighbours). These levels were calibrated using a discrete choice experiment (see [Reference Ward, Bell, Parkhurst and Droppelmann35]) to avoid floor and ceiling effects (no adoption and full adoption, respectively), with approximate parity across the treatments assuming participation by two neighbours on average.
We constructed a simple random sample of 60 villages from a pooled list of all villages in the five Extension Planning Areas (EPAs) riparian to the Shire River in Balaka, Machinga and Zomba Districts. Villages were randomly allocated to one of six treatments (eight villages each) or to the control (12 villages). The treatments followed a 2 × 3 design of payment structure and monitoring frequency. Monitoring levels varied from (i) complete (plot visit for all registrants), (ii) partial (plot visit for a half of registrants, selected randomly; in-person follow-up for remaining registrants), to (iii) absent (no plot visits for any participants; in-person follow-up for all registrants). Sensitization and registration efforts were coordinated by the National Smallholder Farmers’ Association of Malawi (NASFAM) and the Department of Land Resources Conservation (DLRC). Survey data collection was conducted by graduate students from Bunda College of the Lilongwe University of Agriculture and Natural Resources (LUANAR). Payments were made in the form of a voucher for agricultural inputs; the voucher program was directed by NASFAM and Agora Ltd (a network of agricultural input depots across southern Malawi), who accepted the voucher as cash and provided mobile shops for remote villages participating in our trial.
The experiment ran from June/July 2014 through to endline data collection in October 2016. Here, we report results from our endline survey. The participants for this were a representative, cluster randomized sample of 30 household heads within 60 villages (n = 30 × 60 = 1800). These data thus reflect land use practices of individuals randomly selected from villages where incentives were available (or not, in the case of control villages), rather than of individuals directly receiving treatment. We did not focus in the current analysis on differences across treatments (i.e., comparisons between standard subsidies and agglomeration payments) but rather, we present a simple analysis of the overall intention-to-treat effect (i.e., the average effect, across all treatments, of the treatment being available) by difference-in-difference comparison against our control, measuring the fraction of cropped area reported as being under CA. This effect is a rough indicator of the costs of encouraging adoption of CA in the region (across a range of program structures), rather than an assessment of any particular program structure. We use this effect, along with cost data from our project and secondary data on erosion rates under CA, to estimate the cost of avoiding sediment loading to surface water via sustainable land management, and compare it to current reported costs of sediment management faced by the hydropower provider ESCOM. Finally, we examine adoption of CA at the plot level within our endline sample using a probit analysis, and note the key predictors of adoption within both our treatment and control.
6. Results
6.1. Effectiveness of PES at driving adoption
Our large-scale study allows detailed analysis of the factors that shape whether a farmer would practice CA on a given plot (Table S1). Principal results are that (i) incentives to the respondent increased adoption, but (ii) whether their neighbours had adopted had an impact of similar magnitude (their coefficients are not significantly different, using Wald tests with a 5% probability of Type I error). Importantly for the eventual diffusion of CA to scale, the influence of neighbours on adoption was also observed for the practices of zero-tillage and mulching in our control. Finally, (iii) the availability of an incentive served to amplify discriminating factors in farmers thinking through the decision to adopt. For example, knowledge about CA practices from extension agents, along with perceptions that adopting the practices of zero tillage or intercropping would reduce overall risks of crop loss, all increase the likelihood of adoption of CA, with these factors explaining much more variation across adopters and non-adopters in the treatment villages than in the control villages.
On average across various treatments, our PES scheme increases adoption rates for CA at 170% above control. In absolute terms, our intervention – which entailed no extension or CA promotional activities – was responsible for CA on an additional 7% of cropped land across our villages (Table 1). CA adoption for Malawi is known to be low [Reference Brown, Nuberg and Llewellyn32,Reference Ndah, Schuler, Uthes, Zander, Traore, Gama, Nyagumbo, Triomphe, Sieber and Corbeels33] and our incentive scheme is highly successful in this context.
Table 1. Reported fraction of cropped area under conservation agriculture in Endline Survey

6.2 The economics of siltation avoided
We construct a simple model for the cost of avoided sediment as follows. CA is known to reduce soil and sediment loss by around 65% [Reference Araya, Cornelis, Nyssen, Govaerts, Bauer, Gebreegziabher, Oicha, Raes, Sayre, Haile and Deckers36,Reference Mchunu, Lorentz, Jewitt, Manson and Chaplot37]. We assume that topsoil lost from fields would eventually make its way to rivers. Benefits from CA to the farmer can take several years to accrue [Reference Corbeels, de Graaff, Ndah, Penot, Baudron, Naudin, Andrieu, Chirat, Schuler, Nyagumbo, Rusinamhodzi, Traore, Mzoba and Adolwa38], and we assume that farmers would require 3–5 years of encouragement before they would stick with CA on their own. From these assumptions and knowing the costs in our experiment (approximately US$ 30,000 across treatment villages), we obtain an estimate of the direct costs of avoiding sediment loading to be approximately US$ 7 per ton.
This estimate is, of course, sensitive to assumptions made (Appendix). If we assume that payments would need to be made in perpetuity, this cost rises to around US$ 20 per ton; if we further assume that indirect costs (monitoring, logistics, etc) are identical (per unit area) with those in our small-scale research study (and so no economies of scale), costs rise to US$ 200 per ton. Acknowledging that not all areas pose the same risks to surface water, and assuming that only 50, 25 or 10% of eroded sediment reaches the river system raises these worst-case estimates to near US$ 400, 800 and 2000 per ton, respectively.
7. Discussion
Many of the ecological and environmental challenges of our time require a systemic transformation from a ‘business as usual’ state, where environments are degraded, to a more desirable state where human–environment interactions are managed more sustainably. However, due to a variety of lock-ins, business as usual is often highly robust to change. Our concept here is that PES schemes have the unrecognized potential to act to disrupt the lock-ins and incentivize transformation. Our field study provides the logic. A rapid adoption of CA would quickly provide reduction in siltation rate. Adoption rates suggest that if the scheme was scaled up, it would drive a significant reduction in the amount of soil lost from fields that ends up blocking rivers and hydropower schemes. If the electricity provider ESCOM ran the scheme, we estimate that it should cost between US$ 7 and US$ 2000 per ton of sediment avoided. Importantly for comparison, ESCOM estimates its own costs of sediment management (which involve equipment rental, dredging and scheduled shutdowns) on the order of US$ 150,000 per ton of sediment over the last year as of the time of writing [39]. Under even our most conservative assumptions, the cost of avoiding sedimentation in the first place by encouraging CA as a land management practice is orders of magnitude lower than costs currently being borne by ESCOM. Even when considering the transaction costs that might be necessary for this type of scheme to be operationalized, Figure 2C is a realistic representation of the conditions that could occur soon after a roll-out of the scheme at scale.
Conceptually, this provides the grounds for the systemic transformation shown between Figure 2C and Figure 2D. As the scheme matures, over a 3- to 5-year period, self-reinforcing benefits are predicted to emerge to lock the system into the more sustainable state. Clearly, ESCOM would benefit from lower siltation, but over time, adopters would also increasingly benefit for two reasons, both self-reinforcing. Firstly, the improvement in soil structure over progressive seasons reduces input needs and potentially boosts yields [Reference Pannell, Llewellyn and Corbeels40] (R2 in Figure 4); at the same time, it reduces the risks and costs that inhibit adoption (R3 in Figure 4) – nutrient immobilization, hard pans, pest outbreaks in residues and waterlogging, among others [Reference Ward, Bell, Parkhurst and Droppelmann35,Reference Pannell, Marshall, Barr, Curtis, Vanclay and Wilkinson41]. Second, peer effects imply that the additional incentive required to encourage new adopters is less and less important as conservation agriculture fills the landscape, and observations of (or suggestion from) neighbours reshapes attitudes about the practice (R4 in Figure 4).
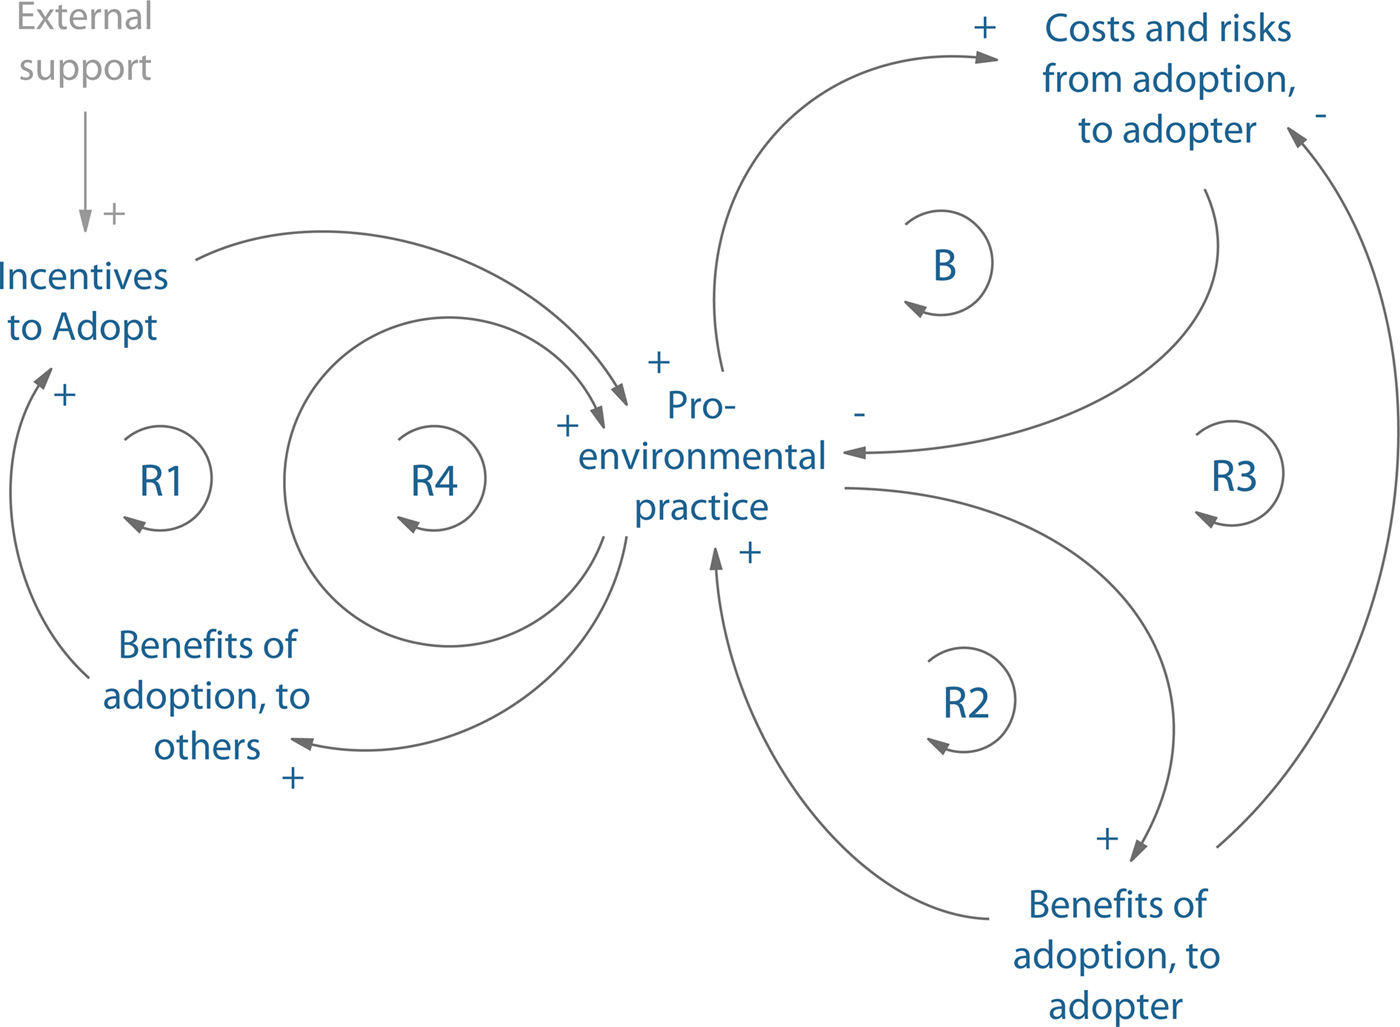
Fig. 4. Payments for ecosystem services (PES) program potential for the Shire River Basin.
Referring back to the ball and cup analogy of Figure 1, the PES scheme initially removes the ‘lip’ allowing the ball to roll from the undesirable state into the desirable one, and then as reinforcing feedback loops emerge and benefits accrue, the desirable basin deepens, making the desirable state more stable. In this system there is potential to take advantage of four different reinforcing feedbacks. Over time, the scale of payments required in R1 may abate, so that spending in the PES program is more akin to building equity, and paying a mortgage, than it is to making regular payments as in a rental agreement. It may be possible to reach an endpoint where additional risks to farmers from practicing CA are negligible, payments are not required, and the private benefits of CA are sufficient to self-reinforce practice.
The potential for such longer-term feedbacks exists in any system where, as Kemkes et al. (2010) describe, the requirements of the PES program lead to provisioning of services that themselves are locally valuable to the providers [Reference Kemkes, Farley and Koliba9]. This should be broadly true for sustainable land management initiatives such as ours, where improved soil management offers benefits to agricultural livelihoods. Pagiola et al. (2016) evaluated land use in a Colombian region several years after a PES program to encourage new silvopastoral practices (such as planting shrubs and trees within pastures) had ended and found the practices still in place, with the authors suggesting that “by reducing the initial costs of adoption and providing some income in the period before silvopastoral practices begin to generate sufficient benefits to be profitable, the payments ‘tipped the balance’ towards adoption.” [Reference Pagiola, Honey-Rosés and Freire-González42]. It may also apply to PES programs where the requirement is to ‘abstain’ rather than ‘do,’, though Börner et al. (2017) note in their recent review of PES effectiveness that to their knowledge, no comparable evaluation to that of Pagiola et al. (2016) yet exists for this form of avoided ecosystem service loss problem [Reference Börner, Baylis, Corbera, Ezzine-de-Blas, Honey-Rosés, Persson and Wunder43]. They call for greater empirical study of long-term permanence in gains across all forms of PES program but note that in avoided ES loss cases, they “would, all else being equal, not expect permanence without payment” [Reference Börner, Baylis, Corbera, Ezzine-de-Blas, Honey-Rosés, Persson and Wunder43]. Our framework suggests that, in instances where payments to refrain from deforestation enhance locally valuable regulatory services such as precipitation or provisioning services such as non-timber forest products, gains in avoided deforestation or afforestation might persist past the end of payments, but acknowledge that this requires these services to be valued (or at least recognized) in a way they had not been previously. It may be that stable, desirable basins of attractions are more closely associated with ‘do’ PES programs than ‘abstain’ programs, but we agree with Börner et al. (2017) that greater empirical efforts at evaluation must be made.
This paper puts forward a conceptual framework for thinking about PES programs as levers to effect systemic transformation. There is much discussion in the literature about the unsustainability of many management practices for land, water and air [Reference Dalin, Wada, Kastner and Puma1,Reference Graves, Morris, Deeks, Rickson, Kibblewhite, Harris, Farewell and Truckle2,Reference DeFries and Rosenzweig44–Reference Hoekstra and Wiedmann46]. At the same time, there is significant literature about the need to make human systems resilient to perturbations, using resilience as a positive, normative, concept [Reference Bullock, Dhanjal-Adams, Milne, Oliver, Todman, Whitmore and Pywell47–Reference Jarvie, Sharpley, Flaten, Kleinman, Jenkins and Simmons50]. Here we frame conventional management practices as building a ‘wrong sort of resilience,’ locking agricultural systems in to an undesirable state. In such cases, we need to reduce the resilience to allow the system transformation to a more desirable state. We indicate that time-limited PES schemes have the ability to effect this transformation. Once transformed, the ‘right sort’ of resilience can emerge as the self-reinforcing feedback loops develop, thereby allowing the withdrawal of the incentive scheme.
This idea brings a new perspective to an argument that took place in the journal Conservation Letters several years ago about the role of PES programs in tackling conservation challenges. Muradian et al. (2013) argued that making payments risked disrupting other intrinsic motivations for conservation, could lead to spiraling compensation costs as the opportunity cost of conservation rose, and was in many cases a distraction from careful rule-making to address the problem [Reference Muradian, Arsel, Pellegrini, Adaman, Aguilar, Agarwal, Corbera, Ezzine de Blas, Farley, Froger, Garcia-Frapolli, Gómez-Baggethun, Gowdy, Kosoy, Le Coq, Leroy, May, Méral, Mibielli, Norgaard, Ozkaynak, Pascual, Pengue, Perez, Pesche, Pirard, Ramos-Martin, Rival, Saenz, Van Hecken, Vatn, Vira and Urama51]. Responding to these claims, Wunder (2013) laid out a comprehensive accounting of the economic, cultural and institutional preconditions that can make PES an effective conservation tool [Reference Wunder52]. Notably among these, Wunder emphasizes that benefits should exceed the marginal cost of service provision. We argue that this focus on benefits at the margin, appearing regularly in the literature on PES programs (e.g., [Reference Kemkes, Farley and Koliba9,Reference Engel, Pagiola and Wunder11]) misses the system-level benefits that are possible when payments are calibrated not to just cover costs but to help tip systems into more productive and/or sustainable basins of attraction, and we develop a systems framework for PES-driven conservation to demonstrate.
While PES-for-systems-transformation is conceptually feasible, building an evidence base to support it requires long-term research efforts and, importantly, sustained commitments from donors and implementing stakeholders. The findings here are limited in the way of many studies linking ES to poverty and behavioural change – the shorter-term structure of most research projects (3–4 years, with 1–3 years of data collection) provides an insufficient window into the system of interest to observe progress along an ES or poverty alleviation pathway, especially one seeking a non-linear transformation. This window will not capture the emergence of private benefits from CA as soil structure improves (4–8 years), nor shifts in adoption along the dry–wet cycle of an El Niño Southern Oscillation (3–7 years). While long-term projects supported by repeated rounds of funding are not unheard of, they are not common enough for long-term studies of ecosystem-based poverty reduction to shape the scientific literature, which reinforces a bias towards linear, incremental thinking, in a non-linear world [Reference Benton, Fairweather, Graves, Harris, Jones, Lenton, Norman, O'Riordan, Pope and Tiffin53]. Finding mechanisms to reshape project funding to an ecosystems timescale (~8–10 years) will greatly benefit analysis of system behaviour such as that presented here.
Supplementary material
To view supplementary material for this article, please visit https://doi.org/10.1017/sus.2018.4
Acknowledgments
The authors gratefully acknowledge logistical support for this project's activities provided tirelessly by the staff of IFPRI Malawi, and Mr Zephania Nyirenda for his supervision of data collection activities in the field.
Author contributions
A. R. B., P. S. W., K. D., T. G. B. and L. M. designed the study. L. M. led data collection activities. A. R. B. performed analyses. A. R. B., T. G. B., O. P., K. D., L. M. and P. S. W. wrote the article.
Financial support
This work is part of the project entitled Agglomeration Payments for Catchment Conservation in Malawi–NE/L001624/1, which is partly funded with support from the Ecosystem Services for Poverty Alleviation (ESPA) program. The ESPA program is funded by the Department for International Development, the Economic and Social Research Council and the Natural Environment Research Council. This work was further supported through a grant from the Feed the Future Innovation Lab for Collaborative Research on Assets and Market Access, funded by the United States Agency for International Development. Additional support was provided by the CGIAR Research Program on Policies, Institutions and Markets (PIM), led by IFPRI.
Conflict of interest
None.
Ethical standards
The authors assert that all procedures contributing to this work comply with the ethical standards of the relevant national and institutional committees on human experimentation and with the Helsinki Declaration of 1975, as revised in 2008.


 Open access