1. Introduction
It is well known that stimulated Brillouin scattering (SBS) and stimulated Raman scattering SRS are two kinds of parametric instabilities in laser–plasma interaction (LPI) of inertial confinement fusion (ICF)[Reference Baldis, Montgomery, Moody, Labaune, Batha, Estabrook, Berger and Kruer1], which will increase with the growth of laser power density[Reference MacGowan, Afeyan, Back, Berger, Bonnaud, Casanova, Cohen, Desenne, DuBois, Dulieu, Estabrook, Fernandez, Glenzer, Hinkel, Kaiser, Kalantar, Kauffman, Kirkwood, Kruer, Langdon, Lasinski, Montgomery, Moody, Munro, Powers, Rose, Rousseaux, Turner, Wilde, Wilks and Williams2–Reference Froula, Divol, London, Michel, Berger, Meezan, Neumayer, Ross, Wallace and Glenzer5]. They will induce the loss of driving laser energy. SRS also produces the super hot electrons, which reduce the laser absorption efficiency[Reference Wang, Liu, Wang, Jiang, Kuang, Li, Jiang, Liu and Tang6–Reference Meezan, Atherton, Callahan, Dewald, Dixit, Dzenitis, Edwards, Haynam, Hinkel, Jones, Landen, London, Michel, Moody, Milovich, Schneider, Thomas, Town, Warrick, Weber, Kidmann, Glenzer, Suter, MacGowan, Kline, Kyrala and Nikroo9]. Previous studies have shown that SBS and SRS are restrained effectively after application of beam-smoothing technology[Reference Jiang and Lin10–Reference Lindl, Amendt, Berger, Glendinning, Glenzer, Haan, Kauffman, Landen and Suter13], but recent experimental results on NIF revealed a much higher SBS and SRS than expected[Reference Meezan, Atherton, Callahan, Dewald, Dixit, Dzenitis, Edwards, Haynam, Hinkel, Jones, Landen, London, Michel, Moody, Milovich, Schneider, Thomas, Town, Warrick, Weber, Widmann, Glenzer, Suter, MacGowan, Kline, Kyrala and Nikroo14,Reference Meezan, Atherton, Callahan, Dewald, Dixit, Dzenitis, Edwards, Haynam, Hinkel, Jones, Landen, London, Michel, Moody, Milovich, Schneider, Thomas, Town, Warrick, Weber, Widmann, Glenzer, Suter, MacGowan, Kline, Kyrala and Nikroo15] . A possible reason is that the interference between incident beams results in a spatial non-uniform distribution of the laser intensity (although each beam has a uniform distribution by beam smoothing), and then induces the obvious growth of SBS and SRS. Based on above point of view, this paper represents the measurement results of the backscatter of SBS and SRS from an Au plate target irradiated by two laser beams from the SG-II facility, and they are respective to the illuminated conditions of different coherent degrees between the two incident laser beams.
2. Experimental condition and setup
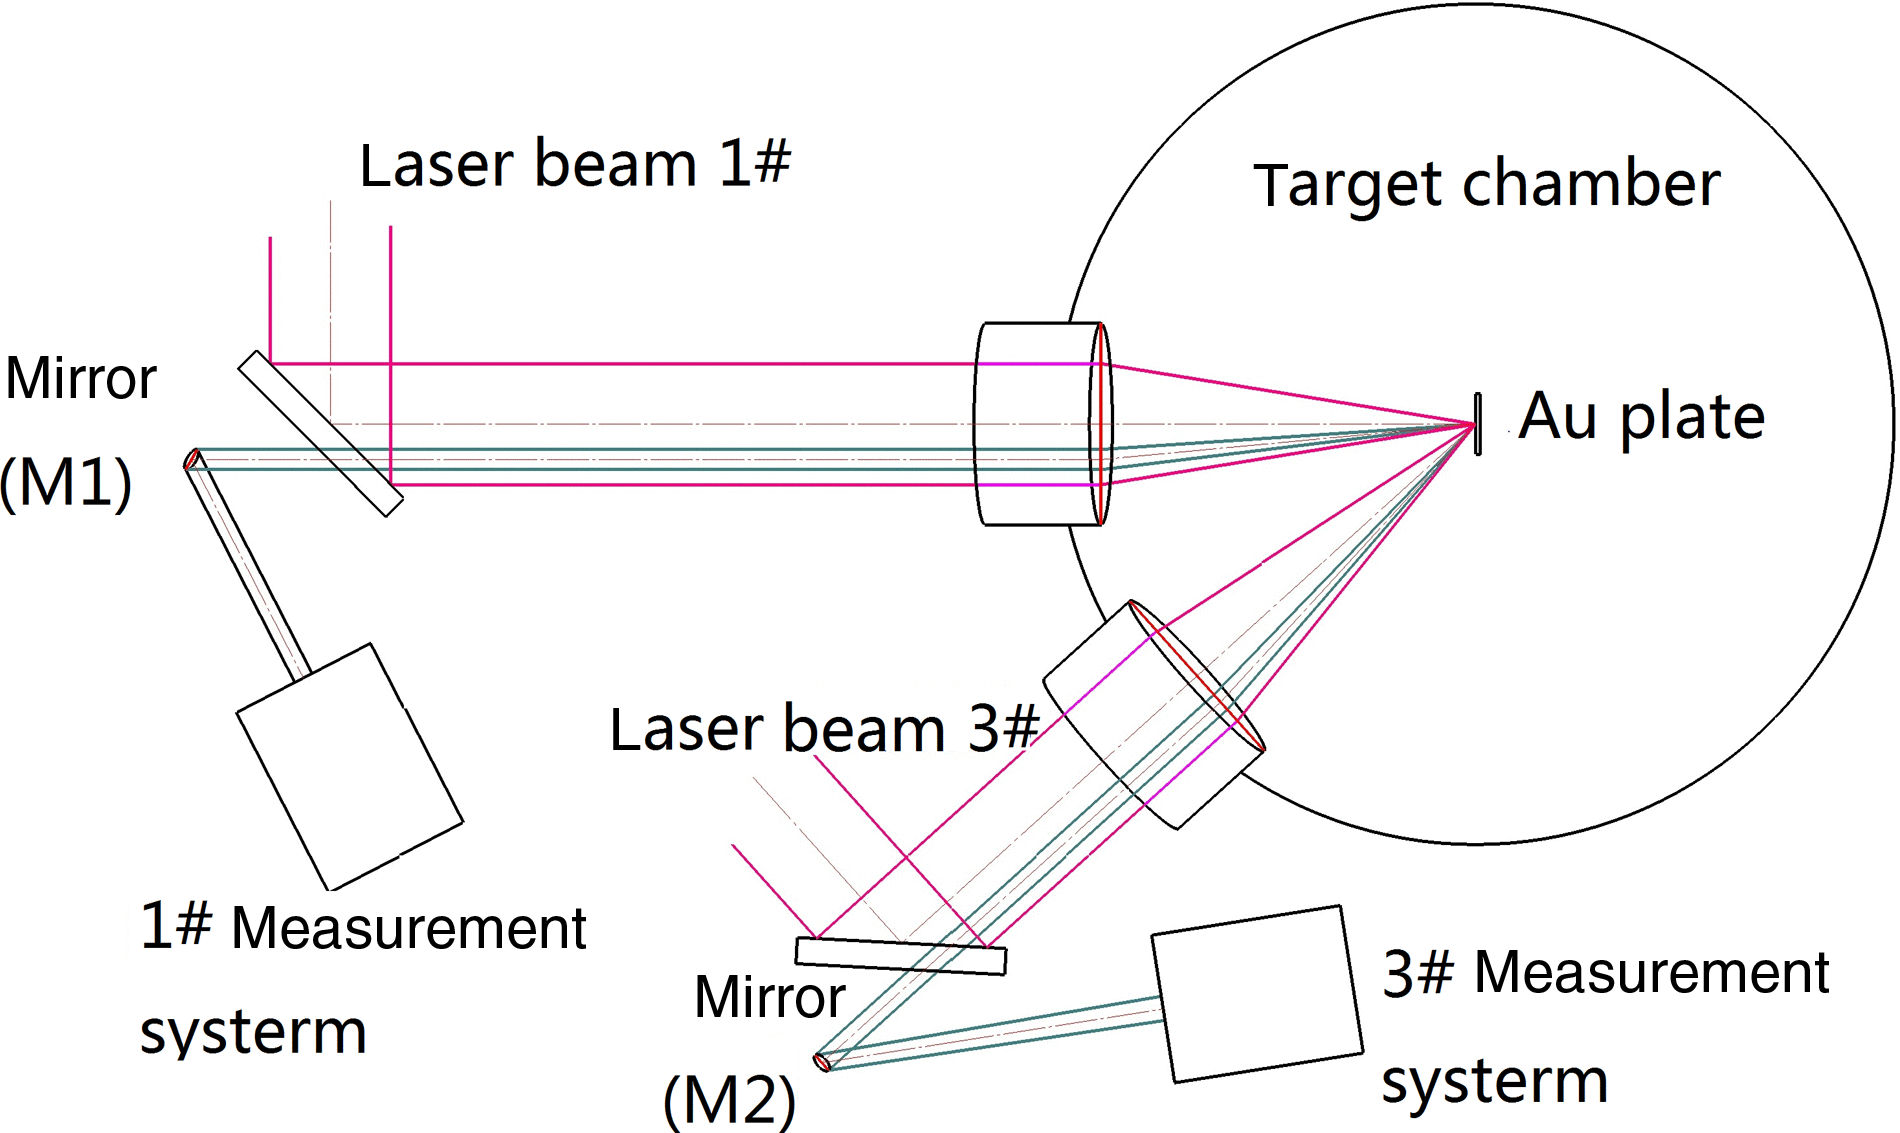
The experiment was carried out on the SG-II laser facility; Figure 1 is an illustration of the experimental setup. Two laser beams (beam 1# and 3#, ![]() ${\sim }1~\mathrm{ns} $,
${\sim }1~\mathrm{ns} $, ![]() ${\sim }250~\mathrm{J} , 527~\mathrm{nm} $ in each one), with an angle of
${\sim }250~\mathrm{J} , 527~\mathrm{nm} $ in each one), with an angle of ![]() $42{{}^\circ} $ between them, were employed to irradiate an Au plate target (thickness of
$42{{}^\circ} $ between them, were employed to irradiate an Au plate target (thickness of ![]() $6. 17~\unicode[.5,0][STIXGeneral,Times]{x03BC} \mathrm{m} $); beam 1# was perpendicular to the target’s surface, and the diameter of the focal spot was about
$6. 17~\unicode[.5,0][STIXGeneral,Times]{x03BC} \mathrm{m} $); beam 1# was perpendicular to the target’s surface, and the diameter of the focal spot was about ![]() $120~\unicode[.5,0][STIXGeneral,Times]{x03BC} \mathrm{m} $. Due to change-regard of the backscatter along with different coherence between the incident laser beams, a measure of partial and relative backscatter is enough. So the backscatter of SRS and SBS in the given solid angle was obtained by sampling in a small aperture during the experiment. Two sampling mirrors (M1 and M2 shown in Figures 1 and 2) with diameter 25 mm and reflectivity of 95% in the wavelength range
$120~\unicode[.5,0][STIXGeneral,Times]{x03BC} \mathrm{m} $. Due to change-regard of the backscatter along with different coherence between the incident laser beams, a measure of partial and relative backscatter is enough. So the backscatter of SRS and SBS in the given solid angle was obtained by sampling in a small aperture during the experiment. Two sampling mirrors (M1 and M2 shown in Figures 1 and 2) with diameter 25 mm and reflectivity of 95% in the wavelength range ![]() $400{\unicode{x2013}} 1000~\mathrm{nm} $ were used to collect a part of the backscatter from beam 1# and beam 3#, respectively.
$400{\unicode{x2013}} 1000~\mathrm{nm} $ were used to collect a part of the backscatter from beam 1# and beam 3#, respectively.

Figure 1. Illustration of the experimental setup.
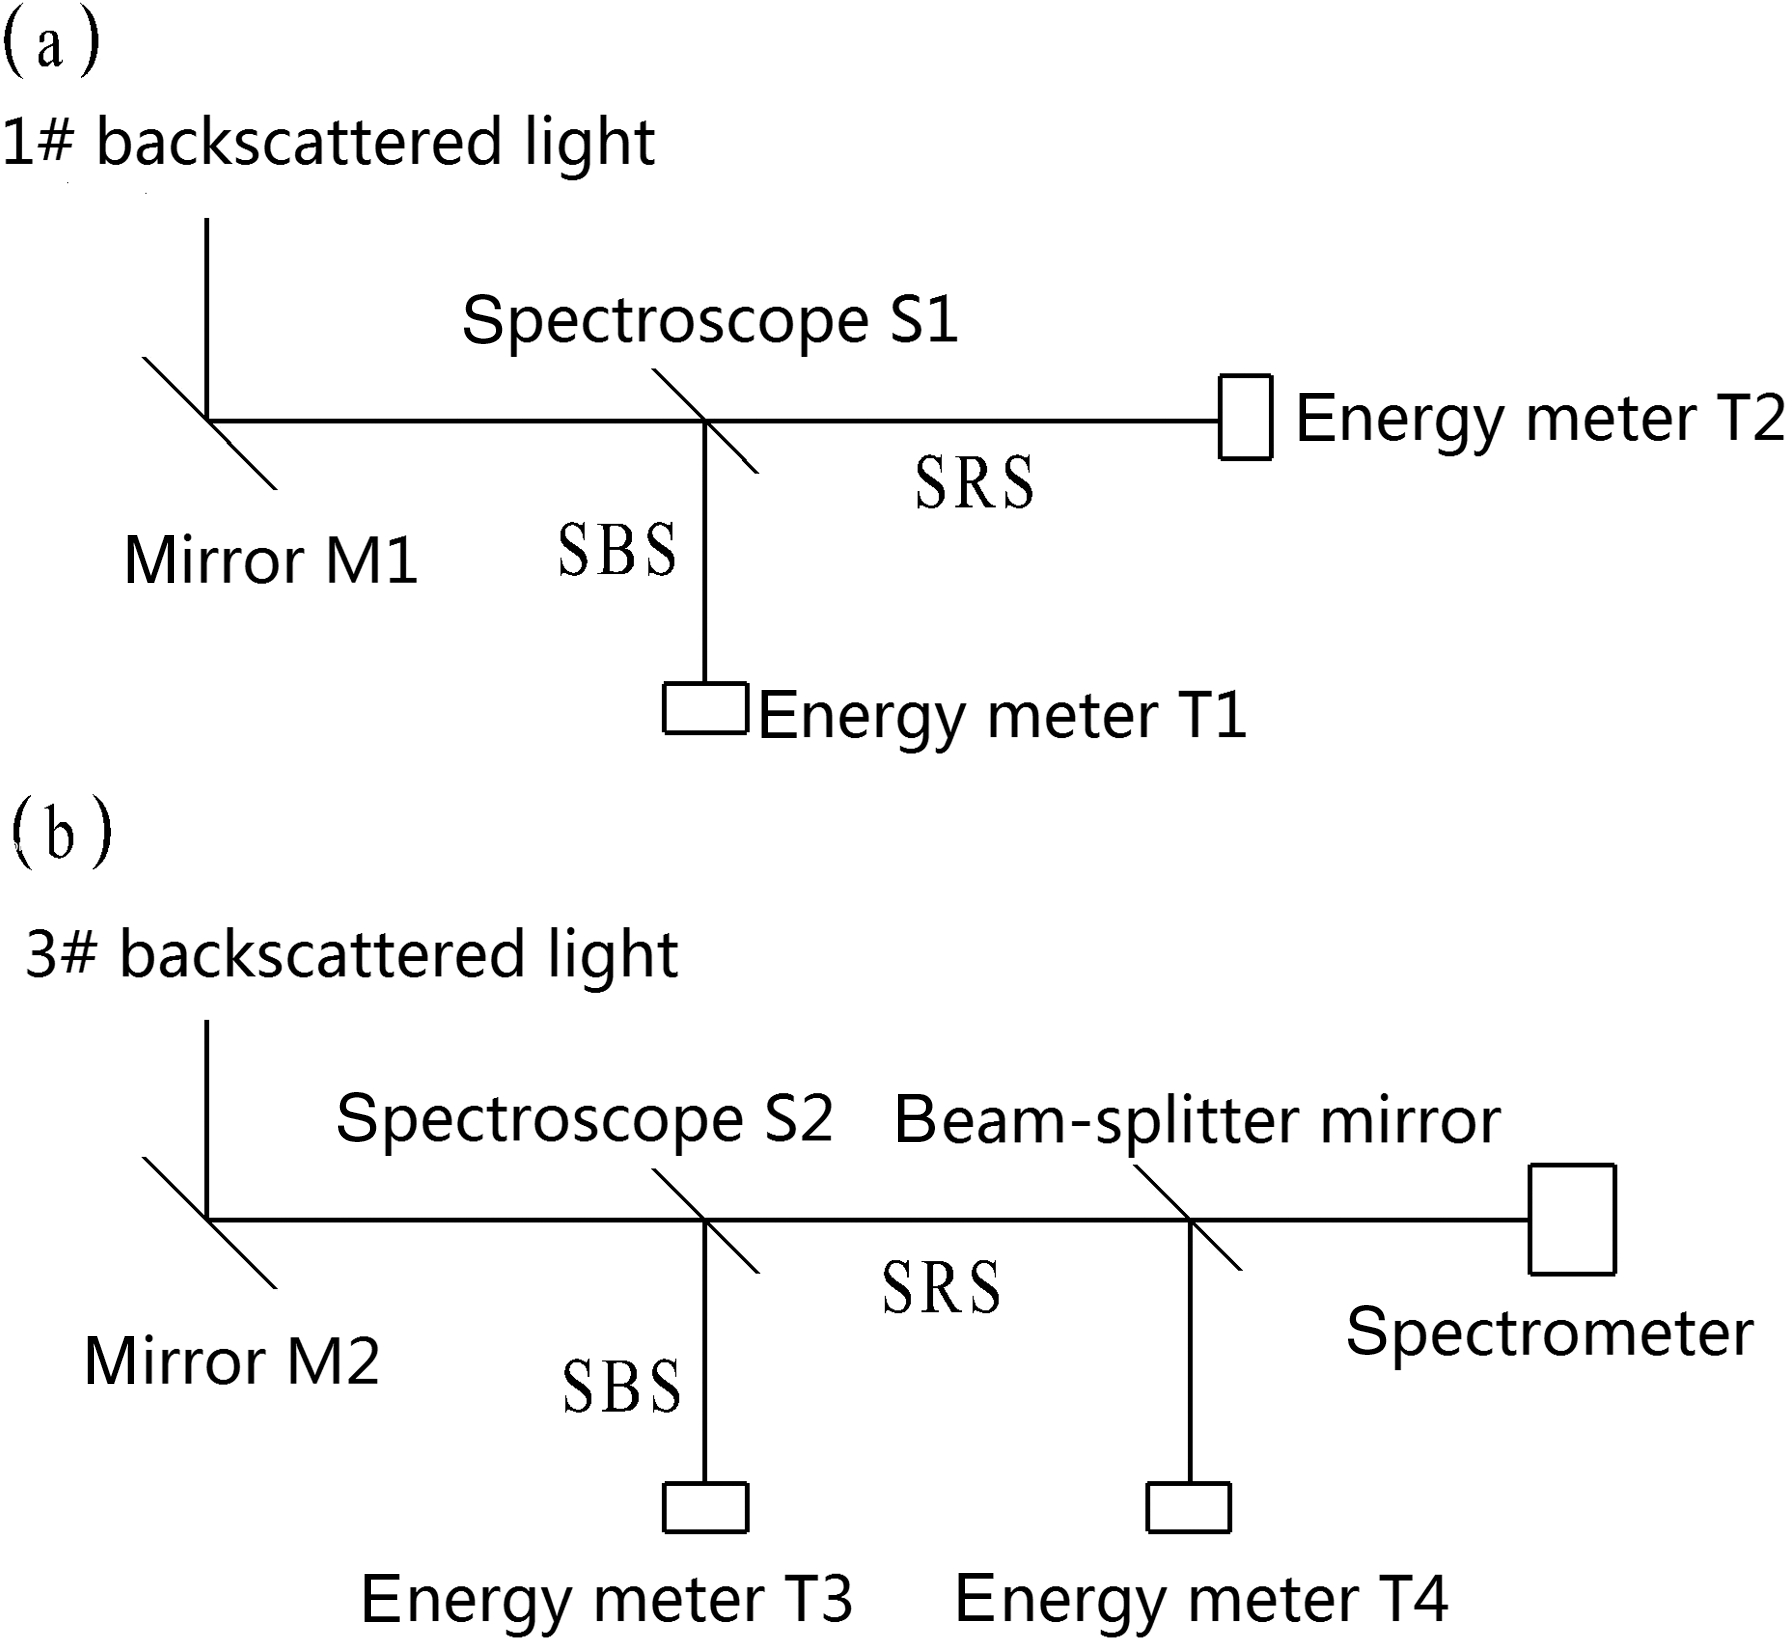
Because the wavelengths of SBS and SRS are very different (the former is similar to the wavelength (527 nm) of the incident laser, while the latter has a broad band (covers 1–2 times the wavelength of the incident laser)), with peak wavelength near 800 nm, it is feasible to separate the backscatter of SBS and SRS by a spectroscope. Figure 2a and b show the measurement system. The spectroscopes S1 and S2 have the same characteristics: their transmissibility in the wavelength range ![]() $600{\unicode{x2013}} 1000~\mathrm{nm} $ is better than 98%, except their reflectivity is over 99% at the wavelength of 527 nm. The partial backscatter (sampled by M1) from laser beam 1# was separated into SBS and SRS by S1, then recorded by energy meters T1 and T2, respectively (see Figure 2(a)). For the partial backscatter (sampled by M2) from laser beam 3#, its SRS was also divided into two parts by a piece of the beam-splitter mirror: one went into energy meter T4, and the other was recorded by a spectrometer so as to give a spectrum-intensity distribution of SRS.
$600{\unicode{x2013}} 1000~\mathrm{nm} $ is better than 98%, except their reflectivity is over 99% at the wavelength of 527 nm. The partial backscatter (sampled by M1) from laser beam 1# was separated into SBS and SRS by S1, then recorded by energy meters T1 and T2, respectively (see Figure 2(a)). For the partial backscatter (sampled by M2) from laser beam 3#, its SRS was also divided into two parts by a piece of the beam-splitter mirror: one went into energy meter T4, and the other was recorded by a spectrometer so as to give a spectrum-intensity distribution of SRS.

Figure 2. Illustration of the measurement system. (a) for beam 1#, (b) for beam 3#.
In order to study the influence of the coherent condition on backscatter in our experiment, the key is to form different coherent degrees between the incident beams. Fortunately, the driving laser beams 1# and 3# are all well polarized linearly, so it is possible to achieve different coherence degrees between them by altering their polarization directions. In fact, it was realized by rotating the frequency doubling crystal. The frequency doubling efficiency of the crystal remains as it rotates ![]() $90{{}^\circ} $, but the polarization direction of the driving laser appears a quarter turn.
$90{{}^\circ} $, but the polarization direction of the driving laser appears a quarter turn.
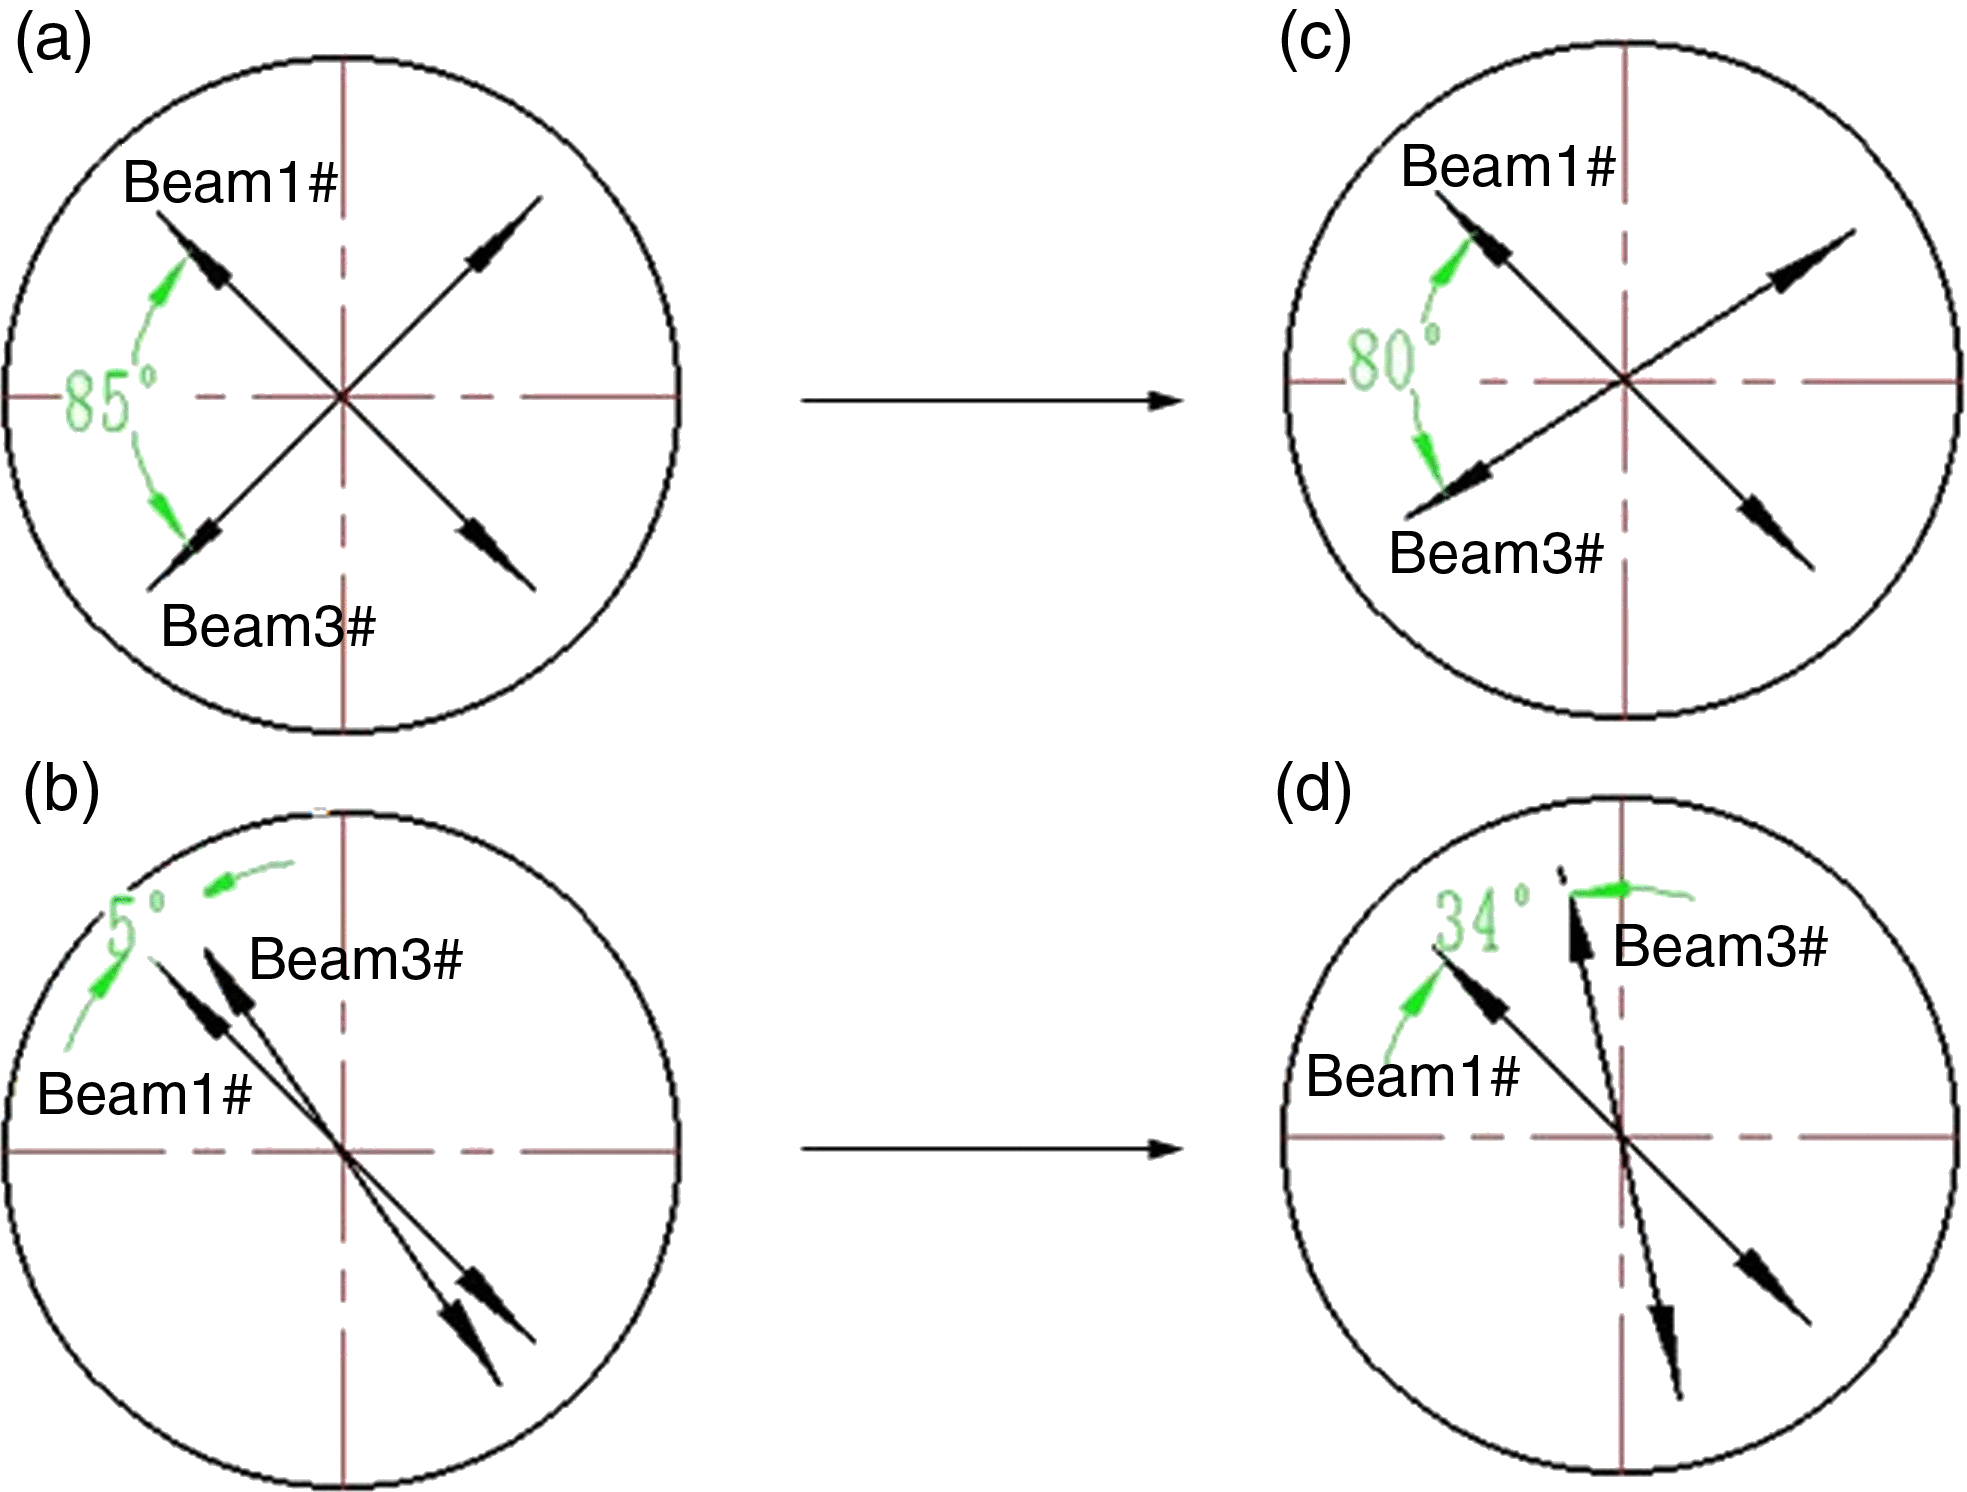
Figure 3 gives two conditions about the polarization direction in this experiment; parts (a) and (b) illustrate their polarization directions (85° and 5° between them) on the view of respective propagating directions of laser beams 1# and 3#. Considering the different incident angles of beams 1# and 3# relative to the target’s surface (see Figure 1), the real angles between the polarization directions of laser beams 1# and 3# in the plane of the target’s surface are ![]() $\theta = 80$ and 34°, shown in Figure 3(c) and d, respectively. According to the double-beam interference theory, the fringe contrast is expressed as
$\theta = 80$ and 34°, shown in Figure 3(c) and d, respectively. According to the double-beam interference theory, the fringe contrast is expressed as ![]() $\gamma = \cos (\theta )$, and this means that he coherent degree can be characterized by
$\gamma = \cos (\theta )$, and this means that he coherent degree can be characterized by ![]() $\gamma $. For Figure 3(c) and d,
$\gamma $. For Figure 3(c) and d, ![]() $\gamma = 0. 17$ and 0.83, respectively.
$\gamma = 0. 17$ and 0.83, respectively.

Figure 3. The polarization directions of two incident beams. (a) & (b): view from propagating direction of each laser beam; (c) & (d): view on the plane of target’s surface.
3. Experimental results and analysis
Table 1 gives the counts from T1, T2, T3, and T4 under two different coherent conditions, which are used to characterize the backscatter’s energy of SBS and SRS. Owing to the different incident angles, and also the different number and parameters of components for beam 1# and beam 3#, there is not comparability among the data from different ![]() ${T}_{i} ~(i= 1, 2, 3, 4)$, but there is from the same
${T}_{i} ~(i= 1, 2, 3, 4)$, but there is from the same ![]() ${T}_{i} $. By comparing the counts from the same
${T}_{i} $. By comparing the counts from the same ![]() ${T}_{i} $ with different
${T}_{i} $ with different ![]() $\gamma $, there obviously is a degree of change in counts with different coherent conditions; moreover, the counts from
$\gamma $, there obviously is a degree of change in counts with different coherent conditions; moreover, the counts from ![]() ${T}_{i} $ display a consistent growth along with the increase of coherent degree between incident beams.
${T}_{i} $ display a consistent growth along with the increase of coherent degree between incident beams.
Of course, two factors may have affected the experimental result somewhat. On the one hand, the experimental data are insufficient due to the limited shots. On the other hand, sampling in a small aperture may be vulnerable to the difference in distributions of laser intensity from different shots. However, the experiment data from different beams reveal a consistent trend. That is, although insufficient data and sampling in a small aperture may have some effect on the experimental result, it is credible that the backscatter of SBS and SRS becomes more intense along with the increase of coherence degree between incident beams.
Table 1. Energy counts with different coherent degrees.

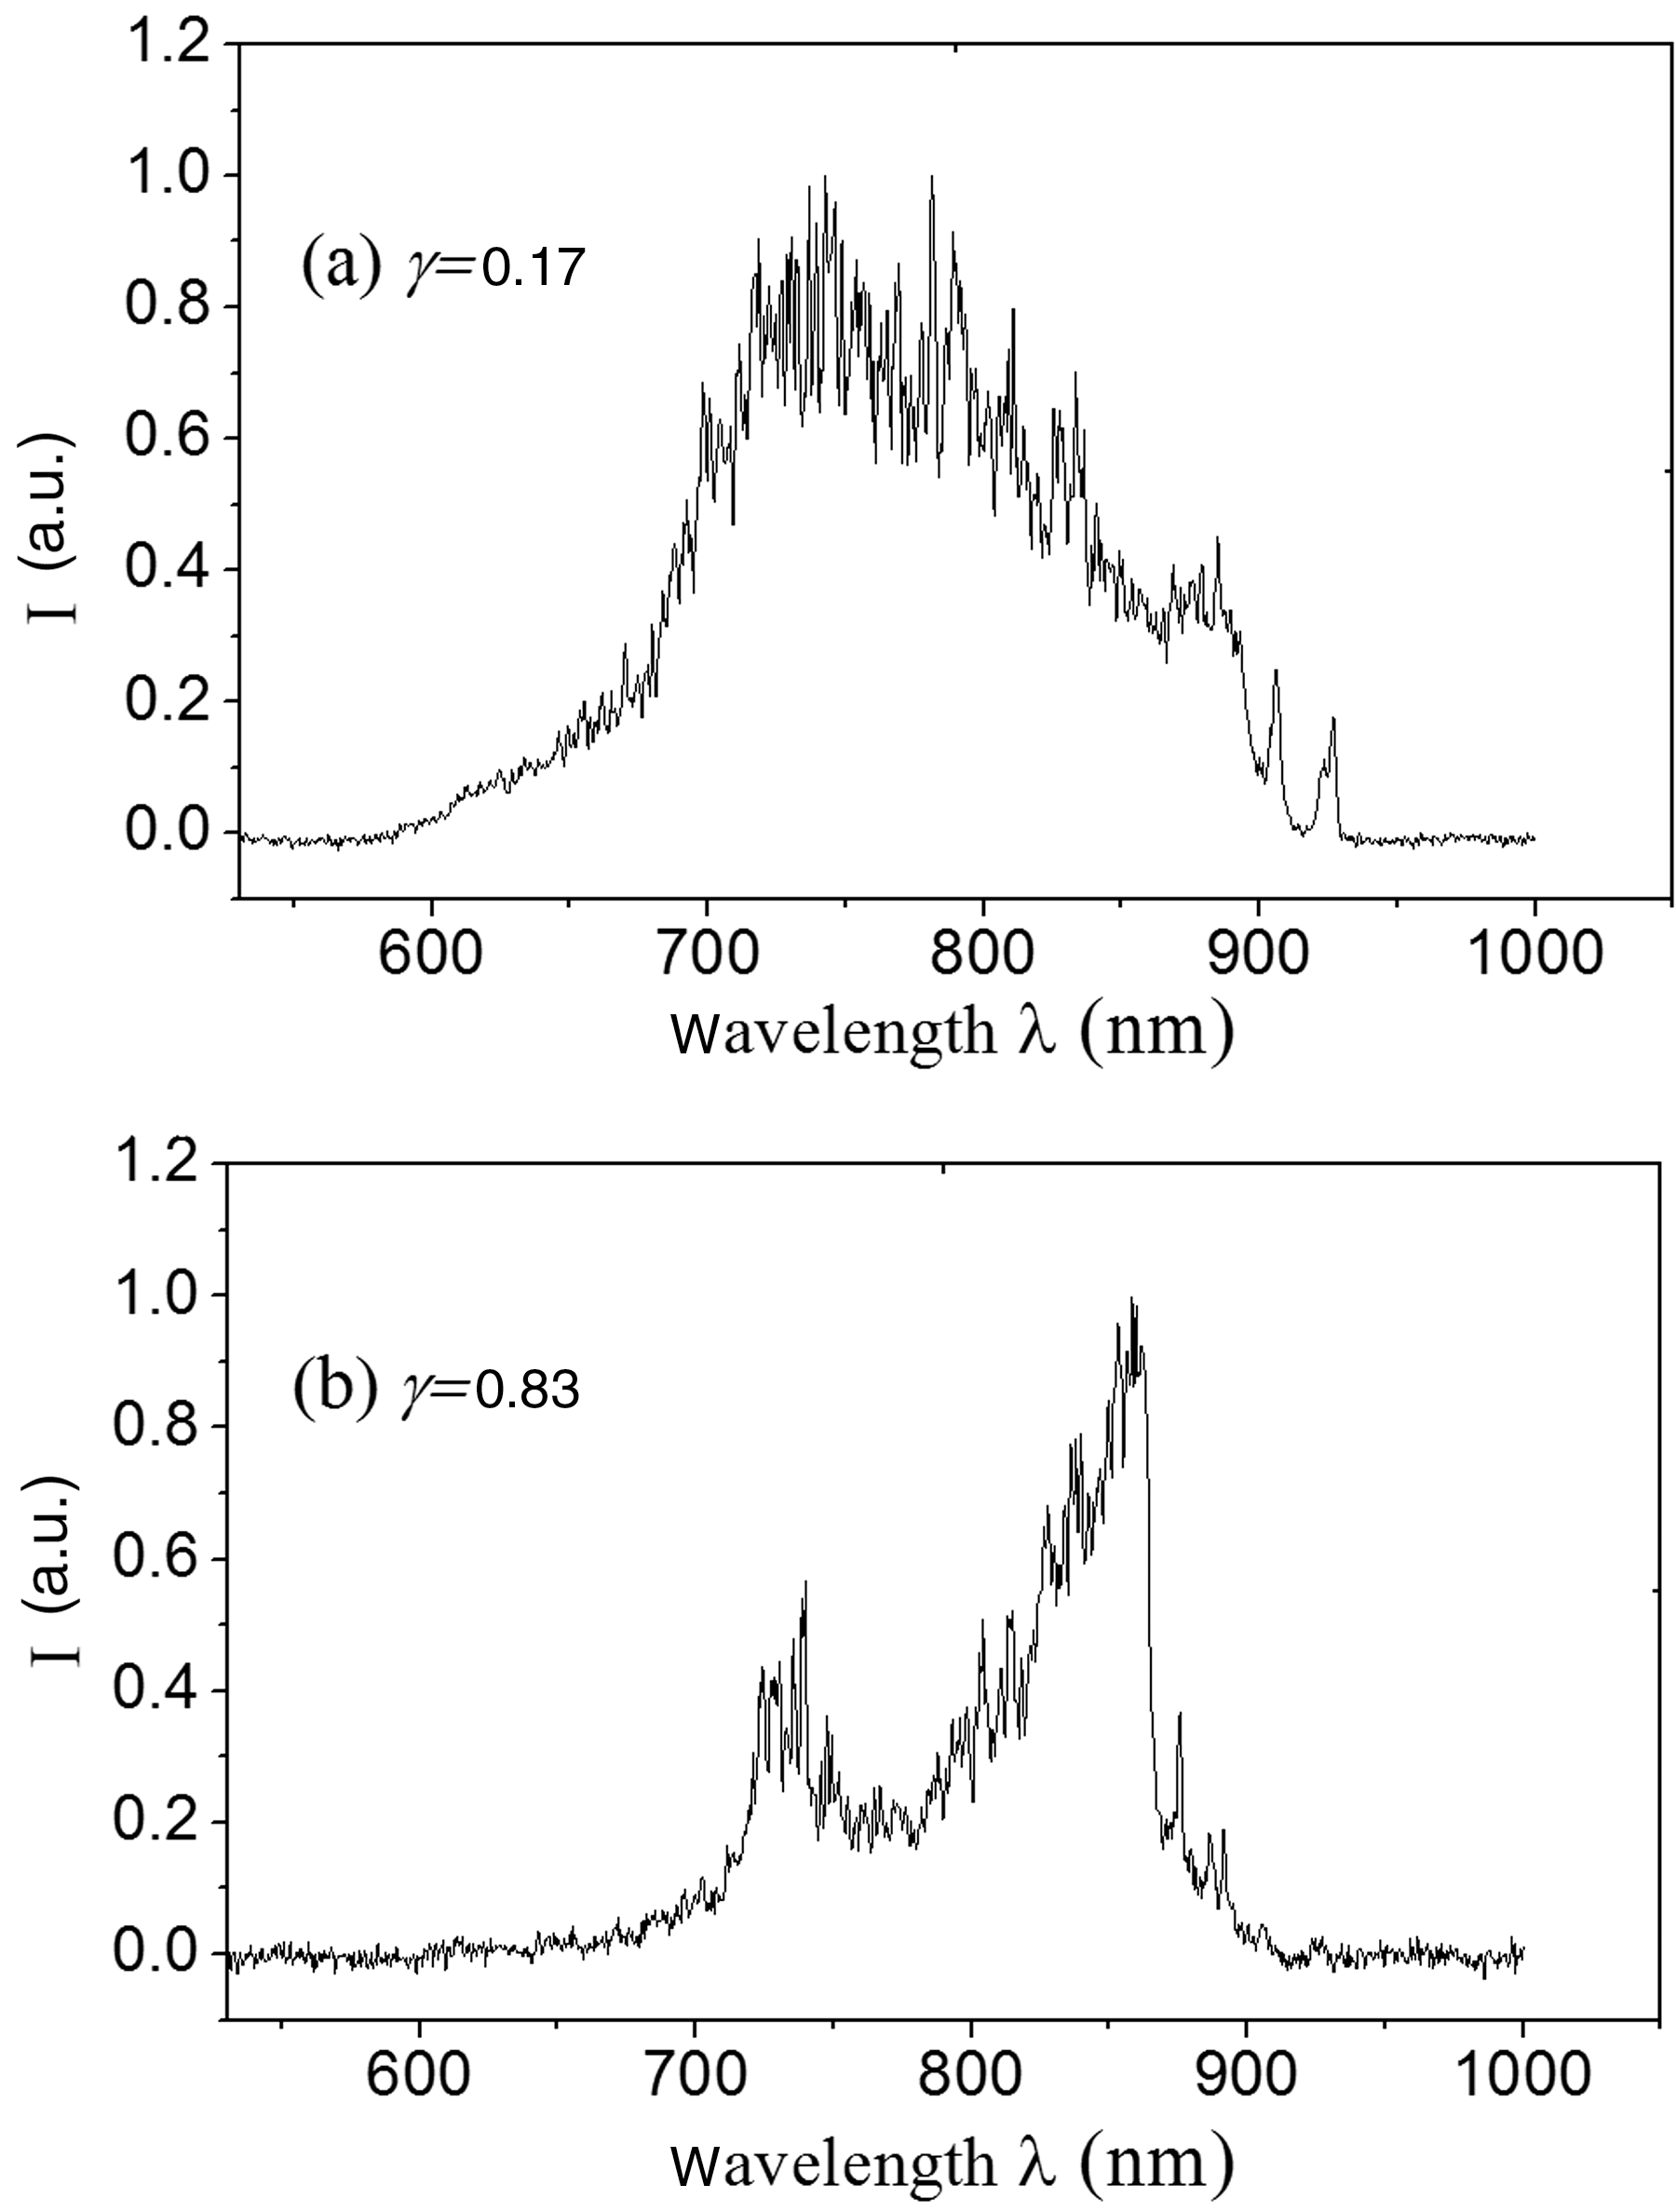
For beam 3#, the spectrum of SRS was measured with a grating spectrometer, as shown in Figure 4. Obviously, the spectra with different coherent degrees present different shapes. When ![]() $\gamma = 0. 17$, it appears as a unimodal spectrum; when
$\gamma = 0. 17$, it appears as a unimodal spectrum; when ![]() $\gamma = 0. 83$, it appears as a bimodal spectrum. It is well known that the shapes of spectra are closely related with the physical condition of plasma. According to the matching condition between frequency and wave number, and also the dispersion relation of SRS, the frequency of SRS backscatter decreases with the increase of electron density. And generally speaking, the size of the plasma area with a certain electron density is proportional to the strength of the corresponding spectrum. So the unimodal spectrum directly reflects a more gentle distribution of electronic density compared with the bimodal spectrum. In other words, the distribution of laser intensity on the target is more uniform with low coherence degree, and this is consistent with the result discussed above. Furthermore, the shift of the peak wavelength to a shorter wavelength suggests a lower average electron density under the condition of lower coherence. With the shortwave cut-off of SRS spectra[Reference Wang, Zheng, Jiang, Liu, Li, Liu, Yu, Liu, Zhang, Tan, Peng, Ding and Zheng16,Reference Zhang17] , the electron density under two conditions of
$\gamma = 0. 83$, it appears as a bimodal spectrum. It is well known that the shapes of spectra are closely related with the physical condition of plasma. According to the matching condition between frequency and wave number, and also the dispersion relation of SRS, the frequency of SRS backscatter decreases with the increase of electron density. And generally speaking, the size of the plasma area with a certain electron density is proportional to the strength of the corresponding spectrum. So the unimodal spectrum directly reflects a more gentle distribution of electronic density compared with the bimodal spectrum. In other words, the distribution of laser intensity on the target is more uniform with low coherence degree, and this is consistent with the result discussed above. Furthermore, the shift of the peak wavelength to a shorter wavelength suggests a lower average electron density under the condition of lower coherence. With the shortwave cut-off of SRS spectra[Reference Wang, Zheng, Jiang, Liu, Li, Liu, Yu, Liu, Zhang, Tan, Peng, Ding and Zheng16,Reference Zhang17] , the electron density under two conditions of ![]() $\gamma = 0. 17$ and
$\gamma = 0. 17$ and ![]() $\gamma = 0. 83$ were preliminarily estimated to be about
$\gamma = 0. 83$ were preliminarily estimated to be about ![]() ${\mathop{0. 04n}\nolimits}_{cr} $ and
${\mathop{0. 04n}\nolimits}_{cr} $ and ![]() ${\mathop{0. 07n}\nolimits}_{cr} $, respectively.
${\mathop{0. 07n}\nolimits}_{cr} $, respectively.

Figure 4. Spectra of SRS with different coherent degrees. (a) ![]() $\gamma = 0. 17$ (b)
$\gamma = 0. 17$ (b) ![]() $\gamma = 0. 83$.
$\gamma = 0. 83$.
4. Conclusion
Experimental results prove that the impact of coherence between laser beams on backscattered light is real, and that there is usually more intense backscatter the higher the coherent degree between the incident beams. Meanwhile, the conclusion above suggests a possible way to understand the increase of SBS and SRS backscatter in recent related experiments on NIF.
Acknowledgements
The authors would like to express their appreciation for many people and relevant institutions to diligently work on ‘SG-II’ facility.


