Management Implications
Brassica tournefortii (African mustard) is an introduced winter annual plant species that is negatively impacting native species in arid North America, especially in the Mojave and Sonoran Deserts. Managing this species on a large scale requires directing finite resources to locations favoring its population growth and persistence (i.e., invasibility). We analyzed data collected from a vegetation mapping project to determine factors influencing the invasibility of B. tournefortii and to predict its invasibility over 280,000 ha of the Barry M. Goldwater Range (BMGR) West, managed by the U.S. Marine Corps Air Station–Yuma.
First, we showed that B. tournefortii invasibility was explained by spatial environments represented by associations of dominant native vegetation, but not by proximity to roads. This finding indicates that while roads may serve as corridors for B. tournefortii dispersal, habitat characteristic ultimately determines whether this species can establish in a location. Special attention should be paid to roads intercepting habitats subject to high invasibility of B. tournefortii. Local population buildup along roads in these interceptions may lead to whole-habitat invasion.
Second, we predicted a large continuum of space subject to intermediate to high invasibility in the western range, whereas the central and eastern ranges are a mosaic varying strongly in invasibility. This spatial pattern suggests that the western range could see an untethered expansion of B. tournefortii and should be prioritized for eliminating nascent and established populations. In the rest of the range, management can take advantage of the abundance of habitats with low invasibility, which can serve as natural invasion barriers. In the central to eastern ranges, management can focus on eliminating well-established local populations of B. tournefortii that are connected to other highly invasible locations through dispersal corridors (e.g., roads and watercourses), populations in highly invasible habitats that cover large areas, and isolated populations that thrive locally. Focusing on removal of these three types of populations can further divide the fragmented distribution of B. tournefortii on the central and eastern ranges, reducing connectivity between local populations and thus facilitating the containment of B. tournefortii.
Overall, recording presence/absence of invasive plants in a vegetation mapping project enabled large-scale prediction of invasibility. This method, when used in an iterative prediction–validation process, can strongly inform adaptive management to contain range-wide plant invasions.
Introduction
Managing invasive plants on a mesoscale (e.g., tens to hundreds of kilometers) requires prioritizing strategic locations for monitoring and treatment in order to contain large-scale spread (Epanchin-Niell and Hastings Reference Epanchin-Niell and Hastings2010; Giljohann et al. Reference Giljohann, Hauser, Williams and Moore2011; Roura-Pascual et al. Reference Roura-Pascual, Krug, Richardson and Hui2010). The probability of having a specific invasive species, defined here as the invasibility of that species, often varies dramatically in space due to spatial environmental heterogeneity (Brummer et al. Reference Brummer, Taylor, Rotella, Maxwell, Rew and Lavin2016; Chabrerie et al. Reference Chabrerie, Verheyen, Saguez and Decocq2008). Locations of higher invasibility usually should be given higher priority for monitoring and treatment (Giljohann et al. Reference Giljohann, Hauser, Williams and Moore2011; Roura-Pascual et al. Reference Roura-Pascual, Krug, Richardson and Hui2010). Nevertheless, it is often challenging to assess invasibility at a fine spatial resolution over a large extent of space.
This challenge is exemplified by the invasion of African mustard (Brassica tournefortii Gouan) (Brassicaceae), a winter annual species of serious invasion concern in arid western North America. Its invasion is especially problematic over the Mojave and Sonoran Deserts, where it is widely distributed (Abella et al. Reference Abella, Spencer, Hoines and Nazarchyk2009; Li et al. Reference Li, Dlugosch and Enquist2015) and negatively impacts native ecological communities (Barrows et al. Reference Barrows, Allen, Brooks and Allen2009; Berry et al. Reference Berry, Gowan, Miller and Brooks2014; VanTassel et al. Reference VanTassel, Hansen, Barrows, Latif, Simon and Anderson2013). Brassica tournefortii can establish over a broad range of physical environments (Li et al. Reference Li, Dlugosch and Enquist2015; Winkler et al. Reference Winkler, Gremer, Chapin, Kao and Huxman2018), within which it experiences dramatic spatial variation in its density and presence (Berry et al. Reference Berry, Gowan, Miller and Brooks2014; Craig et al. Reference Craig, Craig, Abella and Vanier2010; Van Devender et al. Reference Van Devender, Felger and Búrquez1997). This spatial variation underscores the need for a better prediction of B. tournefortii invasibility at large scales and a better understanding of spatial factors influencing its invasibility.
Species distribution models (SDMs) have been increasingly used to predict habitat suitability for, and hence invasibility of, invasive plants (Elith and Leathwick Reference Elith and Leathwick2009). Based upon regression or machine-learning methods, these models combine density or point occurrence (presence/absence or presence only) data of the invasive species and spatial environmental variables to predict the probability of occurrence of the focal species. In the case of B. tournefortii, both density data and presence-only data have been used in SDMs to predict its invasibility over large landscapes (Berry et al. Reference Berry, Gowan, Miller and Brooks2014; Sanchez-Flores Reference Sanchez-Flores2007). SDMs may not adequately predict an invasive species’ distribution if the species’ current distribution represents only a subset of the full environmental niche of that species (Elith et al. Reference Elith, Kearney and Phillips2010). This becomes less of a problem for well-established invasive species that are also limited in their adaptation to novel environments. Brassica tournefortii is one of these species because of its long invasion history, rapid expansion to fully occupy its climatic niche in North America (Li et al. Reference Li, Dlugosch and Enquist2015), and limited potential for adaptation due to low genetic diversity (Winkler Reference Winkler2017).
A more challenging problem of predicting invasibility of well-established invasive plants like B. tournefortii on a mesoscale is the lack of high-quality and high spatial resolution environmental data. On a mesoscale, factors such as soil type, soil nutrient availability, and biotic interactions are important in influencing habitat quality for plant species (Chabrerie et al. Reference Chabrerie, Verheyen, Saguez and Decocq2008; Chang et al. Reference Chang, Zelený, Li, Chiu and Hsieh2013; Coudun et al. Reference Coudun, Gégout, Piedallu and Rameau2006; Jones et al. Reference Jones, Tuomisto, Borcard, Legendre, Clark and Olivas2008; Mackey and Lindenmayer Reference Mackey and Lindenmayer2001). Unfortunately, reliable, high-resolution data for these environmental variables are often not available (e.g., Brummer et al. Reference Brummer, Taylor, Rotella, Maxwell, Rew and Lavin2016). Using surrogates such as topographic variables can lead to misleading predictions. For example, Chang et al. (Reference Chang, Zelený, Li, Chiu and Hsieh2013) found that when topography was used as a surrogate for environmental variables, models indicated that the spatial composition of a subtropical broadleaf forest was primarily shaped by dispersal-based processes. On the contrary, when soil variables were used, models suggested that the forest composition was primarily shaped by niche-based processes, in which soil types defined spatial niches. It remains a challenge to acquire sufficient fine-scale environmental variables to predict plant habitat suitability over complex spatial environments.
Here we demonstrate an approach that uses vegetation associations as surrogates for the multitude of environmental variables that might affect plant invasibility. Changes in dominant vegetation composition reflect variation in both abiotic and biotic factors, especially those related to soil properties and biotic interactions (Greig-Smith Reference Greig-Smith1979; HilleRisLambers et al. Reference HilleRisLambers, Adler, Harpole, Levine and Mayfield2012). Therefore, mapping changes in the association of dominant vegetation on a mesoscale may provide reliable data that indicate spatial variation in essential determinants of plant invasibility.
Other than spatial environmental factors, invasibility of a species also can be influenced by propagule pressure linked to dispersal (Simberloff Reference Simberloff2009). Roads can serve as major dispersal corridors for invasive plants. Heightened propagule pressure close to roads can increase invasibility (Jørgensen and Kollmann Reference Jørgensen and Kollmann2009). Previous studies suggested roads could strongly encourage B. tournefortii invasion (Berry et al. Reference Berry, Gowan, Miller and Brooks2014; Brooks Reference Brooks, Webb, Fenstermaker, Heaton, Hughson, McDonald and Miller2009; Sanchez-Flores Reference Sanchez-Flores2007), whereas one study questioned this road effect (Craig et al. Reference Craig, Craig, Abella and Vanier2010). It is possible that the effect of roads depends on the habitat through which they pass.
We combined data of B. tournefortii presence/absence, vegetation associations, and road locations to evaluate B. tournefortii invasibility over the 280,000-ha Barry M. Goldwater Range West (BMGR West) in southwestern Arizona, USA. First, we asked how two variables: spatial environments represented by vegetation subassociations and proximity to roads could be used to predict B. tournefortii invasibility. Second, we used spatial prediction of B. tournefortii invasibility over this range to highlight areas of elevated invasion concern and those contributing most strongly to large-scale spread of B. tournefortii over complex landscapes. We used our findings to inform the management of B. tournefortii over the BMGR West. We further discussed the ongoing effort of extending our approach to a greater spatial scale and how to enable adaptive management of invasive plants through an iterative prediction–validation process.
Materials and Methods
Site Description
The BMGR West encompasses nearly 280,000 hectares in southwestern Arizona. It falls entirely within the Lower Colorado River subdivision of the Sonoran Desert (Brown Reference Brown1982). Elevations range from 56 to 962 m above sea level (m asl). The 85-yr climate data from nearby Yuma Citrus Station (58 m asl) show an average high of 41.2 C in July and an average low of 3.9 C in January. The average annual precipitation of 87 mm is among the lowest in the Sonoran Desert, with a bimodal summer and winter rainy season that supports summer and winter annual plants as well as perennial shrubs, grasses, trees, and cacti, including saguaros [Carnegiea gigantea (Engelm.) Britton & Rose] up to 10 m tall. The plant diversity is enhanced by diverse landforms that include mountains, valleys, dunes, ephemeral watercourses, and floodplains.
Brassica tournefortii has a relatively long history of invading the BMGR West. The first specimen of B. tournefortii adjacent to BMGR West was collected in 1959 on Yuma Mesa just east of the BMGR West western boundary (K. C. Hamilton, ARIZ 129283 & 130879). No collection appeared on the BMGR in the following decades, likely due to the remoteness of the range. It was not until 1973 that the first B. tournefortii specimen was collected on the Mohawk Dunes within the BMGR (D. J. Pinkava, ASU 0026561). Over the winter–spring growing season of 2000 to 2001, high abundance of B. tournefortii was recorded over the Mohawk Valley from the BMGR West northern boundary well into the heartland of the range (Malusa et al. Reference Malusa, Halvorson and Angell2003), suggesting this species was well established on the range.
Vegetation Classification on the BMGR West
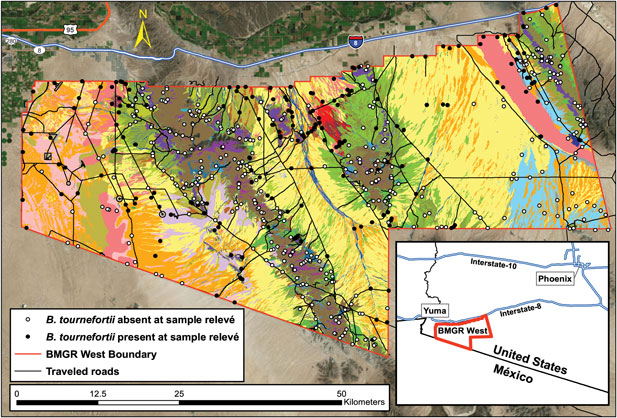
Malusa and Sundt (Reference Malusa and Sundt2015) developed a vegetation classification map of the BMGR West based on remote-sensing imagery and field surveys. They established 656 sample relevés (Minnesota Department of Natural Resources 2013; Mucina et al. Reference Mucina, Schaminée and Rodwell2000) to survey and compare vegetation composition across all distinctive landforms identified through aerial imagery (Figure 1). The presence of B. tournefortii was not a factor in choosing relevés.

Figure 1. Vegetation classification of the Barry M. Goldwater Range (BMGR) West allowed for inference of spatial variation in Brassica tournefortii invasibility. Each unique color represents a vegetation subassociation, the finest level of vegetation type mapped on the BMGR West (see Supplementary Figure S1 for a complete list of subassociation names associated with each color). Vegetation types were determined by sampling vegetation cover in each of the 656 relevés (circles) between 2009 and 2014. Brassica tournefortii presence (filled circles) and absence (open circles) were also sampled in these relevés. We used logistic regression models to determine the influence of two factors on the probability of B. tournefortii presence: (1) spatial environments represented by subassociations and (2) proximity to traveled roads (black lines). Inset shows the geographic location of BMGR West in southwestern Arizona, USA.
Within each relevé, the percent canopy cover of perennial vegetation was assessed by a step-point transect (Evans and Love Reference Evans and Love1957), in which a notch in the toe of the observer’s boot was the “point.” With each step the observer looked straight down for a bird’s-eye view, determining whether the notch intercepted the canopy of a plant. If the canopy was that of a desert tree (typically 2- to 4-m tall), a 1.5-m walking stick was used to extend the point upward.
Other species observed but not intercepted in the step-point transect were recorded, so long as they occurred within the same vegetation type. For example, a species 10 m from the end of a transect would be included as present (but not a “hit”) if it were along the bank of an arroyo that was being sampled, but not if it were 10 m outside the arroyo in a different vegetation type. All perennials were recorded, as well as certain annuals of interest, such as B. tournefortii. This annual plant was noted as present even if there were only the distinctive skeletal remains of the plant from the previous year.
A transect that began near a road would proceed away from that feature. Transects in habitats defined by watercourses were surveyed along the courses. Transect length varied in proportion to the density of vegetation or difficulty of terrain or both. The longest were 1,000 steps (about 700 m at 0.7 m step−1) in creosote bush [Larrea tridentata (DC.) Coville] monotypes, while the shortest were 100 steps on steep north-facing slopes with mormon tea (Ephedra viridis Coville) and in watercourses. The length of each step was kept consistent to the best of the surveyor’s ability.
Fifty-one of these relevés were surveyed in 2001, while the rest were surveyed from 2009 to 2014. Those 51 relevés were not included in our analysis because of the concern that the conditions for B. tournefortii invasion then would be too different from those in 2009 to 2014.
Using this vegetation survey data and following the U.S. National Vegetation Classification (Federal Geographic Data Committee 2008; Jennings et al. Reference Jennings, Faber-Langendoen, Loucks, Peet and Roberts2009, USNVC 2018), Malusa and Sundt (Reference Malusa and Sundt2015) defined the alliance and association levels of vegetation based on the dominant species and their associates, with the dominant species having the highest percent cover. For example, there is an association of Larrea tridentata–burrobush [Ambrosia dumosa (A. Gray) Payne], which in turn is part of the higher-level L. tridentata alliance. Subassociations, typically based on landform and indicator species, were also mapped. For instance, L. tridentata–A. dumosa may occur in several subassociations, including gravelly ridges with ocotillo (Fouquiera splendens Engelm.), on moving sands with desert palafox (Palafoxia arida B.L. Turner & Morris), or on stony hills with California fagonbush (Fagonia laevis Standl.). All but one subassociation were surveyed by multiple relevés. The completed map shows seven alliances, 25 associations, and 42 subassociations across the BMGR West. Barrens (<1% total vegetation cover) and disturbed areas (e.g., roads) were mapped but not sampled further.
Determining Factors That Influence Brassica tournefortii Invasibility
We used logistic regressions to model a dependent variable (presence/absence of B. tournefortii) and two independent variables: distance to a road and vegetation subassociation. The number of relevés representing each subassociation was proportional to its mapped extent on the BMGR West, ranging from a single relevé from the 7 ha of the honey mesquite (Prosopis glandulosa Torr.) bosque subassociation to 51 relevés from the 56,943 ha of the L. tridentata–A. dumosa subassociation. This skewed sample compelled us to exclude or combine subassociations to obtain a total of 29 vegetation subassociations or their combinations (hereafter also called “subassociations”) to represent distinct spatial environments for the statistical analysis.
First, five subassociations, ranging from 7 to 288 ha, were excluded from the analysis because they were (1) represented by five or fewer relevés and (2) did not share dominant species or landforms with another subassociation (Supplementary Table S1). In other words, these are unique subassociations with very small sample sizes, as in the case of the desertholly [Atriplex hymenelytra (Torr.) S. Watson]–Ambrosia dumosa–wand holdback (Hoffmannseggia microphylla Torr.) shrublands.
Second, 13 subassociations, ranging from 217 to 1446 ha, were combined into six groups (Supplementary Table S1). Subassociations in the same group (1) belonged to the same association, (2) shared dominant species or landforms or both, and (3) held similar proportions of relevés with B. tournefortii. Proportions were considered similar if they were not marginally significantly different (p > 0.1) according to a Fisher’s exact test. For example, the 4 relevés for “teddybear cholla [Cylindropuntia bigelovii (Engelm.) F.M. Knuth] on bajadas with >1% tree cover” were combined with the 10 relevés for “C. bigelovii on bajadas with <1% tree cover” for a total of 14 relevés.
We used ArcGIS (v. 10.5.1, Esri, Redlands, CA) to determine the distance of each relevé to the nearest road. Projection used for GIS layers was NAD_1983_StatePlane_Arizona_West_FIPS_0203. Using a Microsoft Access (Redmond, WA) database, we first created feature classes that represented the starting locations of all relevés (Figure 1). We added a road layer provided by the U.S. Marine Corps that included 37 km of paved and 983 km of unpaved roads on the range. Roads were plain to see on satellite imagery, which allowed us to improve the accuracy of the road layer in ArcGIS by including an additional 173 km of unpaved roads that are mostly the result of U.S. Border Patrol activity over the last 15 yr, including construction of a pedestrian fence and vehicle barrier along the international frontier. The Near Analysis Tool was used to calculate the perpendicular distance (in meters) from each relevé starting point to the nearest road. The natural log of the distance was used in the regression to restore the normality of the distribution of this variable.
To determine whether each of the two independent variables was significantly associated with the presence/absence of B. tournefortii, we performed logistic regressions in R (v. 3.4.4) using the glm function (R script and data available at https://osf.io/5tkd6/; DOI: 10.17605/OSF.IO/5TKD6). We performed likelihood ratio tests to compare the full model with an alternative model, in which one of the independent variables was dropped. The generalized variance-inflation factors adjusted for degrees of freedom (GVIF1/(2·df)) was smaller than 1.1 for both independent variables (estimated using the vif function in the car package, v. 3.0; Fox and Weisberg Reference Fox and Weisberg2011), suggesting negligible influence of collinearity between the two variables on model inferences (Zuur et al. Reference Zuur, Ieno and Elphick2010).
The uneven spatial distribution of our relevés over the range meant that they could be clustered or dispersed, leading to spatial autocorrelation (Supplementary Appendix S1). To evaluate the influence of spatial autocorrelation, we performed further logistic regressions using the corrHLfit function in the spaMM package (v. 2.3.0; Rousset and Ferdy Reference Rousset and Ferdy2014). Regressions performed by this function, which accounts for autocorrelation, give the same overall conclusions and predictions as the basic models (Supplementary Appendix S1). Therefore, we present in the main text results inferred by the basic logistic regression models.
Spatial Assessment of Brassica tournefortii Invasibility
We estimated invasibility as the probability of B. tournefortii presence in a subassociation (P invasion) predicted by the most-parsimonious logistic model. This probability equates the proportion of relevés with B. tournefortii present in a specific vegetation subassociation (see “Results and Discussion”). We obtained the 95% confidence interval (CI) of each probability as the modified Jeffreys interval for a binomial proportion. This interval has far more satisfactory coverage than the commonly used Wald CI, especially when sample sizes are small (Brown et al. Reference Brown, Cai and DasGupta2001). Based on the spatial distribution of each subassociation and its predicted invasibility of B. tournefortii, we produced a 1:380,000 map in ArcGIS indicating the spatial variation in B. tournefortii invasibility over the BMGR West.
Results and Discussion
Factors Influencing Brassica tournefortii Presence
Likelihood ratio tests based on logistic regression models suggested that vegetation subassociation was the only factor significantly associated with B. tournefortii presence/absence (χ 228 = 214, p < 10−7; Table 1). In general, subassociations subject to high invasibility (P invasion > 0.5) of B. tournefortii are on flat terrain (fans, dunes, floodplains, etc.), whereas those subject to low invasibility (P invasion < 0.25) are on mountainous terrain (Figure 2). This association pattern was further supported by a significant negative correlation between B. tournefortii presence and the steepness of relevés (χ 21 = 0.27.96, p = 1.24 × 10⁻⁷; Table A3 in Supplementary Appendix S1).
Table 1. Likelihood ratio tests of logistic regression models determine that spatial environments represented by vegetation subassociations, but not proximity to roads, were significantly associated with the presence/absence of Brassica tournefortii.a

a Each likelihood ratio test compares the full model, in which both explanatory variables were included, with an alternative model, in which one of them was dropped.

Figure 2. The inferred probability of Brassica tournefortii presence (invasibility) in spatial environments represented by vegetation subassociations. Logistic regression models inferred that vegetation subassociations, but not proximity to roads, explained the probability of B. tournefortii presence, and the predicted probability equated the observed probability (i.e., the proportion of relevés with B. tournefortii presence in a subassociation). Circle sizes indicate sizes of the subassociations. The name of a subassociation is followed by the subassociation code used in Malusa and Sundt (Reference Malusa and Sundt2015). The first digit of the three-digit code distinguishes vegetation alliances; the second digit distinguishes vegetation associations; and the third digit distinguishes vegetation subassociations. Bars indicate the 95% confidence intervals of the observed probabilities based on the modified Jeffreys intervals (Brown et al. Reference Brown, Cai and DasGupta2001).
Our models indicated that proximity to roads was not significantly associated with B. tournefortii presence (χ21 = 0.180, p = 0.671; Table 1). This result implies that while roads may serve as corridors for B. tournefortii dispersal, habitat characteristic ultimately determines whether this species can establish in a location. Proximity to roads, nevertheless, may have positive influence on B. tournefortii density within the species’ favorable habitat (Berry et al. Reference Berry, Gowan, Miller and Brooks2014). As dispersal corridors, roads can increase propagule pressure of invasive plants, which can lead to increased invasive plant density (Levine Reference Levine2000; Simberloff Reference Simberloff2009). Precipitation runoff from roads enhances soil moisture along the road’s margin, improving conditions for germination and successful recruitment of annual weeds such as B. tournefortii. Certain types of road berms, which resemble sandy soil habitat associated with high invasibility of B. tournefortii, can enhance recruitment of B. tournefortii (Brooks Reference Brooks, Webb, Fenstermaker, Heaton, Hughson, McDonald and Miller2009). Therefore, road-edge management can influence plant invasibility of roadside habitat (Craig et al. Reference Craig, Craig, Abella and Vanier2010). Special attention should be paid to roads intercepting habitat with high invasibility of B. tournefortii. Local population buildup along roads in these interceptions may lead to whole-habitat invasion.
Our finding agrees with other observations that sandy soils are associated with high B. tournefortii population growth, rather than rocky shallow soils on more steep terrain (Berry et al. Reference Berry, Gowan, Miller and Brooks2014; Brooks Reference Brooks, Webb, Fenstermaker, Heaton, Hughson, McDonald and Miller2009; Van Devender et al. Reference Van Devender, Felger and Búrquez1997). There are exceptions to this general pattern. For example, brittlebush (Encelia farinosa A. Gray ex Torr.)–Larrea tridentata on dark rocks (typically basalt) is subject to a relatively high invasibility (P invasion = 0.429; Figure 2). Seemingly similar spatial environments could also differ substantially in B. tournefortii invasibility. The best example is the difference between L. tridentata monotype and L. tridentata–A. dumosa subassociation with predicted invasibility of B. tournefortii of 0.572 and 0.257, respectively.
Managing Invasion According to Spatial Assessment of Invasibility
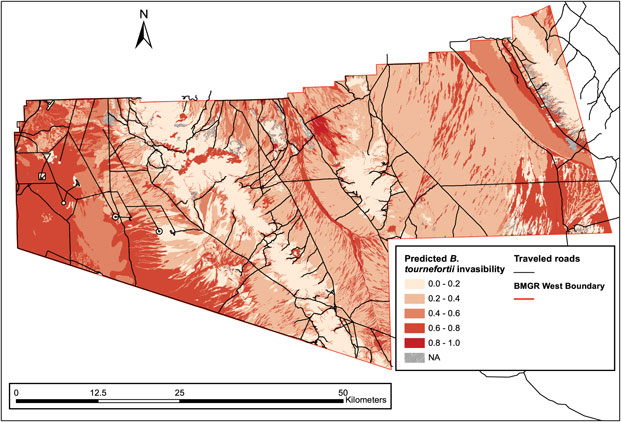
The predicted B. tournefortii invasibility indicates a large continuum of space subject to intermediate to high invasibility (0.4 < P invasion < 0.8) in the western part of the BMGR West, whereas the central and eastern ranges are a mosaic varying strongly in B. tournefortii invasibility (0 ≤ P invasion ≤ 1) (Figure 3). This habitat distribution pattern suggests that the western range could see an untethered expansion of B. tournefortii if this species is able to establish farther into those moderately to highly invasible habitats. Land managers need to focus on removing nascent populations and preventing further growth of established local populations on the western range.

Figure 3. Spatial assessment of predicted invasibility of Brassica tournefortii shows distinct spatial patterns of invasion risk over the BMGR West. The western range consists of a large continuum of space with intermediate to high B. tournefortii invasibility (0.4 < P invasion < 0.8) and may experience an untethered spread of B. tournefortii if the species can expand farther over that space. The central and eastern range are a mosaic varying strongly in B. tournefortii invasibility. Some of the most invasible habitats occur there, but are frequently intercepted by space of low invasion risk (those with 0 ≤ P invasion < 0.25).
In comparison, the expansion of B. tournefortii on the central and eastern ranges will be limited by the strong spatial variation in the species’ invasibility. Some of the subassociations most invasible by B. tournefortii occur in this part of the range (e.g., Ambrosia dumosa–big galleta [Pleuraphis rigida Thurb.] on fans with a P invasion = 1), but they are also frequently intercepted by areas of low or intermediate invasion risk (0 ≤ P invasion < 0.25) that act as natural invasion barriers. Reducing habitat connectivity can be the most cost-effective approach to limit invasion (Blackwood et al. Reference Blackwood, Hastings and Costello2010). Following this general principle, land managers can take advantage of these natural barriers and focus on eliminating the following types of populations in descending order of priority: (1) well-established local populations of B. tournefortii that are connected to other highly invasible locations (P invasion > 0.5) through dispersal corridors (e.g., roads and watercourses), (2) populations in highly invasible subassociations (P invasion > 0.5) that cover large areas (e.g., Mohawk Dunes in the eastern range), and (3) isolated populations that thrive locally. Focusing on removal of these three types of populations can further divide the fragmented distribution of B. tournefortii on the central and eastern ranges, reducing connectivity between local populations and thus facilitating the containment of B. tournefortii in this part of the BMGR West.
Future Directions
Our study predicted a general spatial pattern of B. tournefortii invasibility over the 280,000-ha BMGR West. Our prediction provides an initial base for land managers to focus their controlling efforts in areas most vulnerable to large-scale invasion of a high-impact exotic plant. It is necessary to continue the monitoring and demographic surveys of B. tournefortii over the BMGR West so as to create an iterative process (Dietze et al. Reference Dietze, Fox, Beck-Johnson, Betancourt, Hooten, Jarnevich, Keitt, Kenney, Laney, Larsen, Loescher, Lunch, Pijanowski, Randerson, Read, Tredennick, Vargas, Weathers and White2018) to improve the accuracy of our prediction, while providing timely information to land mangers so they can adjust the selection of priority areas for managing this invasive species. One caveat of our findings is that some subassociations have relatively high uncertainty of B. tournefortii invasibility, as indicated by their large CIs (Figure 2). This increased uncertainty was caused by small sample sizes. We will establish additional relevés in these subassociations (while minimizing their spatial autocorrelation) in the iterative process, to reduce this uncertainty.
We showed that vegetation mapping can enable mesoscale inference of spatial variation in plant invasibility. By measuring presence/absence of invasive plant species while mapping vegetation associations representing distinct environments, one can acquire valuable data for inferring spatial patterns of invasibility over a large extent of space. This approach strikes a balance between the details required to define spatial environments and their vulnerability to plant invasion and the large spatial scales required to produce meaningful predictions for managing range-wide plant invasion.
As the same protocols were followed to complete vegetation classification of the BMGR East and Cabeza Prieta National Wildlife Refuge bordering the BMGR West, there soon will be a continuous vegetation classification map covering approximately 1 million hectares in southwestern Arizona. With additional data of B. tournefortii presence/absence acquired from these highly comparable mapping projects, we will be able to assess B. tournefortii invasibility to an even greater spatial extent. This endeavor, along with the iterative process of producing and validating invasibility predictions on the ground, creates an important decision-making tool for managing B. tournefortii invasion across jurisdiction boundaries in southwestern Arizona. Our approach can be adopted and refined more commonly to simultaneously complete vegetation classification and spatial assessment of plant invasion, both of which are becoming increasingly essential for conservation management on large scales (Chytrý et al. Reference Chytrý, Schaminée and Schwabe2011; Epanchin-Niell and Hastings Reference Epanchin-Niell and Hastings2010; Giljohann et al. Reference Giljohann, Hauser, Williams and Moore2011; Roura-Pascual et al. Reference Roura-Pascual, Krug, Richardson and Hui2010).
Acknowledgments
This project is funded by U.S. Marine Corps (Cooperative Agreement DACA87-05-H-0018 and W9126G-14-2-0045, JM). No conflicts of interest have been declared. We thank François Rousset for advising us on the use of the spaMM package in R. All authors developed the concept of the article. JM collected the field data. BS processed the data in ArcGIS and generated spatial data for statistical inferences. YML performed statistical tests. YML led the development of the article, with contribution from all authors.
Supplementary material
To view supplementary material for this article, please visit https://doi.org/10.1017/inp.2019.23