


1. Introduction
According to Wiggins and Keats (Reference Wiggins and Keats2013), more than half of the rural economically active population in sub-Saharan Africa (SSA) comprises smallholder farmers who own 80% of the farms and contributes about 90% of the total food production. Smallholder agricultural producers mostly make their living from agricultural income and consume from their production that is done annually on seasonal basis (Maggio and Asfaw, Reference Maggio and Asfaw2020). Agricultural innovations have the potential to make farming productive and profitable among poor rural smallholder farmers across the world especially in SSA. This can also improve household food security for both producers and consumers (Magnan et al., Reference Magnan, Spielman, Lybbert and Gulati2015).
A positive technical change through increased adoption of agricultural innovations constitutes a positive step toward agricultural productivity improvement, enhanced food security, rural development, and poverty reduction (Gebremariam and Tesfaye, Reference Gebremariam and Tesfaye2018; Sheahan and Barrett, Reference Sheahan and Barrett2017). As highlighted by Dzanku et al. (Reference Dzanku, Jirström and Marstorp2015), technical change in agricultural production is one of the most realistic possibilities to close yield gaps, especially in low production regions where high pressure on land, low soil fertility, and low productivity are common. Furthermore, Dzanku et al. (Reference Dzanku, Jirström and Marstorp2015) reiterate that increasing agricultural productivity is key to improving food security and economic growth for SSA in the midst of its challenge to meet the rising food demand from increasing population and deteriorating natural resources.
While there are potential benefits associated with encouraging smallholder farmers to invest and adopt new agricultural technologies and innovations, increased rates of slow adoption, non-adoption, and dis-adoption of such technologies and innovations remain in SSA (Khonje et al., Reference Khonje, Manda, Alene and Kassie2015; Magnan et al., Reference Magnan, Spielman, Lybbert and Gulati2015). According to West (Reference West2019), new technologies and farming practices have the potential to deliver real-time benefits, but variable rates of adoption undermine the likely benefits from adoption of such technologies on both individual farmers and the entire agricultural sector. It therefore follows that the debate of adoption of agricultural technology continues to be of interest among development practitioners. Adoption of agricultural technology and innovation is influenced by risk and uncertainty (Holden and Quiggin, Reference Holden and Quiggin2017; Shimamoto et al., Reference Shimamoto, Yamada and Wakano2017); credit constraints (Abdallah, Reference Abdallah2016; Carrer et al., Reference Carrer, Maia, de Mello Brandão Vinholis and de Souza Filho2020); access to information about the availability, social learning, profitability, and use of the new technology (Huffman, Reference Huffman2020; Liverpool-Tasie et al., Reference Liverpool-Tasie, Omonona, Sanou and Ogunleye2017; Liverpool-Tasie and Winter-Nelson, Reference Liverpool-Tasie and Winter-Nelson2012; Lu et al., Reference Lu, Addai and Ng’ombe2021a; Nonvide, Reference Nonvide2021); and heterogeneous benefits (Adam and Abdulai Reference Adam and Abdulai2022; Maggio and Asfaw, Reference Maggio and Asfaw2020; Magnan et al., Reference Magnan, Spielman, Lybbert and Gulati2015; Suri, Reference Suri2011). Liverpool-Tasie (Reference Liverpool-Tasie2017) asserts that these factors, mostly considered individually, are closely linked and do jointly affect the benefits and consequences of agricultural technology in SSA.
Numerous authors (e.g., Ariga et al., Reference Ariga, Mabaya, Waithaka, Wanzala-Mlobela, Ariga, Mabaya, Waithaka and Wanzala-Mlobela2019; Barrett et al., Reference Barrett, Islam, Malek, Pakrashi and Ruthbah2021; Binswanger-Mkhize and Savastano, Reference Binswanger-Mkhize and Savastano2017; Burke et al., Reference Burke, Jayne and Black2017, Reference Burke, Frossard, Kabwe and Jayne2019; Channa et al., Reference Channa, Chen, Pina, Ricker-Gilbert and Stein2019; Danso-Abbeam and Baiyegunhi, Reference Danso-Abbeam and Baiyegunhi2018; Jindo et al., Reference Jindo, Schut and Langeveld2020; Jones-Garcia and Krishna, Reference Jones-Garcia and Krishna2021; Kumar et al., Reference Kumar, Takeshima, Thapa, Adhikari, Saroj, Karkee and Joshi2020; Liverpool-Tasie et al., Reference Liverpool-Tasie, Omonona, Sanou and Ogunleye2017; Liverpool-Tasie, Reference Liverpool-Tasie2017; Ng’ombe, Kalinda, and Tembo Reference Ng’ombe, Kalinda and Tembo2017; Manda et al., Reference Manda, Alene, Tufa, Abdoulaye, Kamara, Olufajo, Boukar and Manyong2020; Wainaina et al., Reference Wainaina, Tongruksawattana and Qaim2016, Reference Wainaina, Tongruksawattana and Qaim2018) have examined the determinants and impacts of agricultural technology adoption over the years. De Janvry and Sadoulet (Reference De Janvry and Sadoulet2002) demonstrated that the impact of agricultural technologies can be grouped into two—those with direct and indirect effects. They argue that the direct effects are those realized through adoption specifically through increased welfare of poor farmers who adopt technological innovations. Potential benefits for them can be derived from increased productivity. The indirect effects are those realized by others who adopt technologies. More specifically, indirect effects include lower food prices, employment creation, and growth linkages. These are realized by both poor and non-poor farmers through real income.
SSA and particularly Ghana have been unable to benefit from agricultural technology advancements during the Green Revolution as compared to countries such as China and India (Pingali, Reference Pingali2014). This is claimed to be one of the many factors that limit SSA countries from reaching their potential agricultural productivity and income (Maggio and Asfaw, Reference Maggio and Asfaw2020). In recent years, several cutting-edge agricultural technologies touted to improve yields have been developed and disseminated across the developing world especially among crops like maize, rice, and cassava among others. For example, improved rice varieties and chemical fertilizers have been shown to increase yields and farm profits substantially (Bello et al., Reference Bello, Baiyegunhi and Danso-Abbeam2020; Mabe et al., Reference Mabe, Donkoh and Al-Hassan2019; McArthur and McCord, Reference McArthur and McCord2017; Yorobe et al., Reference Yorobe, Ali, Pede, Rejesus, Velarde and Wang2016). As mentioned before, despite the potential benefits of these technologies with regard to productivity and returns, their adoption among farmers in SSA remains limited and variable.
Some of the previous literature has questioned whether the reluctance in the adoption of these innovations can be linked to the heterogeneity and uncertainty on their returns (Magnan et al., Reference Magnan, Spielman, Lybbert and Gulati2015; Suri, Reference Suri2011). For example, Liverpool-Tasie (Reference Liverpool-Tasie2017) observed that rice yield response to applied nitrogen was low in the main rice growing farming systems in Nigeria. She also observed that farmer behavior is inconsistent with expected profitability which is limited by low yield response to chemical fertilizer application, high transportation costs, and low selling prices for rice in rural areas. Similarly, Mabe et al. (Reference Mabe, Donkoh and Al-hassan2018) observed heterogeneity in rice yields among agro-ecological zones in Ghana. In a related study, Yorobe et al. (Reference Yorobe, Ali, Pede, Rejesus, Velarde and Wang2016) found that green super rice varieties have a positive and significant effects on yield and that these benefits are strongly felt when there is flooding. However, the authors were wary of the potential sensitivity of their estimates when matched samples were used.
Marenya and Barrett (Reference Marenya and Barrett2009) found a von Liebig-type nexus between soil organic matter and maize yield response to nitrogen application. In other words, crop yield is proportional to the availability of the scarcest or most limiting nutrient to plant, so increasing the availability of non-limiting nutrients has no effect on yield (von Liebig, Reference von Liebig1840). Their study established that low soil organic matter predominantly limits yield response to mineral fertilizer application. Although they found that fertilizer is, on average, profitable, one third of the plots had degraded soils, which reduced fertilizer’s marginal productivity to a point where it was unprofitable at existing prices. As a result, unlike most previous studies that have focused on average effect of agricultural technologies(e.g., Abdulai, Reference Abdulai2016; Awotide et al., Reference Awotide, Karimov and Diagne2016; Khonje et al., Reference Khonje, Manda, Alene and Kassie2015; Manda et al., Reference Manda, Alene, Tufa, Abdoulaye, Wossen, Chikoye and Manyong2019), this study fills a gap in the literature by determining the heterogeneous effects of adoption of agricultural technologies on the welfare of rice producing smallholder households in Northern Ghana.
The study contributes to the literature in the following ways. First, we contribute to the ongoing debate about the heterogeneity and uncertainty of the returns to agricultural technology adoption decisions. Suri (Reference Suri2011)’s argument that improved agricultural technologies is unanimously adopted by farmers in developing countries, and that even where they have been adopted, adoption rates have been remarkably low, highlighting the need for more research. This study contributes to the analysis of comparative advantage, that is, the relative productivity of a farmer adopting improved over unimproved agricultural technology in agricultural technology adoption decisions (Suri, Reference Suri2011), its development policy relevance, and distribution on smallholder household welfare variables.
Second, most studies on the impact of agricultural technologies assume homogenous treatment effects using methods such as propensity score matching (PSM), Heckman’s treatment effect model, or endogenous switching regression (ESR) approaches (e.g., Abdulai, Reference Abdulai2016; Khonje et al., Reference Khonje, Manda, Alene and Kassie2015; Ng’ombe, Kalinda, and Tembo Reference Ng’ombe, Kalinda and Tembo2017; Manda et al., Reference Manda, Alene, Tufa, Abdoulaye, Wossen, Chikoye and Manyong2019). Among the shortcomings of PSM are that it only accounts for observables (e.g., Abdulai and Huffman, Reference Abdulai and Huffman2015; Di Falco et al., Reference Di Falco, Veronesi and Yesuf2011). The Heckman treatment effect model is estimated in two steps, resulting in heteroskedastic residuals that cannot be used to obtain consistent standard errors without adjustments (Lokshin and Sajaia, Reference Lokshin and Sajaia2004). While the ESR accounts for selection bias by aggregating the unobservable heterogeneity, this heterogeneity varies across individuals. Heckman et al. (Reference Heckman, Humphries and Veramendi2018) contend that the benefits of technology adoption vary by agent (e.g., farmers). Failure to account for this heterogeneity may result in incorrect treatment effects estimation of adoption. While each of these methods has its own appeal and distinction, they may not be appropriate in some settings where modeling heterogeneous causal effects is the goal. This study employs the marginal treatment effects (MTEs) approach to account for treatment effect heterogeneity in both observed and unobserved characteristics (Cornelissen et al., Reference Cornelissen, Dustmann, Raute and Schönberg2018). This is achieved through the use of the generalized Roy model along the realm of Heckman and Vytlacil (Reference Heckman and Vytlacil2005)’s MTEs estimation procedure. The generalized Roy model is an extension of the Roy’s (1951) model which includes a non-pecuniary component in the decision equation and allows for uncertainty on the potential outcomes.
In particular, the MTE approach estimates a continuum of treatment effects along the whole distribution of farmer’s unobserved resistance to adoption (Frölich and Sperlich, Reference Frölich and Sperlich2019). Furthermore, while the MTE approach permits for estimation of common estimands (i.e., average treatment effect (ATE), average treatment effect on the treated (ATT), average treatment effect on the untreated (ATU), and local average treatment effect (LATE)), it also provides estimation of policy-relevant treatment effects (PRTEs) (Cornelissen et al., Reference Cornelissen, Dustmann, Raute and Schönberg2016). As a result, the method enables researchers to extrapolate causal effects beyond complier subpopulations for more credible policy relevance. Notable studies that have used the MTE framework in agricultural and applied economics in a context similar to ours include Adam and Abdulai (Reference Adam and Abdulai2022), Bedi et al. (Reference Bedi, Azzarri, Hundie Kotu, Kornher and von Braun2022), Shahzad and Abdulai (Reference Shahzad and Abdulai2021), Dubbert et al. (Reference Dubbert, Abdulai and Mohammed2023), Sarr et al. (Reference Sarr, Ayele, Kimani and Ruhinduka2021), and Franco et al. (Reference Franco, Dávalos and Morales2021).
Adam and Abdulai (Reference Adam and Abdulai2022) used the MTE framework to examine the heterogeneous causal effects of conservation agricultural practices on farm performance and inorganic fertilizer use in Ghana. Meanwhile, Bedi et al. (Reference Bedi, Azzarri, Hundie Kotu, Kornher and von Braun2022) used the MTE model to determine the average and heterogeneous impacts of adoption of sustainable intensification practices on maize yield and net returns in Northern Ghana, while Dubbert et al. (Reference Dubbert, Abdulai and Mohammed2023) investigated the impact of cashew farmers’ participation in contract farming on sustainable farm practices in Ghana. Additionally, Sarr et al. (Reference Sarr, Ayele, Kimani and Ruhinduka2021) used the MTE model to determine the impacts of a rain-fed variant of the system of rice intensification on expected yields, yield variability, and yield’s exposure to downside risk in Tanzania. Using a MTEs model and agriculture microdata from Colombia, Franco et al. (Reference Franco, Dávalos and Morales2021) examine the heterogeneous effects technical assistance services on agricultural production where they found significant heterogeneity in the impacts of technical assistance on agricultural production. Given these prior studies, our study is one of the earliest to provide empirical results on the heterogeneous impacts of a distinct set of agricultural technologies on rice yield and household dietary diversity scores (HDDS).
The rest of the paper is organized as follows. The next section presents the estimation framework, while Section 3 presents the data and descriptive statistics. Section 4 presents the results and discussion. The last section provides the conclusions and policy implications.
2. Estimation Framework
Following the approach of Cornelissen et al. (Reference Cornelissen, Dustmann, Raute and Schönberg2018), this study employs the MTE framework. The MTE framework employs the generalized Roy model, which is based on a potential outcomes model and a latent variable discrete choice model for selection into treatment, as described by Heckman and Vytlacil (Reference Heckman and Vytlacil2007). Given the potential net gains from adoption, we assume that the household head’s decision to adopt agricultural technology will impact on household welfare. Thus, if the net potential benefits, which are latent, are greater than the benefits of non-adoption, a household head will adopt these technologies. In other words, the adoption decision is expected to impact on household welfare outcomes.
We assume that adoption is binary, indicated by T i , with Y 1i and Y 0i representing the potential outcome for the ith farmer in the adoption of an agricultural technology (T i =1) and non-adoption (T i =0) states, respectively. We model the potential outcomes as
 $$ K\left(P\right) Y_{1i}=\mu _{1}\left(X_{i}\right)+\varepsilon _{1i}, $$
 $$ Y_{0i}=\mu _{0}\left(X_{i}\right)+\varepsilon _{0i}, $$
where μ(X i ) is the conditional mean of Y i given X i (which is a vector of observed exogenous characteristics) and ϵ 1i and ϵ 0i are the error terms. Equations (1) and (2) denote the treatment effect of the ith farmer, which is the difference between the potential outcomes in the adoption and non-adoption states, which is given as
 $$ Y_{1i}-Y_{0i}=\mu _{1}\left(X_{i}\right)-\mu _{0}\left(X_{i}\right)+\varepsilon _{1i}-\varepsilon _{0i}, $$
which indicates the benefits from adoption are allowed to vary across farmers with different observed (X) and unobserved (ϵ 1,ϵ 0) characteristics, an essential part of our study that emphasizes heterogeneity in the impact of agricultural technology adoption.
We model the adoption of agricultural technology decision under the assumption that farmers are risk neutral and consider the net benefit (T i *) derived from adoption and non-adoption of agricultural technologies. Thus, the ith farmer will adopt (T i =1) if T i * > 0. Since T i * is the latent propensity to adopt and cannot be observed, we specify it as a function of observed variables (Z) and an unobserved (V):
 $$T_i^* = {\mu _T}({Z_i}) - {V_i},{\rm{ }}{T_i} = 1\ {\rm{ if }}\ T_i^* \ge 0,{\rm{ and }}\ {T_i} = 0\ {\rm{ otherwise}}$$
where Z includes the same covariates X i as in the outcome equations (1)–(2) as well as an instrument used for model identification, that is, Z includes a variable that enters selection equation (4) but is excluded from outcome equations (1)–(2).
Following Kubitza and Krishna (Reference Kubitza and Krishna2020)’s recommendation for an instrumental variable (IV) for adoption and impact studies like ours, the IV employed in this study is the distance to the nearest market for technology adoption. Distance to the nearest input market is associated with transactions costs, and it takes longer for farmers in rural areas to reach such markets. The distance to input markets may represent how remote farmers are (Ng’ombe et al., Reference Ng’ombe, Kalinda and Tembo2017), and in most cases, farmers would likely spend their limited resources on transportation to reach the markets in order to access the technology. Therefore, the distance to the nearest input market is expected to influence agricultural technology adoption in this paper.
While the validity of this IV may hold in most cases in the short term, we agree with Kubitza and Krishna (Reference Kubitza and Krishna2020) that distance to the nearest market may not hold in the long run, especially when farmers migrate and relocate their farms or plots near input markets. As a result, we formally verify the validity of our instrument through a simple falsification test, in which an IV is considered valid if it significantly affects adoption of technology but has no effect on the outcome variable for non-adopters of the technology (Di Falco et al., Reference Di Falco, Veronesi and Yesuf2011; Asfaw et al., Reference Asfaw, Shiferaw, Simtowe and Haile2011; Di Falco and Veronesi, Reference Di Falco and Veronesi2013). The falsification test is plausible and has widely been used in several empirical impact papers in agricultural and applied economics (e.g., Asfaw et al., Reference Asfaw, Shiferaw, Simtowe and Lipper2012; Di Falco et al., Reference Di Falco, Veronesi and Yesuf2011; Di Falco and Veronesi, Reference Di Falco and Veronesi2013; Abdulai, Reference Abdulai2016; Lu et al., Reference Lu, Addai and Ng’ombe2021a; Michler and Josephson, Reference Michler and Josephson2017; Mojo et al., Reference Mojo, Fischer and Degefa2017; Ng’ombe et al., Reference Ng’ombe, Kalinda and Tembo2017; Noltze et al., Reference Noltze, Schwarze and Qaim2012; Shahzad and Abdulai, Reference Shahzad and Abdulai2021, and Bedi et al., Reference Bedi, Azzarri, Hundie Kotu, Kornher and von Braun2022, among others).
In principle, the falsification test involves estimation of a probit model of adoption of agricultural technology on the instrument and then conducting a Wald test to check the statistical significance of the instrument. If the Wald test yields statistically significant results for the IV in the probit model, an ordinary least squares (OLS) regression of the respective outcome variable on the potential IV is performed, but only on the non-adopters’ sample. To determine whether the IV has no effect on the outcome variable, an F-test assessing the significance of the IV coefficient in the OLS regression needs to be conducted. The following sections discuss statistical tests that confirm the validity of our IV.
The error term V i enters the selection equation (4) with a negative sign and represents unobserved characteristics that make farmers less likely to adopt agricultural technology. This V i is often described in the literature as unobserved “resistance” or “distaste” to treatment (Cornelissen et al., Reference Cornelissen, Dustmann, Raute and Schönberg2018), indicating that farmers with high values of V (low propensity scores) are less likely to adopt agricultural technologies than those with low values of V (high propensity scores).
In the MTE literature, it is common to capture the treatment effect against the quantiles of V rather than absolute values, using the following transformation of the selection rule in equation (3) (Cornelissen et al., Reference Cornelissen, Dustmann, Raute and Schönberg2018):
 $$ \mu _{D}\left(Z_{i}\right)-V_{i}\geq 0\Leftrightarrow \mu _{D}\left(Z_{i}\right)\geq V_{i}\Leftrightarrow F\left(\mu _{D}\left(Z_{i}\right)\right)\geq F\left(V_{i}\right), $$
where F() denotes the cumulative distribution function of V. The term F(μ D (Z i )), also represented by P(Z i ), is the propensity score (a farmer’s probability of adopting an agricultural technology) and F(V i ), represented by F(V i ) ≡ U Di , is the quantiles of the distribution of V.
To identify the parameters of the models, we assume that the identifying instrument, $\tilde{Z}$
, is statistically independent of the unobserved components of the outcome and selection equations (ϵ
0,ϵ
1,V) given the observable characteristics (i.e.,
$\tilde{Z}$
, is statistically independent of the unobserved components of the outcome and selection equations (ϵ
0,ϵ
1,V) given the observable characteristics (i.e., $(\varepsilon _{0},\varepsilon _{1},V),\bot \tilde{Z}|X$
). This assumption further requires that, conditional on X,
$(\varepsilon _{0},\varepsilon _{1},V),\bot \tilde{Z}|X$
). This assumption further requires that, conditional on X, $\tilde{Z}$
can only affect the outcome variables through its influence on adoption (referred to as exclusion restriction).
$\tilde{Z}$
can only affect the outcome variables through its influence on adoption (referred to as exclusion restriction).
In line with Cornelissen et al. (Reference Cornelissen, Dustmann, Raute and Schönberg2018), we also assume that the MTE is additively separable into observed and unobserved components:
 \begin{align}MTE(x,{u_D}){\rm{ }} &= E({Y_{1i}} - {Y_{0i}}|{X_i} = x,{U_{Di}} = {u_D})\\
&{\rm{ = }}\underbrace {x({\delta _1} - {\delta _0})}_{{\rm{Observed}}\;{\rm{component}}} + \underbrace {E({\varepsilon _{1i}} - {\varepsilon _{0i}}|{X_i} = x,{U_{Di}} = {u_D})}_{{\rm{Unobserved}}\;{\rm{component}}},\end{align}
\begin{align}MTE(x,{u_D}){\rm{ }} &= E({Y_{1i}} - {Y_{0i}}|{X_i} = x,{U_{Di}} = {u_D})\\
&{\rm{ = }}\underbrace {x({\delta _1} - {\delta _0})}_{{\rm{Observed}}\;{\rm{component}}} + \underbrace {E({\varepsilon _{1i}} - {\varepsilon _{0i}}|{X_i} = x,{U_{Di}} = {u_D})}_{{\rm{Unobserved}}\;{\rm{component}}},\end{align}
where (δ 1−δ 0) represent the difference in the treatment effect between the adoption and the non-adoption rates. This assumption enables the MTE to be identified over the unconditional support of the propensity score, which is generated by both the instrument and the observed covariates, X i , instead of the support of the propensity score conditional on X i = x (Brinch et al., Reference Brinch, Mogstad and Wiswall2017). Basically, the propensity score in our case is the probability of adopting agricultural technology given the observed characteristics X i .
We employ the method of local IVs to estimate the MTEs (Cornelissen et al., Reference Cornelissen, Dustmann, Raute and Schönberg2018). The outcomes in equations (1)–(2) yield the following outcome equation, conditioned on the observed covariates, X, and propensity score, P(Z):
 $$ E\left(Y|X,P\right)=X_{l}\delta _{o}+X_{l}\left(\delta _{1}-\delta _{0}\right)P+K\left(P\right), $$
where K(P) is a nonlinear function of the propensity score (P). Thus, the MTE equals the derivative of equation (7) with respect to the propensity scores (Carneiro et al., Reference Carneiro, Lokshin and Umapathi2017):
 $${\rm MTE}\left(X_{i}=x,U_{Di}=P\right)={\partial E\left(Y|X,P\right) \over \partial P}=X\left(\delta _{1}-\delta _{0}\right)+{\partial K\left(P\right) \over \partial P}$$
Our estimation procedure has two stages. We first obtain propensity score estimates from a first-stage probit estimation from selection equation (4) and then proceed to model K(P) as a polynomial in P of degree k. Thus, we estimate the impact of adoption of agricultural technology in the second stage (Cornelissen et al., Reference Cornelissen, Dustmann, Raute and Schönberg2018):
 $$ Y_{i}=X_{i}\delta _{0}+X_{i}\left(\delta _{1}-\delta _{0}\right)P+\sum _{k=1}^{K}\alpha _{k}P^{k}+\varepsilon _{i} $$
The derivative of equation (9) with respect to P delivers the MTE curve. We estimate the model using a second-order polynomial (k=2) in the propensity scores.
To ascertain the sensitivity of the MTE to the functional form assumed, we also estimated MTE curves as robustness check. As indicated by Heckman and Vytlacil (Reference Heckman and Vytlacil2005), the MTE can be aggregated over in different ways to obtain the ATEs, ATTs, ATUs, and LATEs. It also delivers estimation of PRTEs (Cornelissen et al., Reference Cornelissen, Dustmann, Raute and Schönberg2018). Following Huntington-Klein (Reference Huntington-Klein2021), the ATE is the average impact of agricultural technology on the outcome of interest on all farmers in the sample while the ATT (ATU) is the average impact of those that adopted (did not adopt) the technology. LATE, on the other hand, is defined by the IVs used (because compliers are defined in relation to the instrument) and therefore does not necessarily represent a treatment parameter for an economically interesting group of the population (Angrist et al., Reference Angrist, Imbens and Rubin1996; Heckman et al., Reference Heckman, Hidehiko and Todd1997; Heckman and Urzúa, Reference Heckman and Urzúa2010). All these estimands are useful to comprehensively summarize the impacts of agricultural technology and help to answer economic policy questions.
Considering the interest in evaluating the impact of policy intervention of reducing the distance to a maximum of 3 km to the technology source on the returns to adoption, the PRTEs are used in this paper to estimate the aggregate effects of such policy changes (Heckman and Vytlacil, Reference Heckman and Vytlacil2005). The idea is to reduce the transaction cost of acquiring agricultural inputs. Transaction costs have been hypothesized to impact the adoption of technologies among farmers (Adam and Abdulai, Reference Adam and Abdulai2022). The 3 km distance is the average distance to the major Ministry of Agriculture input shop in the districts. This is expected to have implications on the adoption of agricultural technologies by farmers. It is observed that 72% (652) of the sampled farmers had their household being more than 3 km from the nearest market. The PRTE is the average effect of switching from a baseline policy to an alternative policy per net farmer shifted. Thus, we simulate the baseline and alternative policies under the assumption that the distance to an input market is reduced by up to 3 km, resulting in a weighted difference between the ATT under the alternative policy and the ATT under the baseline policy. The PRTE conditional on X i = x is defined as
3. Data and Descriptive Statistics
The study utilizes data from a farm household survey undertaken in Northern Ghana from October to December 2018. The sampled farm households were from the Northern, Upper East, and Upper West Regions of Ghana. The sample used in this study comprised 900 farm households with 300 from each region. During data collection, a multistage sampling technique was employed in choosing the farm households. The first stage was a purposive selection of the Northern Zone of Ghana. The Northern Ghana was purposively selected because the zone constitutes the biggest rice producing area and has high poverty rates in Ghana (GSS, 2020), attributed to the higher rate of subsistence farming. The zone comprises the former Northern, Upper East, and Upper West regions of Ghana. The second stage involved the selection of a district from each region based on their high level of rice production. The selected districts were Savelugu (Northern Region), Nadowli-Kaleo (Upper West), and Kassena Nankana East (Upper East). The third stage was a random selection of villages or communities from the operational areas of the Ministry of Food and Agriculture. The final stage involved random selection of rice farm households from the different communities according to their size or the number of rice farm households in the various communities. The data collected included various rice production variables and characteristics of farm households in the study area using a structured questionnaire. The variables captured with regard to this study are described in Table 1.
Table 1. Variable definitions, descriptive statistics, and mean difference between adopters and non-adopters

Notes: ***, **, and * indicate statistical significance at 1%, 5%, and 10% level, respectively.
Following Mishra et al. (Reference Mishra, Sam, Diiro and Miranda2020), Suri (Reference Suri2011) and as a principle, agricultural technology adoption could be measured as a continuous variable in terms of quantities of inputs used; however, due to unreliable data on their quantities, technology adoption is considered binary in this study, as is the norm in the adoption literature. Rice production technologies adopted include improved rice seeds, chemical fertilizer, and herbicidesFootnote 1 (Asuming-Brempong et al., Reference Asuming-Brempong, Gyasi, Marfo, Diagne, Wiredu, Asuming-Boakye, Haleegoah and Frimpong2011; Ragasa et al., Reference Ragasa, Dankyi, Acheampong, Wiredu, Chapoto, Asamoah and R.2013). Agricultural technology adoption is defined in this study as adoption of at least one of these technologies (improved rice seeds, chemical fertilizer, and herbicides). From our sample, the correlations between the adoption rates of the technologies are improved rice seed and chemical fertilizer (r=0.1734; p<0.000); improved rice seed and herbicide (r=0.0305; p<0.3609); and chemical fertilizer and herbicides (r=0.1390; p<0.0000).
The outcome variables are rice yield and household dietary score. The HDDS is a measure of household food security. The HDDS is constructed based on the number of food groups consumed by the household during a given period. Food items were categorized into 12 different groups, as proposed by the FAO of United Nations (FAO, 2011). The 12 food groups are cereals, tubers, and roots; legumes; vegetables; meat; eggs; fish and other sea-food; fruits; milk and milk products; oil and fats; sweets; and spices and condiments and beverages. Each food group adds one score toward the HDDS if a food item from that group was consumed by any member of the household in a given 7-day period. Thus, the HDDS ranges from 0 to 12. The use of dietary diversity score is considered superior to calorie intake totals, among others, as it reflects the food availability and accessibility aspects of food security (Ruel, Reference Ruel2003; WFP, 2009). Thus, a diversified diet is associated with the financial ability of the household to access a variety of foods by obtaining many different food groups consumed during the period. Increased dietary diversity is linked with socioeconomic status and household food security (Huluka and Wondimagegnhu, Reference Huluka and Wondimagegnhu2019).
Table 1 also includes a description, summary statistics, and mean differences between agricultural technology adopters and non-adopters. Adopters have higher rice yield and HDDS than non-adopters, and the differences are statistically significant. In terms of the gender, it is observed that the majority of farmers are males, reflecting the dominance of males in African society in all spheres of life. Adopters are on average younger than non-adopters, and the difference is statistically significant. This may reflect the conservative nature of old farmers when it comes to adopting agricultural innovations. Even though the difference is not statistically significant, adopters and non-adopters have the same household size, years of schooling, and credit access. Adopters had greater access to extension than non-adopters, which is bound to influence their adoption decisions. Adopters of agricultural technologies have larger farms than non-adopters, and the difference is significant. Adopters also earn significantly higher off-farm income than non-adopters. This may give adopters some advantage in the procurement of agricultural technologies especially those that are capital intensive.
Moreover, the non-adopters of agricultural technologies appear to own more livestock than adopters, even though the difference in livestock ownership is not significantly different from zero. Livestock is a valuable asset in the acquisition of agricultural innovations. Kiwanuka-Lubinda, Ng’ombe, and Machethe (Reference Kiwanuka-Lubinda, Ng’ombe and Machethe2021), and Lubungu et al. (Reference Lubungu, Chapoto. and Tembo2012) observe that smallholder farmers rear livestock for a variety of reasons, including cash, manure, meat, milk, draught power, and traditional ceremonies. Farmers may be able to purchase improved rice seeds, chemical fertilizer, and/or herbicides with money earned from the sale of livestock products. Table 1 shows that adopters of agricultural technology in the current study seemed had fewer livestock than their counterparts. When compared to non-adopters, most adopters of agricultural technologies do not own land. There exist significant regional disparities between adopters and non-adopters. On average, adopters travel longer kilometers to access a nearby market than non-adopters.
4. Results and Discussion
4.1. Factors Influencing Agricultural Technology Adoption
Table 2 reports the marginal effects of the factors influencing agricultural technology adoption. As previously indicated, market distance is used as an identifying instrument for the estimations. The Wald test is used to determine the joint significance of the excluded instrument in the outcome equation. The value of the Wald statistic (282.85) is statistically significant at 5% significance level indicating that the IV highly influences adoption decisions. To test the validity of the selection instrument, an F-test was conducted after an OLS regression of the outcome variables on the instrument among non-adopters of agricultural technology. As explained in Section 2, such a falsification test requires that the instrument should not significantly affect the outcome variables among non-adopters (Di Falco et al., Reference Di Falco, Veronesi and Yesuf2011), and our results showed that the instrument does not influence the outcome variables among non-adopters (p-value < 0.05), indicating the instrument’s validity. As a result, the instrument was removed from the outcome equations during the estimation of both the selection and outcome equations. For consistency, the same covariates are used to analyze all the dependent variables (rice yield and HDDS), and therefore the probit regression results from the first-stage estimation are similar for all the specifications. In the interest of brevity, we have combined their interpretations. For rice yield and HDDS, the first-stage probit model generates a large common support for the propensity score, which ranges from 0.1 to at least 0.96 (Figure 1). This satisfies the MTE estimation requirement that instruments generate enough common support. In addition, Rubin’s diagnostic statistics “R” and “B” to assess PSM performance was used. A PSM estimator is deemed appropriate when the B-statistic is less than 25% and the R statistic is between 0.5 and 2 (Rosenbaum and Rubin, Reference Rosenbaum and Rubin1984). After matching, our results showed a B-statistic of 6.4 and R statistic of 1.19 which confirmed that the nearest neighbor estimator was appropriate. Both the selection equation and the second-stage outcome models were estimated simultaneously. The estimation was implemented in Stata (StataCorp, 2021) using the mtefe module by Andresen (Reference Andresen2018).

Figure 1. Common support (frequency distribution of the propensity score by adoption status).
Table 2. Factors influencing agricultural technology adoption

Note: dy/dx and Std. Err designate marginal effect and robust standard errors, respectively; ***, **, and * indicate statistical significance at 1%, 5%, and 10% level.
The key drivers that significantly influence the adoption of agricultural technology are farm size, extension access, off-farm income, land ownership, regional dummy of Northern region, and market distance. Farm size positively and significantly influenced the adoption of agricultural technologies. This implies that a hectare increases in the farm size is associated with a 37.1 percentage point increase in the adoption of agricultural technologies such as chemical fertilizer, improved rice seed, and herbicides. One plausible reason is that farmlands are sometimes used as measures of wealth, and households with larger farm sizes are more likely adopt agricultural technologies. This is consistent with the findings of Anang and Amikuzuno (Reference Anang and Amikuzuno2015). Adoption of agricultural technologies is positively and significantly associated with extension access. This is in line with the findings of Wossen et al. (Reference Wossen, Abdoulaye, Alene, Haile, Feleke, Olanrewaju and Manyong2017), who asserted that extension access has a positive and significant impact on technology adoption and household welfare in rural Nigeria.
The coefficient of off-farm income is positive and significant, suggesting that an increase in a farmer’s off-farm income is associated with an increase in agricultural technology adoption. This is consistent with the findings of Diiro and Sam (Reference Diiro and Sam2015) in Uganda, which found that nonfarm income has a positive and significant relationship with the adoption of improved maize seed. The likelihood of adopting agricultural technologies is negatively associated with land ownership. This implies that tenants of farmlands are more likely to adopt technologies, which is consistent with the findings of Mansaray et al. (Reference Mansaray, Jin and Horlu2019). Mansaray et al. (Reference Mansaray, Jin and Horlu2019) observed that farmers in Sierra Leone using rented land adopted Rokupr (commonly known as ROK) rice varieties quicker than those cultivating their own land. Furthermore, the study found that sharecropping farmers adopted New Rice for Africa (NERICA) varieties at a faster rate than landowners. Using Upper West region as the reference point, farmers in the Northern region of Ghana are 25.6% more likely to adopt agricultural technologies. This supports the findings of Lu et al. (Reference Lu, Addai and Ng'ombe2021b), who observed that farmers in the Northern region of Ghana were more likely to adopt improved rice varieties.
The distance to the nearest market source of agricultural technology is a strong predictor of adoption, and as expected, the marginal effect of market distance indicates a strong relationship between the availability of agricultural technologies and the decision to adopt. More specifically, it suggests that an increase in the distance that a farmer travel is associated with a marginal increase in the adoption of agricultural technologies. This result is counterintuitive because an increase in market distance is expected to increase transaction costs, thereby negatively impacting agricultural technology adoption. The chi-squared test statistic of the excluded instruments at the tail end, which is based on the market distance variable, is presented in Table 2. The null hypothesis that the IV is not relevant is rejected at 1% significance level due to its higher value and p-value < 0.000.
4.2. Heterogeneity in Treatment Effects in Observed Characteristics (Rice Yield)
Table 3 shows the estimates of the untreated (non-adoption(γ 0)) state in column (2) and treatment (adoption(γ 1−γ 0)) state in column (3) on the effect of adoption on the impacts of the independent variables on rice yield. Table 3 shows a positive and significant relationship between the age of the household head and non-adoption of agricultural technologies, indicating that an increase in the age of household head is associated with a decrease in rice yield. This could be because older farmers tend to be more conservative in their farming practices, making them less efficient in their operations and, as a result, leading to lower rice yield. On the other hand, non-treatment results in a higher rice yield (0.397 points). This appears to be counterintuitive, and it raises the possibility that other factors are at work.
Table 3. Log of rice yield

Note: Columns 1 and 2 report the estimates in the untreated state and the adoption state (difference between the treatment and untreated states), respectively. The reported test of heterogeneity shows whether the treatment effect (γ 1−γ 0) varies across the observed covariates. Bootstrapped standard errors are presented with 100 replications. ***, **, and * indicate statistical significance at 1%, 5%, and 10% level.
In the treatment state, older farmers have lower rice yields than younger farmers, highlighting the view that less farming experience may not help in boosting crop productivity. The negative and significant coefficient of household size in the untreated state in Table 3 shows that larger household sizes tend to have lower rice yield, which could be the case when there are few persons in a household available for farm work but more children would not provide any farm labor. However, the coefficient of farm size in Table 3 is positive and significant in the untreated state, indicating that farmers with more hectares of farm will have higher rice yield, but the result is positive but not significantly different from zero in the adoption state.
The statistically significant and negative effect of extension access in both tables indicates that access is associated with lower rice yield in the non-adoption state, whereas the coefficient is positive and statistically significant in the treatment state. This highlights the importance of extension in assisting farmers to adopt agricultural innovations that can increase yield. In the untreated state, farmers who have off-farm income had lower rice yield. On the other hand, in the adoption state, farmers with higher off-farm income tend to have produce higher rice yield. This is because the income can be used to purchase inputs such as chemical fertilizers, improved rice seeds, and herbicides. Farmers in the Upper East region, in both the non-adoption and adoption states, produced significantly more rice than those in the Upper West region of Ghana. Moreover, in the treatment state, farmers in the Northern region tend to realize more rice yield than those from the Upper West region, implying that adoption of agricultural technologies may have regional-specific heterogeneities on rice yields.
4.3. Heterogeneity in Treatment Effects in Observed Characteristics (HDDS)
Table 4 displays the second-stage estimations for HDDS at the untreated state in column (2) and the gains from treatment in column (3). The positive and significant coefficients of gender at the non-adoption state suggest that being a male farmer is more likely to increase HDDS by 0.069% than being female, but adopting these technologies is associated with a 0.089% drop in HDDS among male household heads than females. Women are noted for their “food first” plan and mostly raise conventional crops purposely for family consumption and have less market values, while men target cash crops. The cultivation of cash crops for the market normally may not contribute much to household dietary diversity as the farm households may produce to sell and purchase other household needs other than food (Mulenga et al., Reference Mulenga, Ngoma and Nkonde2021). Years of schooling in the untreated state tend to increase HDDS but decrease it in the treatment state. This is more likely to be the case when farmers have had years of farming experience and have learned how to navigate the process of improving household food security. Relative to the Upper West region, an untreated farmer in the Northern region is associated with 0.0241 points lower HDDS, demonstrating the importance in these outcome variables.
Table 4. Log of household dietary diversity score (HDDS) equation
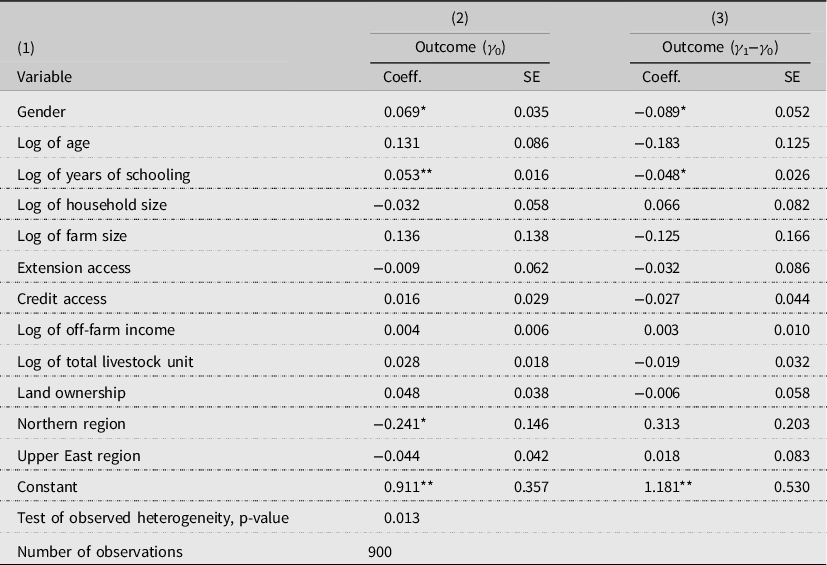
Note: Columns 1 and 2 report the estimates in the untreated state and the adoption state (difference between the treatment and untreated states), respectively. The reported test of heterogeneity shows whether the treatment effect (γ 1−γ 0) varies across the observed covariates. Bootstrapped standard errors are presented with 100 replications; ***, **, and * indicate statistical significance at 1%, 5%, and 10% level.
4.4. Average and MTEs Estimates
In this section, we discuss the MTE curves reported in Figures 2 and 3. These depict the MTE estimates evaluated at the average values of the observed covariates. The 95% confidence intervals presented under the MTE curves are based on the bootstrapped standard errors with 100 replications. This section helps in ascertaining whether farmers benefit from the adoption of agricultural technology and how these effects differ with regard to their unobserved characteristics. The MTE curves show whether farmers who are more likely to adopt agricultural technologies based on unobservable characteristics have higher benefits from being treated. Seemingly, farmers with more probability of adoption realize better yields.
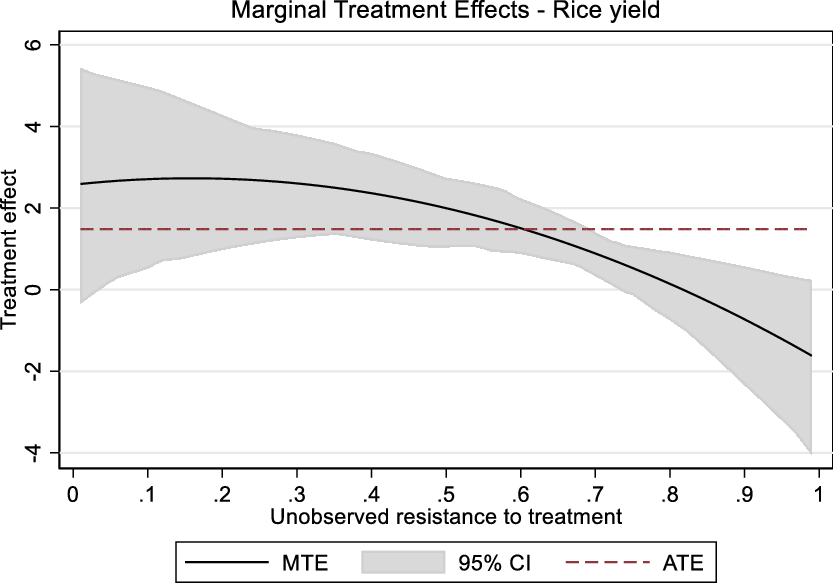
Figure 2. MTE curve for rice yield.

Figure 3. MTE curve for household dietary diversity score (HDDS).
From Figure 2, it is evident that farmers with lower unobserved resistance to adoption of agricultural technology get the higher benefits and obtain more rice yield. The figure indicates that the observed resistance to adoption increases with decreasing gains from adoption, suggesting positive selection on gains. Thus, the lower level of unobserved resistance to adoption is linked with the higher rice yield, but yield tends to decrease as the unobserved resistance to adoption increases. In this figure, a positive pattern of selection on unobserved gains from treatment of agricultural technology is observed in rice yield. This finding is due to the fact that farmers who are more likely to adopt agricultural technology benefit more from adoption, whereas farmers who are less likely to adopt benefit more than the average farmer in the untreated state. This is consistent with the idea of adoption based on comparative advantage (Suri, Reference Suri2011). The p-values in Table 3 for test of heterogeneity show that selection based on unobserved gains is statistically significant (a null hypothesis of zero slope of the MTE curve is rejected at 1% significance level) for rice yield.
In addition, Figure 3 presents the MTE curve for HDDS. The curve is downward sloping, indicating that the gains from adoption decrease with increasing resistance to adoption. This shows a pattern of positive selection on gains. Thus, farmers who are more probable to adopt agricultural technologies get greater benefits from adopting in terms of diversified food. The lower their unobserved resistance to agricultural technologies, the more the gains from adoption and eventually food security through increased HDDS scores.
Table 5 provides a summary of the average gains from the adoption of agricultural technologies by rice-producing households. It is evident that the measures of treatment effect indicate possible treatment effect heterogeneity among rice-producing households. A general picture of the estimates shows that the ATT is greater than the ATE, which is also greater than the ATUT. This is indicative of positive selection on gains, where household heads who are probable to adopt (likely due to their inborn tendencies or variation in the quality of adoption and rice production conditions) tend to benefit more from adoption in terms of rice yield and HDDS. The ATE estimates for rice yield and HDDS are 1.483 and 0.483, respectively. The implication is that the selection of farmers randomly from the population of farmers and the adoption of agricultural technology increase rice yield by 148.3 percentage points and 48.3 percentage points for HDDS. With regard to the ATT, we find that, farmers with high propensity scores, the gain for the average farmer for adopting is significantly higher. That is, 257.1 percentage points for rice yields and 74.5 percentage points for HDDS. On the other hand, the ATUT estimates for all the outcomes are not statistically significant, indicating that the gains to adoption for adopters are higher than for both the random farmer and non-adopters. The reported LATE in Table 5 indicates that household heads who adopted agricultural technology due to closer markets to the source of the technology increased rice yield by about 142.3 percentage points and HDDS by about 29 percentage points.
Table 5. Estimates of treatment effects parameters
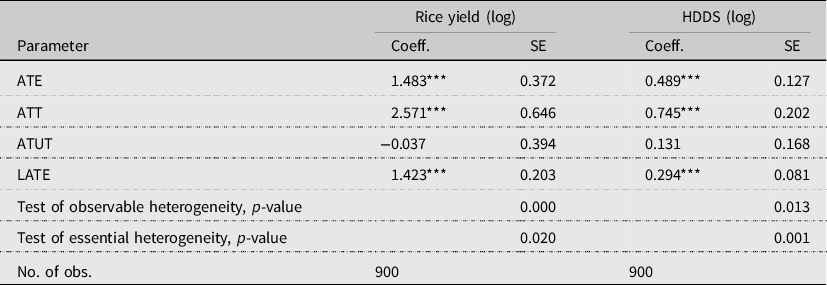
Note: The table shows that average treatment effects (ATE), the average treatment effect on the treated (ATT), the average treatment effects on untreated (ATUT), local average treatments on the treated (LATE), and p-value for the test observable and essential heterogeneity for the outcome variables. The standard error indicates bootstrapped standard errors with 100 replications. ***, **, and * indicate statistical significance at 1%, 5%, and 10% level.
4.5. Policy Simulations
The findings so far indicate that the adoption of agricultural technologies does not only lead to an increase in rice yield but also improves HDDS of the treated (adopters). The results also suggest potential improvement of the household welfare outcomes for the untreated (non-adopters) if they get treated. The implication is that policies meant to get around structural or systemic challenges and make farmers to adopt can be beneficial. Therefore, a policy of a reduction of the average distance of the farmer to the closest market source of the agricultural technology to a maximum of 3 km is simulated, using PRTE. This policy attempts to ensure these technologies are brought to the doorstep of farmers, thus making them easily available to them. The baseline and policy propensity scores and the PRTEs of the various outcomes are indicated in columns 2, 3, and 4 of Table 6, respectively. The estimates indicate that a reduction in the distance to the source of the technology to a maximum of 3 km shifts farmers with unobserved resistance to the adoption into adoption and a resultant significant increase in rice yield and HDDS by 109.7 and 26.9 percentage points, respectively, per farmer shifted from non-adoption into adoption.
Table 6. Policy-relevant treatment effects estimates

Note: This table reports the PRTE per farmer induced to adopt based on the policy alternative of reducing the distance to the technology source. It also presents the propensity scores from the baseline specifications of the policy. The standard error indicates bootstrapped standard errors (in parenthesis) with 100 replications. ***, **, and * indicate statistical significance at 1%, 5%, and 10% level.
5. Conclusion and Policy Implications
This study uses a farm household survey conducted among rice-producing households in Northern Ghana to examine the heterogeneity in the effect of the adoption of agricultural technologies in rice production on the welfare of households. Simple comparison of measures of various welfare outcomes by several authors has revealed differences. However, because most of the studies do not account for other confounding variables, these mean variations are insufficient to explain the effect of adoption on outcomes. Unlike previous studies in this area, this study employs the MTEs strategy to understand the heterogeneity in the impact (observed and unobserved) of adoption and what it means for policy decision making. Furthermore, the approach contributes to estimating the ATE of agricultural technology adoption by estimating the distribution of the impact along unobserved resistance to adoption. In this study, agricultural technology adoption is defined as adoption of at least improved rice seeds, chemical fertilizer, or herbicides.
The empirical findings indicate that the gains from the adoption of improved rice technologies vary significantly. It was observed that there exists a pattern of positive selection on unobserved gains from the adoption of agricultural technologies on rice yield and HDDS. The implications of these results are that the adoption of improved agricultural technologies somehow makes households homogenous across these outcomes. Thus, poor smallholder households that do not adopt can bridge the gap in rice yields and dietary diversity scores with similar farmers who do adopt agricultural technologies.
Finally, a policy simulation of reducing the distance to agricultural technology sources found that doing so would increase rice yield and HDDS. The implications of these findings are that interventions aimed at increasing technology adoption for rural farmers should, at least in part, focus on reducing production and structural constraints such as the transaction costs (e.g., distance to access them, costs of accessing them). As a result, various stakeholders in the agricultural sector and input supply chain should consider making it easier for smallholder farmers (however remote they may be) to access these technologies. Making the technologies available could occur through sales outlets at the village and community levels or through input subsidies for both cereals such as rice and other leguminous crops to boost dietary diversity (Jayne et al., Reference Jayne, Mason, Burke and Ariga2018; Khonje et al., Reference Khonje, Nyondo, Mangisoni, Ricker-Gilbert, Burke, Chadza and Muyanga2022; Mason and Ricker-Gilbert, Reference Mason and Ricker-Gilbert2013). Input subsidies are another way for governments to ensure that technologies such as improved seeds, chemical fertilizers, or herbicides reach the poorest farmers. These can be done at the local level through channels such as farmer-based organization groups (Addai et al., Reference Addai, Temoso and Ng'ombe2021; Wossen et al., Reference Wossen, Abdoulaye, Alene, Haile, Feleke, Olanrewaju and Manyong2017) and government input market outlets as empowerment or technical assistance, among others. This recommendation is similar to Franco et al.’s (Reference Franco, Dávalos and Morales2021) recommendation that technical assistance boosts agricultural production among Colombian farmers.
Although our study provides valuable insights into the heterogeneous effects of agricultural technology adoption on household welfare in developing countries, our analysis was limited by our adoption variable, which only considered those who adopted at least one of the three technologies (improved rice seeds, chemical fertilizer, and herbicides). Admittedly, this is an important caveat because, as mentioned in this paper, the adoption rates of these technologies among farmers have a low correlation (less than 0.173). This way, they could be seen as sort of independent events. Policy recommendations and conclusions based on the findings of this disconnected technology package may not be applicable to any of the three technologies that comprise it as each specific technology may have its own set of considerations. Therefore, future studies should explore the heterogeneous impacts of each technology individually to obtain a more precise understanding of their heterogeneous welfare effects and develop more targeted policy recommendations.
Data Availability Statement
The data employed in this paper are accessible on request from the corresponding author.
Author Contributions
Conceptualization, K.N.A.; methodology, K.N.A. and J.N.N.; formal analysis, K.N.A. and O.T.; data curation, K.N.A.; Writing—original draft, K.N.A., O.T., and J.N.N.; Writing—review and editing, K.N.A. and O.T.; supervision, K.N.A. and J.N.N.
Funding Statement
No funding was received for this study.
Competing Interest Statement
None declared.


 Open access