


Introduction
Financial choices permeate every aspect of our lives. Whether conscious of it or not, our everyday routines are filled with decisions about how we distribute our resources to fulfill current needs and secure a steady and pleasurable tomorrow. Achieving sound judgment in these matters requires a degree of financial literacy. Financial literacy, which entails understanding essential financial principles and possessing the capacity to perform basic financial computations (Kamiya Reference Kamiya2017; Lusardi and Mitchell Reference Lusardi, Mitchell, Lusardi and Mitchell2011), has proven to significantly influence individuals’ financial decisions and financial outcomes (see e.g., Campbell Reference Campbell2006; Hastings et al. Reference Hastings, Madrian and Skimmyhorn2013; Lusardi and Mitchell Reference Lusardi and Mitchell2014). Acknowledging the importance of financial literacy in shaping and enabling financial decisions, a multitude of worldwide research initiatives have been committed to uncovering the mechanisms underlying the acquisition of financial literacy and its relationship with financial outcomes (see e.g., Santini et al. Reference Santini, Ladeira, Mette and Ponchio2019; Goyal and Kumar Reference Goyal and Kumar2021; Méndez Prado et al. Reference Méndez Prado, Franco, Zapata, García, Everaert and Valcke2022). These outcomes include, for example, having savings (Atkinson and Messy Reference Atkinson and Messy2013, Sotomayor, Talledo and Wong 2018; Roa, Garrón and Barboza 2019), avoiding high-risk credits (Santos, Mendes-Da-Silva and Gonzalez Reference Santos, Mendes da Silva and Gonzalez2018; Roa, Garrón and Barboza 2019), and diversifying investments (Abreu and Mendes Reference Abreu and Mendes2010; von Gaudecker Reference Von Gaudecker2015). This body of research has provided valuable insights into understanding the significant impact of financial literacy on individuals’ overall wellbeing (Lusardi and Mitchell Reference Lusardi, Mitchell, Lusardi and Mitchell2011; Cao-Alvira, Novoa-Hoyos and Núñez-Torres Reference Cao-Alvira, Novoa-Hoyos and Núñez-Torres2021).
However, it is important to acknowledge the differences in financial circumstances among individuals worldwide. Not all individuals enjoy access to financial education. They may also lack access to financial products, or the support needed when navigating financial decisions. For example, in some nations, the transfer of savings to a pension account is mandatory, thereby enabling substantial savings without active decision-making, while in others, the responsibility falls on individuals. These contextual variations possess the potential to shape the extent to which financial literacy impacts financial outcomes and overall wellbeing.
Consequently, cross-country comparisons are much needed (see e.g., Atkinson and Messy Reference Atkinson and Messy2013; Lusardi and Mitchell Reference Lusardi and Mitchell2014; Zarate Castañeda et al. Reference Zarate Castañeda, Chong Chong, Neyra and Mejía2019; Klapper and Lusardi Reference Klapper and Lusardi2020; Mejía and Saavedra 2022). To assess the significance of financial literacy as a determinant of sound financial decisions, it is also useful to investigate its effects across diverse economic and cultural contexts. In this paper, we investigate the extent to which people in Peru and Uruguay are equipped to make good financial decisions. This is achieved through an examination of the levels of financial literacy across distinct demographic segments, coupled with an investigation into the link between financial literacy and savings, retirement planning, as well as financial vulnerability.
We use data from the Financial Capabilities Surveys conducted by the CAF – Development Bank of Latin America – in Peru and Uruguay. The findings presented herein constitute a subset of a broader project encompassing an examination of 11 Latin American countries. Our selection of Peru and Uruguay is to focus on one big and one small country in Latin America and also a more well-off (Uruguay) and less well-off country (Peru). The evidence pertaining to other countries warrants separate publication in due course.
Moreover, a key objective of the special issue this article is contributing to is to improve our understanding of the impact of inflation on financial literacy and financial outcomes. To shed light on this matter, a deliberate choice was made to compare Peru and Uruguay, considering their different inflation trajectories. Uruguay has experienced a prolonged and consistent period of high inflation over an extended time period, whereas Peru underwent a bout of hyperinflation in the early 1990s before successfully curbing inflation from 2000 onward. In Appendix 1, graphical representations of inflation rates from 1970 to 2022 are provided for each country. These contrasting inflation experiences have the potential to provide us with a deeper understanding of how experiencing different levels of inflation over time might impact financial literacy and financial decisions.
Our findings show that a large portion of individuals in these two nations lack comprehension of essential financial concepts such as compound interest, inflation, and risk diversification. This deficiency in knowledge is particularly pronounced among women, rural residents, those with low education, individuals with lower incomes, the self-employed, the not employed, and in the case of Peru, younger individuals, while in the case of Uruguay, older individuals. We also find that financial literacy is linked to measures of financial wellbeing: those who are financially literate are more likely to be able to save and plan for retirement in both countries. In addition, we find a relationship between knowledge of specific concepts (specifically interest compounding and inflation) and key financial behaviors. Finally, we find a relationship between financial vulnerability and financial literacy.
In what follows, we begin by presenting contextual details about Peru and Uruguay, followed by an overview of the initiatives undertaken in these nations to improve financial literacy among their populations through national strategies for financial education. In “Data overview,” we describe the dataset used in the analysis and provide descriptive statistics exploring which demographic groups have higher financial literacy. In “Results,” we explore the relationship between financial literacy and financial outcomes such as savings, confidence in retirement planning, and financial vulnerability. “Discussion and conclusions” concludes.
Literature review
In this section, we provide some background information for Peru and Uruguay, outline the endeavors carried out in these two nations to increase financial literacy among their populations, and provide a brief overview of existing literature concerning the interplay between financial literacy and financial outcomes in both countries.
Background information on Peru and Uruguay
We offer hereafter a brief overview of both countries (CIA 2023). In terms of population size, Uruguay’s population is approximately one-tenth that of Peru (Uruguay: 3,416,264; Peru: 32,440,172; 2023 est.). Most people in Uruguay, 95.8 percent of its citizens, reside in urban areas, compared to Peru, where urban residents account for 78.9 percent of the population. Both nations have achieved remarkably high literacy rates among individuals aged 15 years and older, with over 90 percent proficient in reading and writing. This metric is slightly higher in Uruguay (total population: 98.8 percent; male: 98.5 percent; female: 99 percent) compared to Peru (total population: 94.5 percent; male: 97 percent; female: 92 percent).
Economically, Uruguay is classified as a high-income economy, while Peru falls under the category of an upper middle-income economy. The GDP per capita of Uruguay was US$22,800 (2021 est.) versus a GPD per capita of US$12,500 (2021 est.) of Peru. In terms of socioeconomic levels, each country has its own classification based on household characteristics and average monthly income. In the context of Peru, a monthly income of US$618 provides the threshold for characterizing individuals as belonging to the low socioeconomic status category. In contrast, those with a monthly income of US$959 are categorized as having a middle socioeconomic status, while an income of US$1,796 or more is considered indicative of a high socioeconomic standing within the Peruvian context (APEIM 2022). Similarly, in Uruguay, an average monthly income of US$260 is typically classified as low income. On the other hand, individuals with a monthly income of US$623 fall into the middle-class category, while those with an income of US$1,225 or above are regarded as representing a high socioeconomic level (CEISMU 2023) (for further details, please refer to Tables A1 and A2 in the Appendix).
According to the most recent measurements of financial access (World Bank 2021), 73 percent of the adults in Latin America and the Caribbean have a savings account. Uruguay is above this average (74 percent), while Peru is 16 percentage points below this average (57 percent). As mentioned earlier, our analysis covers a small but relatively well-off Latin American country (Uruguay) versus a bigger but not so well-off country (Peru).
Financial education programs in Peru and Uruguay
Financial education is crucial for improving financial literacy (Lyons, Chang and Scherpf Reference Lyons, Chang and Scherpf2006; Atkinson and Messy Reference Atkinson and Messy2013). Consequently, over the past decade, an increasing number of countries across Latin America have undertaken commitments to prioritize financial inclusion and education within their broader efforts to alleviate poverty, enhance financial system stability, and foster development. Many of these commitments have been formalized through comprehensive national policies known as “National Strategies,” which delineate the roadmap for initiatives in areas like financial inclusion and education. Within the realm of financial education, these National Strategies strive to implement programs and initiatives aimed at improving financial capability, which encompasses the knowledge, skills, attitudes, and behaviors of specific population groups. Notably impactful in the region are National Strategies that facilitate collaborative educational, informative, and communicative efforts among public and private sectors, academia, and civil society (Organización para la Cooperación y el Desarrollo Económicos/CAF 2020).
Peru and Uruguay have both undertaken substantial efforts in formulating and executing National Strategies or Policies for Financial Education along with dedicated National Programs. In the context of Peru, the country introduced a National Strategy for Financial Inclusion in 2015, which encompasses a National Plan for Financial Education. This comprehensive strategy evolved into a National Policy on Financial Inclusion and Education in 2019, overseen by the Financial Inclusion Committee, consisting of key public sector entities such as the Ministry of Finance, Ministry of Education, and the Banking Superintendence, among others. Uruguay, on the other hand, operates a national economic and financial education program under the auspices of the Central Bank of Uruguay. This initiative involves collaborative agreements with the Ministry of Economy and Finance, the Ministry of Education, private sector entities, and academia, although it does not have a coordinated Financial Education Strategy with a national committee.
Furthermore, both nations have undertaken assessments to measure the impact of their main financial education programs in schools. In the case of Peru, Frisancho (Reference Frisancho2019) conducted an impact evaluation of the financial education program in schools run by the Banking Superintendence, the Ministry of Education, and the Banking Association of Peru, which found positive effects not only on financial knowledge but also on financial attitudes and behaviors of students and their teachers. In addition, Frisancho (Reference Frisancho2023) showed that financial education lessons in school led to sizable effects on parental financial behavior within disadvantaged households, such as lower default probability, higher credit scores, and increased current debt levels. The treatment has stronger effects among the parents of daughters. In the case of Uruguay, Borraz et al. (Reference Borraz, Caro, Caño-Guiral and José Roa2021) conducted an impact evaluation of the economic and financial education program targeted to senior high school students and run by the Central Bank of Uruguay. The authors found that the program has a positive and significant impact on students’ knowledge.
Although Peru and Uruguay have adopted different strategies to implement national financial education programs, evidence suggests that both countries have achieved noteworthy success in enhancing the financial literacy of high school students. However, there exists limited evidence regarding the financial literacy levels of other segments of the population. Next, we present the available evidence pertaining to Peru and Uruguay, respectively.
Financial literacy in Peru and Uruguay
Regarding financial literacy levels, evidence indicates that Peru struggles with relatively low financial literacy. A comparative study encompassing 14 nations placed Peru’s average scores within the lowest bracket (Atkinson and Messy Reference Atkinson and Messy2013; OECD 2020). Shifting focus to the correlation between financial literacy and financial behavior, in Peru, higher financial literacy was found to be linked to positive outcomes such as accessing formal credit and maintaining deposit accounts (Sotomayor, Talledo and Wong Reference Sotomayor, Talledo and Wong2018; Roa, Garrón and Barboza Reference Roa, Garrón and Barboza2019). However, it is noteworthy that in rural areas, an opposite relationship was reported (Sotomayor, Talledo and Wong Reference Sotomayor, Talledo and Wong2018).
Karakurum-Ozdemir, Kokkizil and Uysal (Reference Karakurum-Ozdemir, Kokkizil and Uysal2019) conducted a study comparing financial literacy scores in Turkey, Colombia, Mexico, Uruguay, and Lebanon. The results showed that Uruguay got the highest financial literacy score, reaching a value of 3.35 out of 5. Moreover, the study highlighted that being female, unmarried, young, and having a lower level of education were all linked with lower levels of financial literacy.
Our current research builds upon previous work in several meaningful ways. First, we examine how financial literacy varies across different demographic subgroups. Second, we explore the connection between financial literacy and several financial outcomes, such as savings, confidence in financial plans, and susceptibility to financial fragility. Third, we investigate the link between knowledge of basic topics, namely interest compounding, inflation, and risk diversification with the aforementioned financial outcomes. We conduct this analysis in a comparative framework involving two Latin American countries using very recent data (2022), right after a global pandemic and at a time when inflation was high and rising in many countries around the world.
Data overview
We use the data collected in the Financial Capability Survey conducted by CAF in Peru and Uruguay in 2022. These surveys explore people’s financial capabilities including knowledge, skills, attitudes, and behavior related to financial issues according to the Organisation for Economic Co-operation and Development (OECD) methodology (OECD 2022). Samples are representative of the population over the age of 18 years, from all socioeconomic levels, and from both urban and rural areas. The size of the samples was approximately 1,200 respondents in each country, and the surveys were done in person. The fieldwork was conducted between April 22 and May 26, 2022 (Uruguay) and between December 10 and December 29, 2022 (Peru). The descriptive statistics of the samples for each country are presented in Table A1 in the Appendix.
Results
Findings regarding financial literacy
Financial literacy was measured with three questions that are similar to the Big Three financial literacy questions (Lusardi and Mitchell Reference Lusardi, Mitchell, Lusardi and Mitchell2011). The first two questions indicate whether respondents have command of the economic concepts most fundamentally related to saving. The third question evaluates knowledge of risk diversification crucial to making informed investment decisions. The exact wording of questions is as follows (*correct answers are marked with an asterisk):
-
1. Understanding of Interest Rate (Numeracy/interest compounding). Suppose you put 100 [local currency] in a savings account with an interest rate of 2 percent per year. You do not make any other payments on this account, and you do not withdraw money. How much money would the account have at the end of five years? (Commissions and taxes are not included).
-
(i) More than 102* [local currency]
-
(ii) Exactly 102 [local currency]
-
(iii) Less than 102 [local currency]
-
(iv) Do not know
-
(v) Refuse to answer
-
-
2. Understanding of Inflation. Imagine that five brothers receive a gift/inheritance of 100 [local currency]. If the brothers have to share the money equally, how much does each get? Now imagine that the brothers have to wait a year to get their share of the 100 [local currency] and inflation remains at 3 percent per year. After a year, will they be able to buy…?
-
(i) More than today
-
(ii) Exactly the same
-
(iii) Less than today*
-
(iv) Do not know
-
(v) Refuse to answer
-
-
3. Understanding of Risk Diversification. Please tell me whether this statement is true or false. “It is less likely that you will lose all of your money if you save it in more than one place.”
-
(i) True*
-
(ii) False
-
(iii) Do not know
-
(iv) Refuse to answer
-
Note that, while there are similarities, these questions deviate from the wording of the questions designed by Lusardi and Mitchell (Reference Lusardi, Mitchell, Lusardi and Mitchell2011); comparison across countries should take those differences into consideration.
Summary statistics for responses to these questions in both countries appear in Table 1. Panel A shows that in Uruguay 58.4 percent of people responded correctly to the question about interest rates, while only 40.1 percent did so in Peru. The proportion rose a bit for respondents aged 25–65 years in both countries. Noticeable, this question is the one that obtained, on average, the highest proportion of “Do not know” answers. It ranges from 18.5 percent in Uruguay to 23.4 percent in Peru. These are high numbers, given the question’s simplicity and the fact that respondents did not have to make a calculation but could merely select from a list of options.
Table 1. Summary statistics on three financial literacy questions in the National Financial Capability Survey of Peru and Uruguay

Note. Distributions of responses to financial literacy questions in full sample and for those aged 25–65 years. All figures are weighted. DK indicates respondent does not know. RF indicates respondent refused to answer.
Panel B shows the results of the inflation question in each country. The country where people know the most about inflation was Uruguay (58.1 percent vs. 47.1 percent in Peru), probably because this country had experienced long and persistent periods of high inflation rates or hyperinflation. The proportion rose a bit for respondents aged 25–65 years in both countries.
Regarding the third question, on risk diversification (Panel C), Uruguay was the country where the largest proportion of people who responded correctly (60.9 percent), compared to Peru with 56.2 percent. The proportion rose slightly for respondents aged 25–65 years in both countries. Appreciable, this is the question with the lowest proportion of respondents answering “Do not know,” ranging from 5.7 percent in Peru to 5.4 percent in Uruguay. This question varies substantially with respect to the one used in other surveys.Footnote 1 This change in wording was necessary considering that the stock markets in Latin America are not very well developed and people are not very much familiar with the terms “stocks” and “stock mutual fund.” In Peru, for example, only 6 percent of people older than 18 years old invest in the stock market (Finanz@s 2023). It is worth noting that this question is included as an alternative question to the traditional one in the OECD/INFE Toolkit for Measuring Financial Literacy and Financial Inclusion (OECD 2022).
In summary, Uruguayans more often than Peruvians answered the financially literacy questions correctly. Peruvians more often than Uruguayans answered “Do not know,” independently of the questions.
Responses to these three literacy questions are also positively correlated, meaning that those who answered one question correctly are also likely to have gotten the other two correct. Nevertheless, the correlation is not particularly high, which suggests that each question measures a different aspect of financial knowledge. Across all age groups, 20.7 percent of people in Peru and 39.5 percent in Uruguay could correctly answer both the interest rate and inflation questions, and 11.6 percent in Peru and 24.9 percent in Uruguay got all three questions correct, as seen in Table 1 (Panel D). Among those aged 25–65 years, 22.1 percent in Peru and 41.4 percent in Uruguay got the first two questions right, and 12.9 percent in Peru to 26 percent in Uruguay answered all three accurately. In view of the complex financial decisions that individuals face in the current economic environment, these are discouragingly low success rates. Moreover, many respondents (from a minimum of 27.7 percent in Uruguay to a maximum of 32.4 percent in Peru) indicated they “do not know” the answer to these questions; this is important since such responses tend to be offered by those who know the least (Lusardi and Mitchell Reference Lusardi, Mitchell, Lusardi and Mitchell2011).
Who knows the least?
We continue the analysis exploring which sociodemographic groups display low financial literacy (see Tables 2a and 2b). In Peru, people older than 65 years, women, people with less than high school, and the self-employed are the population groups who know the least, taking as a reference having responded the three questions correctly. Only 31.1 percent and 44.6 percent of people older than 65 years could correctly respond to the interest and risk questions, respectively, and just 5.4 percent managed to respond correctly to the three questions. This group also shows the largest proportion of “Do not know” answers (47.3 percent). The sample size for this age group is small, so we should be cautious in considering these estimates. Additionally, women in Peru are less financially literate than men with less correct answers in all three questions (10.3 percent vs. 12.8 percent for men) and a large proportion of “Do not know” answers (35.6 percent vs. 29.1 percent for men). These results are statistically significant. These findings underscore sex differences in financial literacy reported in other studies as well (Lusardi and Mitchell Reference Lusardi and Mitchell2008; Lusardi et al. Reference Lusardi, Mitchell and Curto2010). We also observe that correct answers increase in all three questions as the education level rises. In general, the self-employed and the not employed are the two groups who know the least (11.4 percent and 11.7 percent responded correctly to the three questions, respectively).
Table 2a. Distribution of responses to financial literacy questions by age, sex, education, and employment status in the National Financial Capability Survey of Peru

Note. All figures are weighted. DK indicates respondent does not know.
Table 2b. Distribution of responses to financial literacy questions by age, sex, education, and employment status in the National Financial Capability Survey of Uruguay
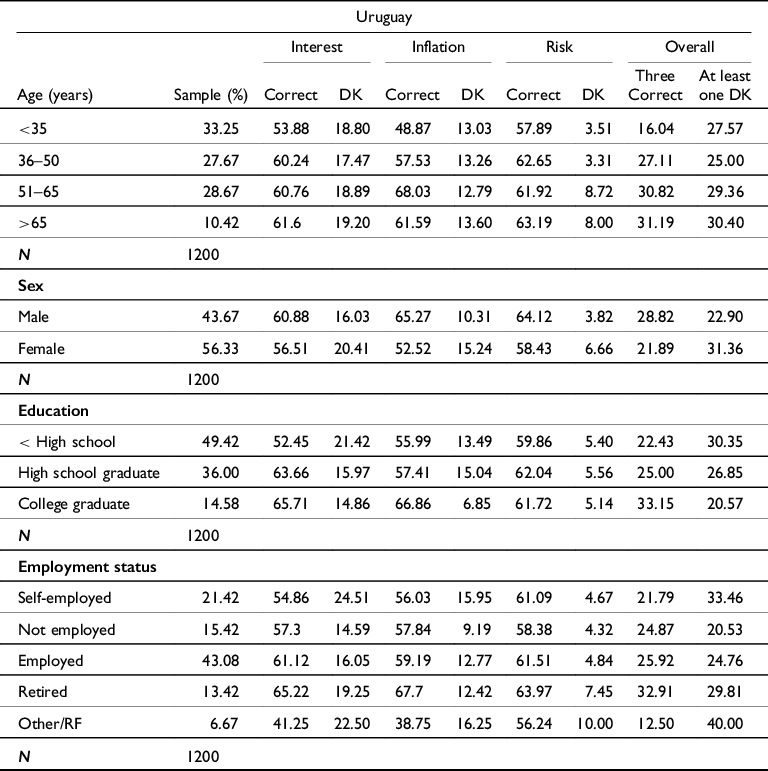
Note. All figures are weighted. DK indicates respondent does not know.
In Uruguay, the percentage of people who answers correctly is higher in all demographic segments than in Peru. In this country, people younger than 35 years old, women, less educated individuals, and the self-employed are those who know the least, taking as a reference having responded the three questions correctly. The results show that 54 percent and 58 percent of people younger than 35 years old responded to the questions on interest and risk correctly, respectively, and just 16 percent responded correctly to all three questions. In Uruguay as well, women are less financially literate than men with less correct answers in all three questions (21.9 percent vs. 28.8 percent for men) and the largest proportion of “Do not know” answers (31.4 percent vs. 22.9 percent for men). In addition, correct answers for all three questions increase as the education level rises. As in the case of Peru, the self-employed and the not employed are the two groups who know the least (21.8 percent and 24.9 percent answered correctly the three questions).
Inflation knowledge
Tables 2a and 2b show the results on the inflation question. In Peru, we observe that the population segments that know the least are people younger than 35 years (45 percent), though differences with other age groups are not large, women (44.8 percent), the less educated (38.5 percent), and the not employed (45.5 percent). Older people, women, less educated, and the self-employed are the ones who have higher proportion of “Do not know” answers.
In all demographic segments, the results show that people in Uruguay know more about inflation than people in Peru, possibly because of a history of high and persistent inflation, as noted above. The population groups who know the least in Uruguay are people younger than 35 years (48.9 percent), women (52.5 percent), the less educated (56 percent), and the self-employed (56 percent). Older people, women, high school graduates, and the self-employed are the ones who have higher proportion of “Do not know” answers.
Next, we examine the association between knowledge of inflation and all of the demographic variables we have considered in Tables 2a and 2b. We conducted a series of Ordinary Least Squares (OLS) regressions with the inflation question as dependent variable and demographic characteristics as independent variables (see Table 3). For Uruguay, we found that having one additional year increases the percentage of answering correctly the question about inflation by 1.9 percentage points, as well as a negative effect of age squared. This indicates that there is a statistically significant positive effect of age. However, as people get older, the effect of age decreases. We also found a statistically significant effect for college graduates, who are 8.5 percentage points more likely to answer correctly the inflation question than those who have not graduated from high school. Finally, we found that women were 1.9 percentage points less likely than men to answer the inflation question correctly.
Table 3. OLS regressions of inflation on demographic variables in the National Financial Capability Survey of Peru and Uruguay

Note: Robust standard errors are in parentheses;
* p < 0.1.
** p < 0.05.
*** p < 0.01. Reference categories are male, less than high school, and employed.
In the case of Peru, we found that, contrary to Uruguay, the coefficients for age and gender were not statistically significant. However, there was a significant positive effect of education: graduating from high school and college raises the chances of understanding the inflation concept by 12.6 and 17.1 percentage points, respectively. Thus, higher educational achievements were associated with a higher probability of answering the inflations question correctly.
Thus, differences in knowledge of inflation remain significant in some of these groups, even after we account for differences in demographic characteristics.
Rural/urban and income differences in financial literacy
It is also instructive to compare financial literacy differences among urban and rural populations and income levels. Urban and rural areas in Latin America have significant differences in terms of income, education, healthcare, infrastructure, employment opportunities, and financial access. On average, Latin America has 19 percent of its population living in rural areas (Banco Mundial 2023). In the case of Peru, the rural population represents 21.1 percent of the total population, while in Uruguay it only represents 4.2 percent of the total population (CIA World Factbook 2023). Thus, it is interesting to analyze the differences in financial literacy in a country with a high proportion of rural population, as in the case of Peru, and a country with one of the lowest proportions of rural population in the region, as in the case of Uruguay (again, we have to note the small sample size).
In addition, it is important to analyze differences according to income level or socioeconomic status. Latin America ranks the third in term of income inequality in the world (World Inequality Lab 2022). While the region has made progress in terms of poverty reduction and inequality in recent decades, the gap between income strata remains significant. For example, the Gini indicator in Peru is 0.464 and in Uruguay is 0.397 (CEPAL 2023). In Table A2 in the Appendix, we provide a description of the socioeconomic levels in Peru and Uruguay.
In the case of Peru, we observe that the rural population know much less than the urban population in all the three questions. Only 31.6 percent and 39.7 percent of the rural population correctly respond to the interest and inflation question (compared to 47.8 percent and 48.6 percent of the urban population, respectively). Regarding the risk question, the proportion of rural population who correctly responded increases to 51.2 percent (compared to 57.1 percent of urban population). We can also observe that for the interest and inflation question, there is a positive relationship between answering correctly the interest and inflation questions and the income level or socioeconomic status (see Table 4).
Table 4. Distribution of responses to financial literacy questions by zone and social status in the National Financial Capability Survey of Peru and Uruguay

Note. All figures are weighted. DK indicates respondent does not know.
In the case of Uruguay, we also observe that the rural population has a lower proportion of correct questions than the urban population in all three questions. Although the proportion of correct answers are higher than in Peru, 47.2 percent and 44.4 percent of rural people correctly responded the interest and inflation questions, respectively (compared to 59.1 percent and 58.9 percent of urban population, respectively). Regarding the risk question, the proportion of the rural population who correctly responded is 59.7 percent (compared to 61 percent of urban population). We can also observe that for the three questions, there is a positive relationship between the number of correct answers and the income level (see Table 4).
Objective versus self-assessed financial literacy
To complement the analysis of the questions measuring actual financial literacy, the Financial Capabilities Surveys of CAF also asks respondents about how they assess their own financial knowledge. This is useful to identify any mismatch between perceived versus actual knowledge. To this end, survey respondents are asked: Could you tell me how you would rate your general knowledge of financial matters compared to other adults in your country?
Very high (5)/Quite high (4)/About average (3)/Quite low (2)/Very low (1)
Don’t know/Refuse to answer
The results in Tables 5a and 5b indicate that people believe they are close to the average of people in their respective countries. In the case of Peru, 55.7 percent believe they know about the average and in the case of Uruguay this figure is 56.7 percent. Moreover, 30.1 percent of people in Peru and 29.1 percent in Uruguay give themselves failing marks (1–2). Overall, 14.2 percent of respondents in Peru and 14.1 percent in Uruguay believe they are above-average with regard to financial knowledge, less than one-fifth of people in the two countries give themselves top knowledge scores (4–5).
Table 5a. Distribution of responses to self-reported financial literacy questions by age, sex, zone, education, and employment in the National Financial Capability Survey of Peru

Table 5b. Distribution of responses to self-reported financial literacy questions by age, sex, zone, education, and employment in the National Financial Capability Survey of Uruguay

We can determine which subgroups are aware of their lack of financial knowledge by comparing Tables 2 and 5. We find a positive correlation between what people know and the self-assessments on their financial knowledge in both Peru and Uruguay. For example, women in both countries are aware of their lack of knowledge, positioning themselves mostly in the low than average and about average ranges. In addition, the less educated know they are uninformed and grade themselves low and the more educated are also aware they are more knowledgeable.
Does financial literacy matter?
In this section, we explore the relationship between financial literacy and financial outcomes. Specifically, we use multivariate analysis to explore the effects of financial literacy on indicators of financial wellbeing such as saving retirement planning and financial vulnerability. For each financial outcome, we present a series of multivariate regression analysis with the financial outcome as dependent variable. The descriptive statistics of the distribution of outcome variables for each country are presented in Table A3 in the Appendix. In the regressions, we included different aspects of people’s financial literacy and demographic characteristics. Specifically, for each financial outcome, we estimate three different specifications. In the first specification, we include a dummy variable for those respondents who answered all three financial literacy questions correctly. In the second specification, we include a variable that indicates the number of financial literacy questions answered correctly. Finally, we estimate a model with three dummy variables for each of the financial literacy questions correctly. Other demographic variables include age and age square, sex, education, marital status, number of children, income, employment status, and a dummy for living in an urban area.
Tables 6a–6c show the simple, univariate relationship between financial literacy questions and financial outcomes. In both countries, for each financial outcome we observe that respondents who are part of the savers, non-vulnerable, and confident on their retirement plan groups are more financially literate than their counterparts. Moreover, they are the ones who have less proportion of “Do not know” answers. This pattern is consistent across the three financial literacy questions. That is, there exists a positive relationship between financial literacy and good financial outcomes. This suggests that people who are more financially literate are more likely to have savvy financial behavior. Below, we consider multivariate regressions.
Table 6a. Financial literacy of savers and non-savers in the National Financial Capability Survey of Peru and Uruguay (%)

Note. All comparisons between savers and non-savers participants are statistically significant.
Table 6b. Financial literacy of people who are and are not confident in their retirement plan in the National Financial Capability Survey of Peru and Uruguay (%)

Note. All comparisons between confident and non-confident participants are statistically significant.
Table 6c. Financial literacy of financially vulnerable and non-vulnerable people in the National Financial Capability Survey of Peru and Uruguay (%)

Note. All comparisons between non-vulnerable and vulnerable participants are statistically significant.
Saving behavior
The first financial outcome we consider is whether respondents are currently saving money. The specific question asked to respondents in both countries was the following: In the last 12 months, have you been saving? The response options were yes, no, do not know, and refuse to answer. We exclude from the analysis participants who indicated they did not know or who refused to answer.
In Tables 7 and 8, we present the estimates of a series of regressions for Peru and Uruguay, respectively. This is a simple indicator, which should vary over the life cycle (people should save when young and dissave when old), and we use it as proxy of the capacity of respondents to keep their expenses below their income. In both countries, having answered correctly the interest question raises the chances of having been saving in the last months by 6.2 and 5.7 percentage points; correspondingly, in other words, respondents who answered the interest question correctly were more likely to save. Additionally, in Uruguay respondents who answered all questions correctly were 6.9 percentage points more likely to answer that they had been saving the last year. Conversely, in Peru, these variables were not statistically significant. The variable indicating the number of correct responses was not statistically significant for either of the countries.
Table 7. OLS regressions of relationship between saving behavior and financial literacy in the National Financial Capability Survey of Peru

Note: Robust standard errors are in parentheses;
* p < 0.1.
** p < 0.05.
*** p < 0.01. Reference categories are male, less than high school, married, low income, rural, and employed.
Table 8. OLS regressions of relationship between saving behavior and financial literacy in the National Financial Capability Survey of Uruguay

Note: Robust standard errors are in parentheses;
* p < 0.1.
** p < 0.05.
*** p < 0.01. Reference categories are male, less than high school, married, low income, rural, and employed.
The regression analysis also showed a strong and positive relation between saving behavior and socioeconomic levels in Uruguay. In column 1, for instance, respondents with medium and high income were more likely to be saving than their low-income counterparts by 8.9 and 40.7 percentage points, respectively. In terms of educational achievements, individuals with high school or a higher degree were also more likely to say they were saving than individuals with less than high school education. All three models show a negative relationship with age, indicating that older individuals were less likely to save money. We found statistically significant differences based on place of residence (rural vs. urban). That is, Uruguayans living in rural areas were more likely to say that they had been saving for the last months than Uruguayans living in urban areas. In terms of employment status, we found that not employed individuals were less likely to have saved money than employed individuals. Neither gender, marital status nor the number of children were statistically significant. All findings are robust to different model specifications.Footnote 2
Our regression results in Peru indicated that single respondents were more likely to have saved in the last year compared to married individuals on average across all three models by 8.5 percentage points. In terms of educational achievements, individuals with a college degree were 11.5 percentage points more likely to have saved than participants who did not finish high school. In terms of income, we found that income levels have a positive effect on saving behavior. In terms of employment status, results revealed that not employed individuals were less likely than employed individuals to have saved in the last year. We found a negative relationship with age, in column 1, for instance, having an additional year reduces the chances of having saved by 1 percentage point. Thus, this indicates that older individuals were less likely to be saving money. Finally, we found no statistically significant differences based on gender, number of children nor place of residence (rural vs. urban). All findings are robust to different model specifications.
Planning for retirement
Another outcome we consider is planning for retirement. To determine how confident individuals were with their retirement plans, the survey asked the following question: In general, on a scale of 1 to 5, where 1 means not at all sure and 5 means very sure: How confident are you that you’ve done a good job with your financial plans for your old age? We call this variable confidence in planning for retirement. In Tables 9 and 10, we present the results of a series of regressions with confidence in planning for retirement as the dependent variable and the financial literacy questions and demographic characteristics as independent variables.
Table 9. OLS regressions of relationship between confidence in planning for retirement and financial literacy in the National Financial Capability Survey of Peru

Note: Robust standard errors are in parentheses;
* p < 0.1.
** p < 0.05.
*** p < 0.01. Reference categories are male, less than high school, married, low income, rural, and employed.
Table 10. OLS regressions of relationship between confidence in planning for retirement and financial literacy in the National Financial Capability Survey of Uruguay

Note: Robust standard errors are in parentheses;
* p < 0.1.
** p < 0.05.
*** p < 0.01. Reference categories are male, less than high school, married, low income, rural, and employed.
In all model specifications for Uruguay, we found consistent findings. None of the financial literacy questions were statistically significant. One possible explanation for this finding is that Uruguayans, independently of their financial literacy levels, are more confident than Peruvians about their pension because of their government strong commitment to social protection affairs. In fact, the coverage of the pension programs is large by Latin American standards. Almost 90 percent of the population over 65 years is covered by the pension system. As expected, we also found that self-employed and not employed individuals were less confident about their pension plans than employed individuals, unlike those who are retired. Having more children and having a medium and high income were associated with higher confidence in planning for retirement. Having graduated from college was also associated with higher confidence in planning for retirement.
The analysis in Peru showed that participants who correctly answered the question about interest and those who correctly answered the question about risk were more confident about their retirement plans. Additionally, women were less confident in their retirement than men. Participants with higher income were more confident, as were individuals living in urban areas and those who had graduated from college. Finally, not employed participants were less confident about their pension plans than employed participants.
Financial vulnerability
We measured financial vulnerability by asking respondents the following question: How long can you continue covering your living expenses, without borrowing any money, after losing your main source of income? Respondents who indicated they could do so for a month or less were classified as financially vulnerable. In a series of regression analyses, we explored the association between financial vulnerability, financial literacy, and demographic factors. In Tables 11 and 12, we present the results for Peru and Uruguay, respectively. For both countries, column 1 shows that having answered all literacy questions correctly was associated with being less likely to be vulnerable by 6.8 and 6.9 percentage points in Peru and Uruguay, respectively. In Uruguay, we found that knowing about interest increases the chances of being less vulnerable by 5.8 percentage points. Additionally, column 2 shows that correctly answering an additional financial literacy question raises the chances of being less vulnerable by 4.9 percentage points. Moreover, being older, having higher education, or higher income were associated with less financial vulnerability. On the contrary, females, single, and self-employed individuals were more vulnerable than men, married, or employed participants. In Peru, graduating from college and having a higher income were associated with reduced vulnerability. For instance, in column 1, individuals who had graduated from college were 1.6 times more likely to be less vulnerable, while those with medium or high income were 1.3 and 1.5 percentage points less vulnerable, respectively.
Table 11. OLS regressions of relationships between not being financially vulnerable and financial literacy in the National Financial Capability Survey of Peru

Note: Robust standard errors are in parentheses;
*p < 0.1.
**p < 0.05.
***p < 0.01. Reference categories are male, less than high school, married, low income, rural, and employed.
Table 12. OLS regressions of relationship between not being financially vulnerable and financial literacy in the National Financial Capability Survey of Uruguay

Note: Robust standard errors are in parentheses;
* p < 0.1.
** p < 0.05.
*** p < 0.01. Reference categories are male, less than high school, married, low income, rural, and employed.
Discussion and conclusions
Our findings from the Financial Capabilities Surveys of CAF in Peru and Uruguay show that most people in the two countries lack key knowledge of basic financial concepts and fail to save and plan for retirement. These groups are likely quite vulnerable to bad financial decisions. We also find a relationship among financial vulnerability and financial literacy, particularly in Uruguay. This is important, because being able to save or to be covered against financial shocks, on the one hand, and to develop and implement a retirement plan, on the other hand, is key to a higher financial wellbeing.
One of our most interesting findings is the relationship found in specific financial knowledge and key financial behaviors. For example, knowledge of interest rates seems quite important and, unfortunately, many do not have such knowledge.
Our paper has specific limitations while also presenting opportunities for further exploration. First, the findings presented in this paper are descriptive in nature, and additional analysis is needed to understand more deeply the relationships highlighted here. In particular, more research is needed to understand what drives financial literacy in the vulnerable populations to better design financial education and inclusion programs in different countries in Latin America. Second, regarding the risk diversification question, we find a larger proportion of correct answers than in other measurement exercises (see e.g., Lusardi and Mitchell Reference Lusardi, Mitchell, Lusardi and Mitchell2011), probably due to the different wording of the question. Further research is needed to establish whether the questions used to assess this construct capture the same underlying concept.
In conclusion, financial literacy is critical to saving, planning for retirement, and financial vulnerability. This finding is consistent with the literature that finds a significant positive relationship between financial knowledge and financial behavior. Individuals that lack basic financial knowledge do not have the necessary tools to make decisions that are most advantageous for their financial wellbeing.
Supplementary material
The supplementary material for this article can be found at https://doi.org/10.1017/flw.2023.15


 Open access