


1. Introduction
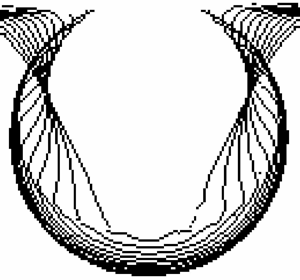
A bubble at a liquid–gas interface is characterised by a cavity, capped from above by a spherical thin film, and joined at a circular rim, as shown in figure 1(a). The rupture of the thin film leaves an unstable cavity at the interface, which collapses axisymmetrically and generates a high-velocity jet (Woodcock et al. Reference Woodcock, Kientzler, Arons and Blanchard1953; Kientzler et al. Reference Kientzler, Arons, Blanchard and Woodcock1954); figure 1 shows an image sequence of a bubble bursting at the free surface. The bursting of these free-surface bubbles is an important transport mechanism in mass transport from the liquid surfaces to the ambient air in air–sea exchange and in the spread of pathogens (Blanchard Reference Blanchard1963; MacIntyre Reference MacIntyre1972; Spiel Reference Spiel1995; Walls, Henaux & Bird Reference Walls, Henaux and Bird2015; Joung, Ge & Buie Reference Joung, Ge and Buie2017; Sampath et al. Reference Sampath, Afshar-Mohajer, Chandrala, Heo, Gilbert, Austin, Koehler and Katz2019; Yang et al. Reference Yang, Ji, Ault and Feng2023). Bubble bursting has also been investigated in connection with the reverse mass transport observed in the mixing of oil spills in the ocean (Feng et al. Reference Feng, Roché, Vigolo, Arnaudov, Stoyanov, Gurkov, Tsutsumanova and Stone2014), and in the context of the creation of intense stress zones in bioreactors (Boulton-Stone & Blake Reference Boulton-Stone and Blake1993; Walls et al. Reference Walls, McRae, Natarajan, Johnson, Antoniou and Bird2017).

Figure 1. Stages of bubble collapse at a liquid surface. (a) Static bubble in water with a radius  $R\approx 2\,{\rm mm}$;(b) rupturing of thin film; (c) beginning of the cavity collapse; (d) jet at the free surface. The time gaps between the images are of the order of $10^{-4}\,{\rm s}$.
Most of these studies on free-surface bubble collapse have focused on the dynamics of the ensuing jetting. The general consensus on jetting is that, when Ohnesorge number  $Oh=\mu /\sqrt {\sigma \rho R}<0.037$, the jet velocity $U_j$ scales with the capillary velocity $U_c=\sqrt {\sigma /\rho R}$ (see table 1 for the definitions of symbols), provided, the bubbles are small, such that Bond number $Bo=\rho g R^2/\sigma <0.1$. However, for larger bubbles, when $Bo>0.1$, the jet velocity can deviate substantially from the capillary velocity $U_c$ due to gravity effects (Gañán Calvo Reference Gañán Calvo2017, Reference Gañán Calvo2018; Krishnan, Hopfinger & Puthenveettil Reference Krishnan, Hopfinger and Puthenveettil2017; Deike et al. Reference Deike, Ghabache, Liger-Belair, Das, Zaleski, Popinet and Séon2018; Gordillo & Rodríguez-Rodríguez Reference Gordillo and Rodríguez-Rodríguez2019). A jet Weber number scaling, $We_j=\rho {U_j}^2 R/\sigma \sim (Z_c/R)^2$, proposed by Krishnan et al. (Reference Krishnan, Hopfinger and Puthenveettil2017), explains the effect of gravity on jet velocity through the static depth of the bubble cavity $Z_c$ (see figure 1a), where $Z_c$ is a function of Bond number, as given by Puthenveettil et al. (Reference Puthenveettil, Saha, Krishnan and Hopfinger2018). Significant progress has been made recently towards the theoretical understanding of the jet dynamics (Lai, Eggers & Deike Reference Lai, Eggers and Deike2018; Blanco-Rodríguez & Gordillo Reference Blanco-Rodríguez and Gordillo2020; Gañán Calvo & López-Herrera Reference Gañán Calvo and López-Herrera2021), and accurate predictions have been made for the sizes of ejected first drops from the jets for a wide range of bubble radii (Gañán Calvo & López-Herrera Reference Gañán Calvo and López-Herrera2021; Gañán-Calvo Reference Gañán-Calvo2023).
Table 1. The properties of the fluids used in the experiments and the corresponding dimensionless parameters. The fluid properties of surface tension, density and dynamic viscosity are denoted by  $\sigma$, $\rho$ and $\mu$, respectively, while $g$ is the acceleration due to gravity. The Bond number ${Bo=\rho g R^2/\sigma }$, the Ohnesorge number $Oh=\mu /\sqrt {\sigma \rho R}$, the capillary time scale $t_c =\sqrt {\rho R^{3}/\sigma }$ and the capillary velocity scale $U_c=\sqrt {\sigma /\rho R}$.

The cavity collapse dynamics associated with this jetting is complex, with the velocities being at least an order of magnitude less than the jet velocity (Krishnan & Puthenveettil Reference Krishnan and Puthenveettil2015; Gañán Calvo & López-Herrera Reference Gañán Calvo and López-Herrera2021). As seen in the images of surface bubble cavity collapse (figure 1), after the thin surface film rupture, the hole expansion creates a concave boundary (as seen from the liquid side), S1 in figure 1(c) (Krishnan, Puthenveettil & Hopfinger Reference Krishnan, Puthenveettil and Hopfinger2020), with the formation of a kink at its intersection with the convex cavity shape, S2 in figure 1(c). The kink propagates tangentially along the boundary with velocity  $U_t$, while at the same time, the cavity shrinks with a velocity $U_n$ normal to the boundary due to the excess capillary pressure after the gas pressure drops when the cavity opens. Capillary waves, similar to the waves observed earlier in steep gravity waves (Perlin, Lin & Ting Reference Perlin, Lin and Ting1993) and Faraday waves (Das & Hopfinger Reference Das and Hopfinger2008; Puthenveettil & Hopfinger Reference Puthenveettil and Hopfinger2009), move ahead of the main (kink) capillary wave (see figure 3). Viscous damping of these precursory capillary waves is proportional to $Oh^{1/2}$, which is valid till the complete suppression of the waves (Krishnan et al. Reference Krishnan, Hopfinger and Puthenveettil2017; Gordillo & Rodríguez-Rodríguez Reference Gordillo and Rodríguez-Rodríguez2019). Such progressive viscous damping of these waves results in an increase in the jet velocity up to $Oh\approx 0.02$, beyond which the jet velocity decreases (Ghabache et al. Reference Ghabache, Antkowiak, Josserand and Séon2014). This complex dependence of jet velocity on $Oh$ for a broad range of $Oh$ and $Bo$, including the critical $Oh\approx 0.03$, after which viscosity acts on the cavity size, was first explained by Gañán Calvo & López-Herrera (Reference Gañán Calvo and López-Herrera2021) as a nonlinear smooth transition.
While the stages of collapse described above, and shown in figure 1, have been well identified (MacIntyre Reference MacIntyre1972; Duchemin et al. Reference Duchemin, Popinet, Josserand and Zaleski2002; Lee et al. Reference Lee, Weon, Park, Je, Fezzaa and Lee2011; Brasz et al. Reference Brasz, Bartlett, Walls, Flynn, Yu and Bird2018), quantitative information and scaling laws for the velocities of collapse, and the related mass fluxes are not available. The two-dimensionality of the moving kink, and the lack of top-down symmetry of the interface during flow convergence prevent the use of one-dimensional, Rayleigh–Plesset equation based models, often used to study the cavities at the free surface formed by impacting objects (Oguz & Prosperetti Reference Oguz and Prosperetti1993; Burton, Waldrep & Taborek Reference Burton, Waldrep and Taborek2005; Bartolo, Josserand & Bonn Reference Bartolo, Josserand and Bonn2006; Bergmann et al. Reference Bergmann, van der Meer, Stijnman, Sandtke, Prosperetti and Lohse2006; Duclaux et al. Reference Duclaux, Caille, Duez, Ybert, Bocquet and Clanet2007). Even though it has been found that the kink moves with a constant velocity, proportional to the capillary velocity (Krishnan & Puthenveettil Reference Krishnan and Puthenveettil2015; Krishnan et al. Reference Krishnan, Hopfinger and Puthenveettil2017; Gordillo & Rodríguez-Rodríguez Reference Gordillo and Rodríguez-Rodríguez2019), its dependency on  $Oh$, through precursor capillary waves, and on $Bo$ through the total path length, has not been addressed in any detail. The effect of precursory capillary waves on jet velocity has been extensively studied (Ghabache et al. Reference Ghabache, Antkowiak, Josserand and Séon2014; Gañán Calvo Reference Gañán Calvo2017; Krishnan et al. Reference Krishnan, Hopfinger and Puthenveettil2017; Deike et al. Reference Deike, Ghabache, Liger-Belair, Das, Zaleski, Popinet and Séon2018; Gañán Calvo Reference Gañán Calvo2018; Gañán Calvo & López-Herrera Reference Gañán Calvo and López-Herrera2021; Gordillo & Rodríguez-Rodríguez Reference Gordillo and Rodríguez-Rodríguez2019; Blanco-Rodríguez & Gordillo Reference Blanco-Rodríguez and Gordillo2021). However, the effect of these waves on the collapsing cavity surface has not been addressed.
Most other studies (Gañán Calvo Reference Gañán Calvo2017, Reference Gañán Calvo2018; Ismail et al. Reference Ismail, Gañán Calvo, Castrejón-Pita, Herrada and Castrejón-Pita2018; Lai et al. Reference Lai, Eggers and Deike2018; Blanco-Rodríguez & Gordillo Reference Blanco-Rodríguez and Gordillo2021) consider only the dynamics of flow convergence in a small region at the cavity bottom, where viscosity also dictates the length scale. Gordillo & Rodríguez-Rodríguez (Reference Gordillo and Rodríguez-Rodríguez2019), Blanco-Rodríguez & Gordillo (Reference Blanco-Rodríguez and Gordillo2021) and Gordillo & Blanco-Rodríguez (Reference Gordillo and Blanco-Rodríguez2023) assumed a purely horizontal and radially inward inertial flow during the flow convergence at the cavity bottom and modelled the flow using a vertical array of sinks placed along the meridian centre line, with the length of the array being determined by the size of the bubble and the wavelength of the capillary waves moving ahead of the kink. Lai et al. (Reference Lai, Eggers and Deike2018) showed that the shapes of the collapsing cavity are self-similar, with a capillary–inertial  $|t_s-t|^{2/3}$ scaling, where $t_s-t$ is the time to the singularity and $t_s$ being the instant of fluid convergence at the cavity bottom. This is similar to the scaling of Zeff et al. (Reference Zeff, Kleber, Fineberg and Lathrop2000) in Faraday wave collapse. However, such a self-similarity only holds for $0.014< Oh \leq 0.04$ and small Bond numbers ( $Bo\ll 0.1$), when precursory capillary waves are absent.
An important exception to these local convergence studies is the analysis of streamlines for the entire fluid domain by Gañán Calvo & López-Herrera (Reference Gañán Calvo and López-Herrera2021), wherein the authors show why a global analysis of cavity collapse is necessary for the complete understanding of the focusing zone and jet formation. Gañán Calvo & López-Herrera (Reference Gañán Calvo and López-Herrera2021) proposed the spherically averaged velocity during the flow convergence to scale as  $W\sim (V_{\mu }/Oh_L)\psi (Oh,Oh_L,Bo)$, where $V_{\mu }=\sigma /\mu$, and $Oh_L$ is the Ohnesorge number based on the length scale at the bottom of the cavity at flow convergence; in the limit $Oh\ll 0.04$, $W$ tends to the capillary velocity $U_c$ (Gañán Calvo Reference Gañán Calvo2017, Reference Gañán Calvo2018). These fluid flow velocity based scalings may not match with the scalings based on the interface velocities, which we study here in the present work, to determine explicit relations for the normal velocity at the bottom of the cavity as a function of $Oh$ and $Bo$. As we mentioned above, and discuss in detail later, we show that the cavity surface during flow convergence at the bottom has both radial (spherical) and tangential velocities, an aspect also inferred by Gañán Calvo & López-Herrera (Reference Gañán Calvo and López-Herrera2021) from their analysis of streamlines of the liquid flow, which actually scale differently since they are based on fluid velocities, while we present interface velocities.
In the present paper we present experimental results concerning the dynamics of cavity collapse of a free-surface bubble. Scaling laws for the duration of collapse, the various velocities of collapse and the volume fluxes involved in the collapse are established. We show that precursory capillary waves reduce the velocity of the moving kink in the tangential and the normal directions. Since the kink movement is a wave propagation velocity, the volume fluxes are shown to be entirely due to shrinkage of the cavity walls in the normal direction, with a direct dependency on the cavity depth  $Z_c$. The observed jet velocity scaling is also retrieved from the scaling of this normal flux. The effects of viscosity and gravity on cavity collapse are quantified using three parameters: the path correction $\mathscr {L}(Bo)$, the wave resistance factor ${\mathcal {W}}_R(Oh,Bo)$ and the aspect ratio of the cavity ${Z_c(Bo)}/{R}$. These aspects of cavity collapse are essential for the understanding of the effects of viscosity and gravity on jetting.
The paper is organised as follows. In § 2 the experimental set-up and conditions are presented. Then, in § 3, different aspects of cavity collapse, namely the tangential kink velocities, the normal interface velocities of the collapsing cavity boundary and the total time of cavity collapse, are discussed. Scaling relations that explain the effect of gravity and viscosity on these quantities are established in this section. In § 4, the volume influxes related with the interface velocities are determined, with concluding discussions presented in § 5.
2. Experimental conditions
The experiments were conducted in two transparent containers of cross-sectional areas of  $5 \times 5\,{\rm cm}^2$ and $3.5 \times 5\,{\rm cm}^2$, filled with various fluids, viz., distilled water, various glycerol–water mixtures with weight of glycerine of 48 %, 55 %, 68 % and 72 %, (hereinafter referred to as GW48, GW55, GW68 and GW72), ethanol and 2-propanol. Table 1 shows the properties of these fluids. In order to avoid meniscus effects, the containers were filled with the desired liquids up to the brim. Fine capillaries of various sizes, connected to a constant discharge syringe pump, were kept immersed in the working fluid to create bubbles of different, equivalent, spherical radii $R$. Low discharge rates were maintained, so that the bubbles were in the periodic discharge regime (Oguz & Prosperetti Reference Oguz and Prosperetti1993). To prevent variation in bubble sizes from each capillary, the orientations of the capillaries were maintained the same throughout the experiments (Doshi et al. Reference Doshi, Cohen, Zhang, Siegel, Howell, Basaran and Nagel2003). The bubble occupied the centre of the container. We used La Vision ProHS ( $\text {frame rate} \leq 19\,000\,{\rm Hz}$) and Photron SA4 ( $\text {frame rate} \leq 100\,000\,{\rm Hz}$) cameras for high-speed imaging of the side views of the dynamics of the cavities. A high-intensity green LED array was used for back lighting. The image acquisition rates met the condition that $t_i < 1/| \,{\rm d}U_{abs}/{\rm d}s |$, where $t_i=1$/(frame rate) and ${\rm d}U_{abs}/{\rm d}s\approx (U_{abs}(t_2)-U_{abs}(t_1))/({\rm d}(t_2)-{\rm d}(t_1))$ is the spatial gradient of the absolute velocity of the kink along the cavity, where $U_{abs}$ are the absolute velocities, and $d$ the linear displacements, of the kink at the two successive times $t_1$ and $t_2$. The spatial resolution was such that $\Delta Z_i < U_{abs}\ t_{exp}$, where $\Delta Z_i$ is the size of each pixel and $t_{exp}$ is the exposure time. The lowest and the highest resolutions for the imaging were $27\,\mathrm {\mu }{\rm m}\,{\rm pix}^{-1}$ and $3.4\,\mathrm {\mu }{\rm m}\,{\rm pix}^{-1}$, respectively.
The following length measurements were done by counting the pixels between the appropriate liquid–gas interfaces seen in the images. The equivalent spherical bubble radii ( $R$) were measured from the images of the rising bubbles generated at the capillaries. The cavity shrinking lengths along the equatorial plane $D_{ne}$ and along the vertical plane $D_{nb}$ were measured as a function of time from the instantaneous images of the collapsing cavity. The time $t$ corresponding to each image was estimated from the frame rate of recording, with the zero time being the time of thin film rupture. The total time of cavity collapse $t_{bc}$ was measured by counting the number of images starting from the thin film rupture till the cavity becomes conical (see figure 2d). The times corresponding to the lengths $D_{ne}$ and $D_{nb}$ were measured similarly. The bottom diameter of each conical cavity $2r_b$ was measured as the horizontal distance between the kinks seen on either sides of the vertical centre line of the bubble, at the instant of flow convergence $t=t_{bc}$ (see figure 2d), beyond which the cavity bottom underwent a significant upward movement (see figure 3i,j) due to jet formation.

Figure 2. Schematics depicting the parameters and terminologies describing the cavity collapse. (a) The actual cavity contours at two time instances, extracted from experiments with a bubble of  $R=0.175\,{\rm mm}$ in water showing the kink. S1 and S2 denote the concave and the convex boundaries of the cavity (also see figure 3e).(b) The side volume flux $Q_s$ and the bottom volume flux $Q_b$ due to the difference between the side and the bottom cavity contours at two successive time instances. Similarly, $Q_o$ is the volume outflux at the top, estimated as the difference between the cavity contours at the free surface, FS. (c) Schematic of the collapsing cavity contours at two time instances, with the position of the kink at the different times marked as ① and ②. The absolute, tangential and normal velocities of the kink are shown in the associated vector triangle. (d) Schematic of the cavity contours at the following times: (i) $t=0$ (black); the initial cavity contour when the thin film is ruptured, (ii) $t=t_e$ (blue); the cavity contour when the kink has arrived at the equatorial plane of the cavity (denoted by the horizontal line) showing the equatorial cavity shrinkage $D_{ne}$, (iii) $t=t_{bc}$ (red); the cavity contour when the kink has arrived at the bottom when the cavity has the form of a smooth funnel with bottom radius $r_b$ and vertical cavity retraction $D_{nb}$.

Figure 3. Image sequence showing the stages of cavity collapse in a low-viscosity fluid, showing the presence of precursory capillary waves. The bubble is of radius  $R=0.47\,{\rm mm}$ in water ( $Bo=0.03$, $Oh=0.0055$). Bubble pinch-off from wave focusing, creating a downward gas jet of radius $8.6\,\mathrm {\mu }{\rm m}$, is also seen in (h–i). The width of each image is 0.97 mm. Movie 1 is available at https://doi.org/10.1017/jfm.2024.26.
We consider the kink propagation and the precursor capillary waves as two different physical phenomena. The precursory capillary waves act as deformations on the convex bubble cavity boundary (S2), whereas the kink is defined as the intersection of the concave cavity opening (S1) with the convex bubble cavity boundary (S2), independent of the presence or the absence of these precursor capillary waves (see figure 2a). Velocities of the moving kink, in directions tangential and normal to the cavity surface ( $U_t$ and $U_n$), were estimated by resolving the absolute velocities of the kink $U_{abs}$ in two mutually orthogonal directions, as shown in figure 2(c). The absolute displacements of the kink were measured by finding its coordinates at various instances, with $U_{abs}$ at each instant being obtained by dividing these absolute displacements by the corresponding time gap between the images. The angle $\gamma$ at each instant (see figure 2c) was measured throughout the collapse duration by finding $\tan \gamma$ by vectorial decomposition of the corresponding absolute velocity along the tangential and the normal directions. Polynomial fits of the progressive displacements in the tangential direction ( $d_t$) as a function of time, similar to that shown in the inset (a) of figure 5, were used to calculate $U_t(t)$ by taking the time derivative of the fits. The curve fits were carried out for the complete time sequence of $d_t$ and the typical degree of the polynomial fit was 8. The root mean square error for all the curve fits for displacements in our study were extremely small, approximately of the order of $10^{-5}\,{\rm mm}$, hence, the polynomial fits that we used does not affect the accuracy of the results. In the same way, the normal velocities $U_n$ were estimated from the corresponding progressive normal displacements.
We define three volume fluxes related with the cavity boundary movement: the side (tangential) volume influx  $Q_s$, the bottom (normal) influx $Q_b$ and the side volume outflux $Q_o$, with the total filling rate being $Q_{T}=Q_s+Q_b$. The area ABF shown in figure 2(b) is the area swept by two successive positions of the kink as it travels along the cavity surface and inwards, with the corresponding side (tangential) volume influx being $Q_s$. Similarly, the area BCGF is the area swept by the normal motion of the bottom regions of the cavity, with corresponding volume influx being $Q_b$. The volume outflux $Q_o$, corresponding to the area DA, was only measured for a single bubble since it was time invariant and hence was not a dynamic quantity. All the volumes were measured as follows: the edges of the collapsing cavity were extracted from images using Canny or Sobel edge detection criteria, depending on the noise levels in the image sequence. Two successive contours were superimposed to produce a sequence of edge pairs (see figure 2a) with time. Within two successive contours, the radial distance ( $r_p$) of each pixel and the total number of pixels $\eta _{p}$ were measured at each time. The volume contributed by a square pixel inside the two edges, $2 {\rm \pi}r_p {\Delta Z_i}^2$, was estimated. This process was repeated for all the pixels inside the contours, and the volume contributions from each pixel were added. The value of this cumulative volume was then divided by the time gap between the two frames to find the volume flux. The same method was continued for the entire sequence of contour pairs to obtain the volume fluxes as a function of time.
3. Cavity collapse
Figure 3 shows a sequence of the stages of the collapse of a bubble at the free surface for a low-viscosity fluid (water,  $Oh=0.0055$). The corresponding stages for a high-viscosity fluid (GW55, $Oh=0.034$) are shown in figure 4. In both cases, an axisymmetric kink (figure 3e) is seen travelling from the cavity top to the bottom-most part of the cavity, where the cavity boundary converges. For the low-viscosity case (figure 3), precursor capillary waves (see $B$ in figure 3h) are seen moving ahead of the main (kink) wave. We observe these capillary waves throughout the collapse, only when $Oh<0.02$, as it is the case in figure 3, resulting in a sharp front edge of the kink, as can be seen in figure 3. When $Oh>0.02$, as shown in figure 4, these precursory capillary waves are fully damped by the viscous effects before they reach the cavity bottom, resulting in a more rounded front edge of the kink. As can be seen from figures 3 and 4, the kink travels along the cavity surface, while the cavity itself is shrinking normal to its surface. Thus, at any instant, the kink has velocities tangential and normal to the cavity surface, up to the flow convergence at the cavity bottom. It is noteworthy to mention that only the radial interface velocity is equal to the fluid velocity. We analyse these velocities in detail in the following sections.
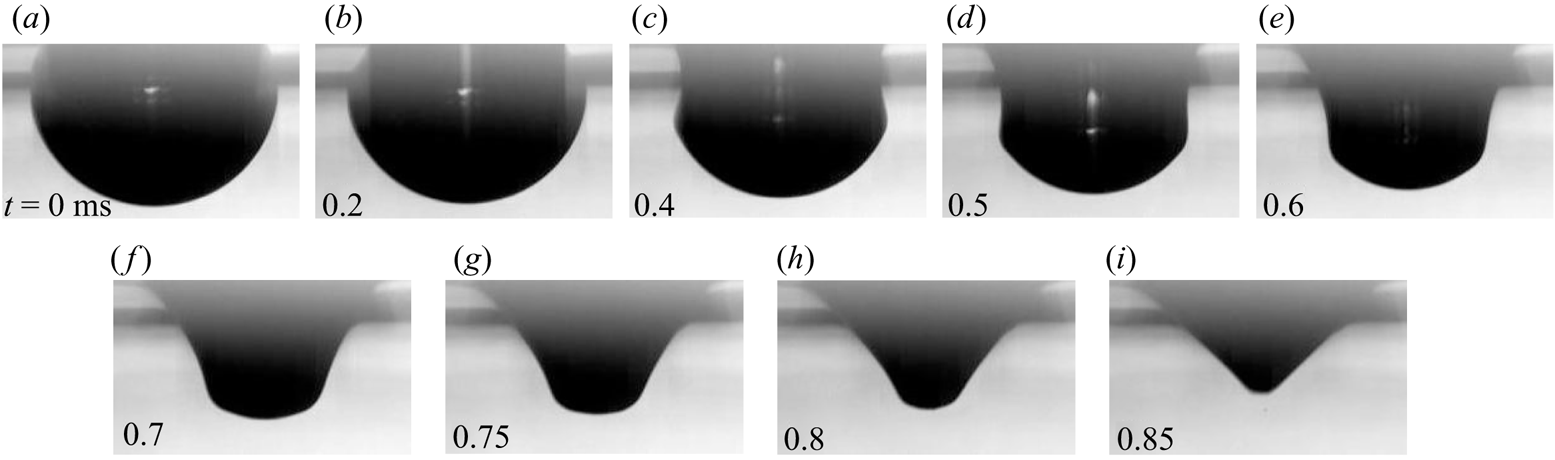
Figure 4. Image sequence showing the stages of cavity collapse due to a  $R=0.7\,{\rm mm}$ bubble ( $Bo=0.08$) in a high-viscosity fluid (GW55, $Oh=0.034$) that is relatively free of the precursory capillary waves. The image width is $1.7\,{\rm mm}$. See movie 2.
3.1. Tangential wave propagation velocity of the kink
The tangential wave propagation velocity  $U_t$ of the kink (herein after simply the tangential velocity) has been measured as discussed in § 2. Inset (b) in figure 5 shows the variation of the dimensionless tangential velocity ( $U_t/U_c$) with the dimensionless time ( $t/t_c$), where $t_c=\sqrt {\rho R^{3}/\sigma }$ is the capillary time scale, for bubbles of similar $Bo$ in GW72, $Oh=0.0427$ (red circle), and in water, $Oh=0.0028$ (yellow square). The value of $U_t$ is observed to be constant, except at the beginning and the end of the collapse, and scales with the capillary velocity $U_c=\sqrt {\sigma /\rho R}$, in a way similar to the observations of Krishnan & Puthenveettil (Reference Krishnan and Puthenveettil2015), Krishnan et al. (Reference Krishnan, Hopfinger and Puthenveettil2017) and Gordillo & Rodríguez-Rodríguez (Reference Gordillo and Rodríguez-Rodríguez2019). However, for $Oh=0.0028$, where precursor capillary waves occur ahead of the main kink wave, as shown in figure 3, the values of $U_t/U_c$ are around $40\,\%$ lower compared with those at $Oh=0.0427$, where the precursor capillary waves are fully damped (figure 4). We observe this behaviour with all the bubbles when $Oh<0.02$. Similar decreasing velocity of the kink in the presence of precursor capillary waves is clearly seen in the velocity data of Ji, Yang & Feng (Reference Ji, Yang and Feng2021) (see Ji et al. Reference Ji, Yang and Feng2021, figure 5) for the bursting of bubbles in oil covered water surface, where the oil layer covering the kink enhances the damping of precursor capillary waves. Thus the capillary velocity scale alone does not collapse the tangential velocity data for different viscosity fluids, possibly due to the effect of precursor capillary waves on $U_t$. A new scaling relation for $U_t$ is therefore needed to account for the effect of viscous damping of the precursor capillary waves, and a possible (weak) gravity effect. Using an energy balance at the kink, we now obtain such a scaling relation that collapses the tangential velocity data.
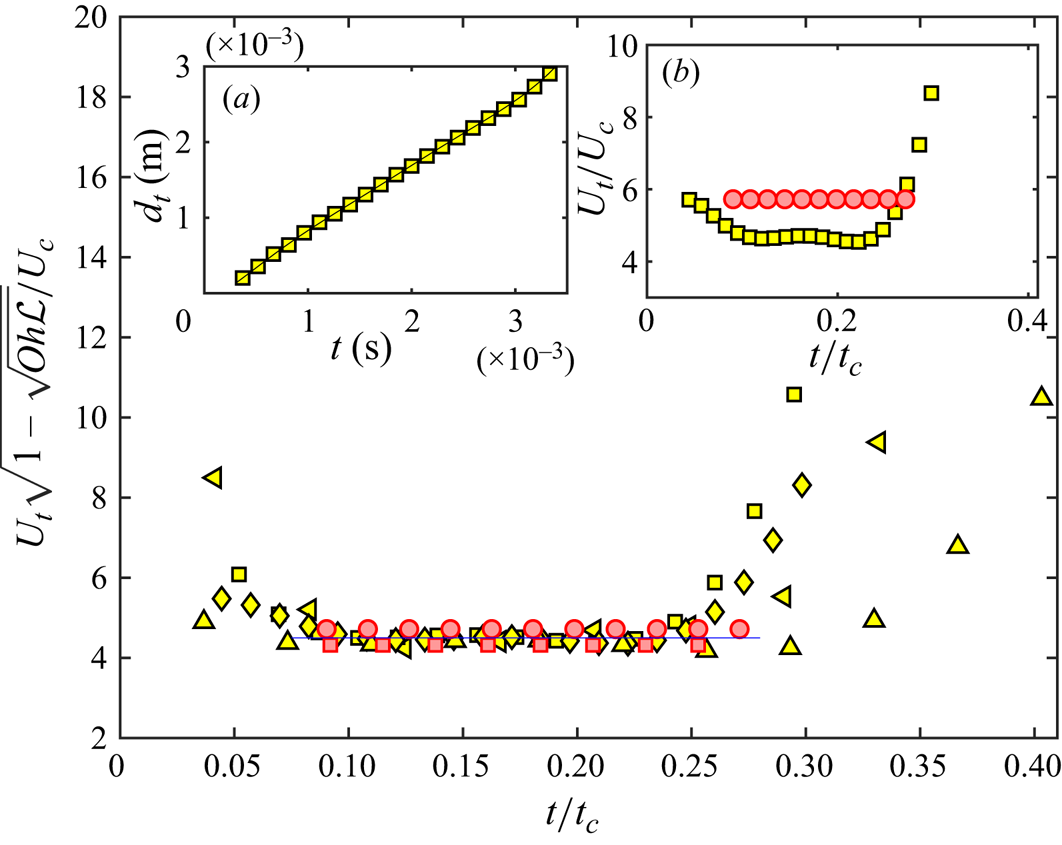
Figure 5. Normalised tangential velocity of the kink, accounting for the wave resistance of precursory capillary waves,  ${\mathcal {W}}_R(Oh,Bo)$, and the path correction due to gravity effects, $\mathscr {L}(Bo)$, as in (3.13), plotted as a function of the dimensionless time $t/t_c$, for bubbles of $0.001 < Bo < 1$ and $0.001< Oh<0.05$. Symbols: ${\blacktriangle }$, yellow, $R=0.175\,{\rm mm}$ ( $Bo=4.2 \times 10^{-3}$, $Oh=0.0099$); ${\blacktriangleleft }$, yellow, $R=0.47\,{\rm mm}$ ( $Bo=3 \times 10^{-2}$, $Oh=0.0055$); ${\blacksquare }$, yellow, $R=1.74\,{\rm mm}$ ( $Bo=4.1 \times 10^{-1}$, $Oh=0.0028$) and ${\blacklozenge }$, yellow, $R=2.15\,{\rm mm}$ ( $Bo= 6.3 \times 10^{-1}$, $Oh=0.00255$). Aforementioned data are from water. Data with GW72 are: ${\blacksquare }$, red, $R=1.59\,{\rm mm}$ ( $Bo= 4.8 \times 10^{-1}$, $Oh= 0.0481$); ${\bullet }$, red, $R=2.02\,{\rm mm}$ ( $Bo= 7.7 \times 10^{-1}$, $Oh=0.0427$). —, $U_t\sqrt {1-\sqrt {Oh\mathscr {L}}}/U_c=4.5$. In inset (a), the cumulative distance, $d_t$, travelled by the kink in the tangential direction is plotted versus time for a bubble of $R=2.14\,{\rm mm}$ in water, with — the polynomial fit used for calculating $U_t$. The inset (b) shows the offset between the dimensionless tangential velocities of the kink in water and GW72, when precursory capillary wave effects are not taken into account.
3.1.1. Energy balance at the kink
The retraction of the rim right after the film rupture provides the kinetic energy associated with the kink movement. Since the kink moves with constant velocity  $U_t$, as seen in § 3.1 and figure 5, we assume a steady state balance of the energy of the kink movement. Consider the area corresponding to the side flux AFB as shown in figure 2(a), with $2{\rm \pi} R$ and $R$ being the characteristic lengths along azimuthal and vertical directions, respectively. The characteristic volume of the kink then scales as $2{\rm \pi} R^2 \beta$, with $\beta$ being the length scale of the kink, where the velocity is the tangential velocity $U_t$. Note that the kink is identified as a small region (the intersection of S1 and S2 as shown in figure 2a) where the characteristic velocity is $U_t$, and the movement of the surface above the kink of lesser velocities is neglected. We assume that $\beta$ is directly related to the amplitude of the precursory capillary wave $\beta \simeq a$. Hence, the characteristic volume of the kink is $2{\rm \pi} R^2 a$, and the corresponding kinetic energy is $KE=(1/2)\rho 2{\rm \pi} a R^2 U_t^2$.
The precursory capillary waves are driven by the sudden movement of the kink. Consequently, a part of the kinetic energy of the kink is utilised for the creation of these waves ( $KE_{loss}$) and a part of the kinetic energy is converted to surface energy $SE$ (i.e. due to the creation of the kink area), where $2{\rm \pi} R$ and $a$ are the characteristic lengths along azimuthal and vertical directions, respectively, of the precursory capillary wave. Since the motion is felt over a length scale of wavelength $\lambda$, the characteristics volume of the precursory capillary wave for one cycle is chosen as $2{\rm \pi} R a \lambda$. The corresponding kinetic energy is $KE_{loss}=(1/2)\rho a 2{\rm \pi} R \lambda U_t^2$, as these waves move with the same velocity that of the kink.
The surface energy corresponding to the creation of the kink area is  $SE=\sigma 2{\rm \pi} R a$, where $\sigma$ is the surface tension. Balancing the energy terms $KE=KE_{loss}+SE$, gives
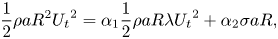 \begin{equation} \frac{1}{2}\rho a R^2 {U_t}^2 = \alpha_1 \frac{1}{2}\rho a R \lambda {U_t}^2 + \alpha_2 \sigma a R , \end{equation}
where  $\alpha _1$, $\alpha _2$ are constant prefactors. Rearranging (3.1), we obtain the Weber number of cavity collapse in the form
 \begin{equation} We_c = \frac{\rho {U_t}^2 R}{\sigma} = \left(\frac{U_t}{U_c}\right)^2 = \frac{2 \alpha_2}{1 - \alpha_1 {\lambda}/{R}}. \end{equation}
The expression (3.2) quantifies the reduction in  $U_t/U_c$, shown in the inset (b) of figure 5, due to the presence of precursory capillary waves. The dimensionless wavelength $\lambda /R$ of the dominant precursory capillary wave in (3.2) depends on the total time of cavity collapse, which, as we show later in § 3.1.3, depends on $Oh$ and $Bo$. Then, (3.2) can be written as
 \begin{equation} U_t=\alpha_3 U_c {\mathcal{W}}_R(Oh,Bo), \end{equation}
where  $\alpha _3=\sqrt {2 \alpha _2}$ and
 \begin{equation} {\mathcal{W}}_R(Oh,Bo)=1/\sqrt{1-\alpha_1\lambda/R}, \end{equation}
is the wave resistance factor that accounts for the reduction in  $U_t$ due to the precursory capillary waves. Here, ${\mathcal {W}}_R(Oh,Bo)$ depends on $\lambda /R$, which in turn depends on the total time of cavity collapse, $t_{bc}$, since viscous damping during $t_{bc}$ affects $\lambda /R$. The above analysis did not consider the overall complexities of the flow, especially in the region away from the interface. However, with the use of appropriate prefactors, as we show later, (3.3) does capture the kinematics of the kink motion along the tangential direction. We now discuss the dependency of $t_{bc}$ on $Oh$ and $Bo$, which allows us to get the dependency of $\lambda /R$ on $Oh$ and $Bo$, and thereby, an expression for ${\mathcal {W}}_R(Oh,Bo)$.
3.1.2. Total time of cavity collapse  $t_{bc}$

Since the time taken for the disintegration of the thin film at the top of the bubble is negligible (Duchemin et al. Reference Duchemin, Popinet, Josserand and Zaleski2002), we consider the time at which the retracting rim has reached the outer edge of the film, at  $R_r$ (see figure 2d), to be the reference time $t=0$. The time from $t=0$ to the stage where the cavity has become conical, just before jet initiation (figure 3i), is measured as the total time of cavity collapse, $t_{bc}$. In figure 6, $t_{bc}$, normalised by the capillary time scale $t_{c}=\sqrt {\rho R^{3}/\sigma }$, is plotted as a function of $Bo$. The experimental data indicate a gravity dependency of $t_{bc}/t_c$ in the form
 \begin{equation} \frac{t_{bc}}{t_{c}}=0.26 Bo^{{-}0.1}. \end{equation}
Figure 6. The effect of Bond number on the dimensionless total time of cavity collapse  $t_{bc}/t_c$, where $t_c$ is the capillary time scale. —, ${t_{bc}/t_{c}=0.26 Bo^{-0.1}}$. In the inset, the dimensionless total time of cavity collapse, accounting for the path correction due to gravity, ${t_{bc}}/(t_c\mathscr {L})$, is plotted as a function of $Bo$. —, ${t_{bc}}/(t_c\mathscr {L})=0.13$ (3.10). $\triangle$, water; $\triangleleft$, ethanol; $\blacktriangle$, GW48 (30 $^{\circ }$C); $*$, GW68; $\lozenge$, GW72; $+$, 2-propanol; $\square$, GW55.
This Bond number dependence of  $t_{bc}$ can be physically explained by evaluating the time taken by the kink to travel along the cavity boundary. The length of the path travelled by the kink ( $s_{bc}$) along the cavity surface, from the rim till the bottom of the cavity (see figure 2d), is a function of $Bo$ because the static shape of the free-surface bubble depends on $Bo$. For $Bo\leq 1$
 \begin{equation} s_{bc}=({\rm \pi} R - s_f)Oh^n \approx ({\rm \pi} R - R_r)Oh^n, \end{equation}
where  $s_f=R \theta$ (see figure 2d), with $\theta =R_r/R$ for small $\theta$ and $R_r$ is the rim radius (see figure 1a), which is a function of $Bo$ (Puthenveettil et al. Reference Puthenveettil, Saha, Krishnan and Hopfinger2018). The factor $Oh^n$, where $n$ is a positive exponent, appears in (3.6) because the bottom radius of the conical cavity $r_b$ at the time $t=t_{bc}$ (see figure 2d) depends on $Oh$ (see figure 14). This dependence of $r_b$ on $Oh$ arises since the occurrence of capillary waves, which increase $r_b$ (Gordillo & Rodríguez-Rodríguez Reference Gordillo and Rodríguez-Rodríguez2019), depends on $Oh$. After substituting $s_{bc}$ from (3.6) in $t_{bc}\approx s_{bc}/U_t$, with $U_t$ given by (3.3), we obtain
 \begin{equation} {t_{bc}}\approx\frac{1}{\alpha_3}t_c \mathscr{L} \zeta, \end{equation}
where  $\zeta =Oh^n/{\mathcal {W}}_R$, with ${\mathcal {W}}_R$ given by (3.4) and
 \begin{equation} \mathscr{L}(Bo)={\rm \pi} -{R_r}/{R} \end{equation}
is the path correction term that accounts for the gravity dependence of the path length  $s_{bc}$ travelled by the kink. In (3.8), the dimensionless rim radius
 \begin{equation} R_r/R=\sqrt{4/3-2(1/Bo+1/Bo^2)+\sqrt{-4/3Bo^2+8/Bo^3+4/Bo^4}}, \end{equation}
when  $Bo\leq 1$ (Puthenveettil et al. Reference Puthenveettil, Saha, Krishnan and Hopfinger2018).
Equation (3.7) delineates the capillary effects on the total time of cavity collapse through  $t_c$, while the gravity and the viscous effects enter through $\mathscr {L}(Bo)$ and $\zeta$, respectively. The inset in figure 6 shows that the measured values of $t_{bc}/(t_c\mathscr {L})$ collapse onto
 \begin{equation} {t_{bc}}\approx0.13t_c\mathscr{L}, \end{equation}
for bubbles of various diameters with  $0.001< Bo<1$ and fluids of various viscosity with $0.001< Oh<0.1$. The deviation of the data from (3.10), when $Bo>1$, occurs because $s_{bc}$ starts to deviate from (3.6) and $R_r/R$ from (3.9) due to increasing deviations of the shape of the cavity from that of a truncated sphere. Equations (3.7) and (3.10) imply that $Oh^n/(\alpha _3{\mathcal {W}}_R)=0.13$ for the present range of $0.001< Bo<1$ and $0.001< Oh<0.1$. Then, the increase in $s_{bc}$ at larger $Oh$ due to decreasing $r_b$ (see (3.6) and figure 14) seems to be offset by increasing velocities due to increased damping of precursory capillary waves (see (3.2)), so that $t_{bc}$ becomes independent of $Oh$, as given by (3.10). The total time of cavity collapse then follows a capillary time scale $t_c$, modified by the term $\mathscr {L}$, which depends on $Bo$ through (3.8) and (3.9), with negligible dependence on viscosity.
3.1.3. Wavelength of precursor capillary waves and scaling of $U_t$

The  $Bo$ dependence of $t_{bc}$ given by (3.10) necessitates the modification of the wave damping scaling relation $\lambda /R \propto \sqrt {Oh}$ presented in Krishnan et al. (Reference Krishnan, Hopfinger and Puthenveettil2017), which was based on $t_{bc}\approx 0.3 t_c$, proposed by Krishnan & Puthenveettil (Reference Krishnan and Puthenveettil2015). It has been shown that the amplitudes of the capillary waves fall off exponentially in the form $a/a_0=e^{-\kappa t}$, where $a_0$ and $a$ are, respectively, an initial and a later wave amplitude, with $\kappa =8{\rm \pi} ^2 \mu /\rho \lambda ^2$ being the wave damping coefficient (Lighthill Reference Lighthill1978). The waves can be considered fully damped at the end of the cavity collapse time $t_{bc}$, when
 \begin{equation} \kappa t_{bc} = \frac{8{\rm \pi}^2 \mu t_{bc}}{\rho \lambda^2}=4, \end{equation}
as presented in Krishnan et al. (Reference Krishnan, Hopfinger and Puthenveettil2017). Substituting (3.10) for  $t_{bc}$ in (3.11) and rearranging, we obtain the dimensionless wavelength that is damped in the time $t_{bc}$ as
 \begin{equation} \frac{\lambda}{R}= {c_2}\sqrt{Oh{\mathscr{L}}}, \end{equation}
where  $c_2=0.5{\rm \pi}$. The relation (3.12) gives the largest damped wavelength at the bottom of the cavity for a given $Oh$ and $Bo$. It also predicts the $Oh$ at which a given wavelength will be damped at the bottom of the cavity for a specified $Bo$. For example, the experimental values corresponding to $Bo\approx 0.37$ are typically $\lambda /R\approx 0.4$, which, according to (3.12), when ${\mathscr {L}}\approx 2.5$, requires $Oh\approx 0.02$, the value below which precursory capillary waves are observed at the cavity bottom. Precursory capillary waves are formed at all $Oh$. These precursory capillary waves impart wave resistance to the moving kink before they are fully damped. However, the spatial location ahead of the kink at which the precursory capillary waves are fully damped depends on the value of $Oh$. Since $\lambda /R\simeq 0.4$, when $Oh\simeq 0.03$ precursor capillary waves are damped before arrival of the kink at the cavity bottom when $Oh\geq 0.03$. Practically, no precursor waves exist when $Oh\ge 0.04$.
The gravity dependency of the path correction  ${\mathscr {L}}$ is given by (3.8) and (3.9). Since $R_r/R$ increases with increasing $Bo$, as given by (3.9), ${\mathscr {L}}$ decreases when $Bo$ is increased. Thus, when $Bo$ is large, $Oh$ needs to be larger for the waves to be damped in the time $t_{bc}$.
Substituting  $\lambda /R$ from (3.12) in (3.3) and rearranging, we get
 \begin{equation} U_t\approx\frac{\alpha_3 U_c}{\sqrt{1 - c_2 \alpha_1 \sqrt{Oh {\mathscr{L}}}}}. \end{equation}
 In figure 5, the dimensionless tangential velocity  $U_t\sqrt {1 - c_2 \alpha _1 \sqrt {Oh {\mathscr {L}}}}/U_c$ is plotted against the dimensionless time $t/t_c$ for bubbles in water (yellow symbols) and GW72 (red symbols) in the range $2 \times 10^{-3} < Bo < 1$ and $0.001< Oh<0.05$, with the upper value of $Oh$ being somewhat larger than $0.03$ obtained above from (3.12). The data collapse onto
 \begin{equation} \frac{U_t\sqrt{1 - \sqrt{Oh {\mathscr{L}}}}}{U_c} = 4.5, \end{equation}
for  $0.05 < t/t_c < 0.3$, the uniform phase of tangential motion, implying that ${\alpha _1=1/c_2}$ and ${\alpha _3=4.5}$. In the limit $Oh\to 0$, the relation (3.14) matches with the relation for the absolute velocity (see figure 2c) of the dominant capillary wave, $U_{abs}\simeq {5U_c}$, proposed by Gordillo & Rodríguez-Rodríguez (Reference Gordillo and Rodríguez-Rodríguez2019), based on their numerical simulation in the vanishing Bond number limit $Bo\ll 0.1$. At finite $Bo$ and $Oh$, (3.14) captures the complex dependence of the kink velocity on $Oh$ and $Bo$ that occurs through the damping of the precursory capillary waves.
Comparing (3.14) with (3.3), shows that the wave resistance factor in (3.3) is of the form
 \begin{equation} {\mathcal{W}}_R(Oh,Bo)= \frac{1}{\sqrt{1- \sqrt{Oh {\mathscr{L}}}}}. \end{equation}
Then, the final scaling of the tangential velocity of the kink is  ${U_{t}}\approx 4.5 U_c {\mathcal {W}}_R$, where ${\mathcal {W}}_R$ is given by (3.15).
The constancy of  $U_t$ with respect to time, seen in figure 5, could also be understood in terms of the phase velocity of the precursory capillary waves. The kink produces a wave disturbance, of wavelength $\lambda$, at the cavity surface, which propagates like a capillary wave with a phase velocity $c_p=(2{\rm \pi} )^{1/2}\sqrt {{\sigma }/{\rho \lambda }}$. Substituting $\lambda$ from (3.12) in this relation gives
 \begin{equation} c_p =2.8U_c (Oh{\mathscr{L}})^{{-}1/4}, \end{equation}
which is close to (3.14), although the dependency on viscosity and gravity shown by (3.14) is not fully captured by  $c_p$. However, the important point is that the phase velocity of the precursory capillary wave does give an argument for $U_t$ being constant in time, as seen in figure 5.
3.2. Shrinking of the cavity boundary in the normal direction
In figure 7(a) the initial cavity boundary (the bubble boundary) at  $t=0$ is compared with that at a later instant ( $t=0.15$ ms) for a bubble of $R=0.5\,{\rm mm}$ in water. The cavity contours clearly indicate the retraction of the cavity in the normal direction everywhere below the kink rim, as indicated by the arrows. This cavity shrinkage is due to the sudden reduction of the gas pressure in the cavity after rupture of the surface film, leading to an imbalance with the surface tension force, which scales as ${\sigma /R}$.

Figure 7. Shrinking of the cavity in the normal direction. (a) Contours of the cavity at two time instances,  $t=0$ ms and $t=0.15$ ms, superimposed for a bubble of $R=0.5\,{\rm mm}$ in water. Arrows show the shrinking of the cavity boundary below the kink rim. The (red) lines superimposed over the static shapes of the bubbles in (b,c) indicate the trajectories of the kinks extracted from their cavity collapse. The bubbles in (b,c) are of similar size but differ significantly in $Oh$; (b) $R=2.15\,{\rm mm}$, $Bo=0.63$, $Oh=0.00255$ in water; (c) $R=2\,{\rm mm}$, $Bo=0.77$, and $Oh=0.0427$ in GW72. The widths of the images are $5.43\,{\rm mm}$ and $2.85\,{\rm mm}$.
In figure 7(b,c), the trajectories of the kink are indicated by the continuous (red) lines in the images of a bubble of  $R=2.15\,{\rm mm}$ in water and of a bubble of $R=2\,{\rm mm}$ in GW72, respectively. It is seen that the extent of shrinkage, i.e. the gap between the initial cavity contour and the red line, is larger for the bubble in the viscous fluid GW72 than it is in water. It is also seen that in the water bubble in figure 7(b) that the kink undergoes a sudden jump towards the end, while the trajectory of the kink in GW72 (figure 7c) is smooth throughout the collapse. A corresponding rise in the normal velocity of the kink in bubbles in water towards the end of the collapse is seen in figure 8, which shows the velocity of the kink in the direction normal to the cavity boundary, $U_n$, normalised with the capillary velocity, $U_c$, plotted as a function of the dimensionless time $t/t_c$. The velocity data also show a slow increase with time, indicating a weak acceleration, except in water, where toward flow convergence, $U_n/U_c$ values increase abruptly due to the presence of precursory waves, discussed in § 3.1. This sudden rise in velocity of the kink, by an order of magnitude, is a feature observed for bubbles in low-viscosity fluids of $Oh<0.02$, where precursory capillary waves are present. We show in Appendix B that the higher values of the normal velocity towards the end of the cavity collapse is of the order of the velocity scale $2\sqrt {\sigma /\rho \lambda }$. Figure 8 shows that the scaled normal velocities of the kink in the viscous fluid (GW72, ${Oh>0.02}$) are higher than those in water ( ${Oh<0.02}$); clearly, a capillary velocity scaling alone, as in the figure, does not collapse the normal velocities.
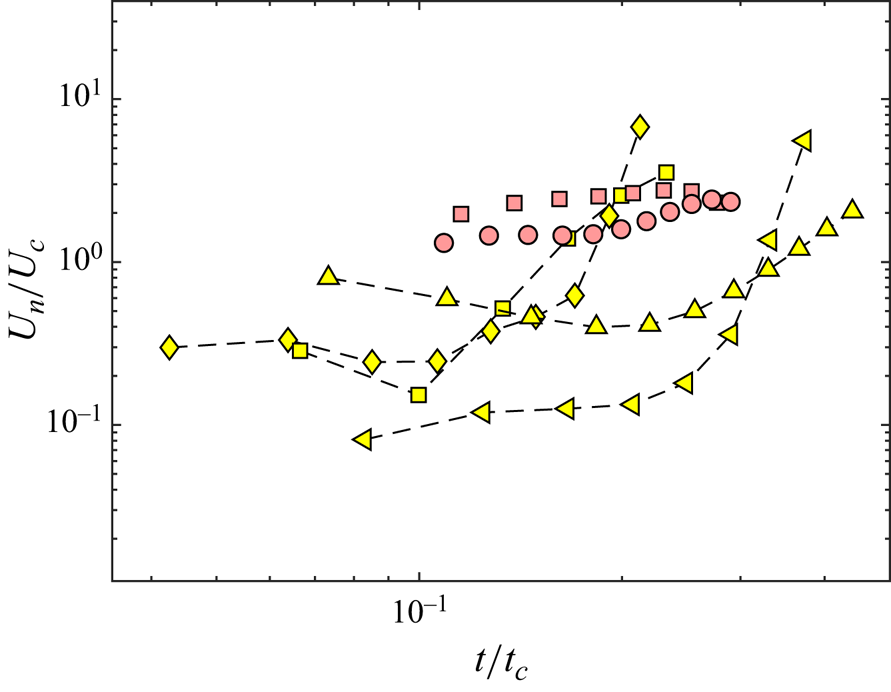
Figure 8. The dimensionless normal velocity of the leading edge  $U_n/U_c$ as a function of the dimensionless time $t/t_c$. The symbols are the same as those in figure 5, namely: ${\blacktriangle }$, yellow, $R=0.175\,{\rm mm}$ ( $Bo=4.2 \times 10^{-3}$, $Oh=0.0099$); ${\blacktriangleleft }$, yellow, $R=0.47\,{\rm mm}$ ( $Bo=3 \times 10^{-2}$, $Oh=0.0055$); ${\blacksquare }$, yellow, $R=1.74\,{\rm mm}$ ( $Bo=4.1 \times 10^{-1}$, $Oh=0.0028$) and ${\blacklozenge }$, yellow $R=2.14\,{\rm mm}$ ( $Bo= 6.3 \times 10^{-1}$, $Oh=0.00255$). Aforementioned data are from water. Data with GW72 are: ${\blacksquare }$, red $R=1.59\,{\rm mm}$ ( $Bo= 4.8 \times 10^{-1}$, $Oh= 0.0481$); ${\bullet }$, red $R=2.02\,{\rm mm}$ ( $Bo= 7.7 \times 10^{-1}$, $Oh=0.0427$).
It needs to be noted that a  ${\mathcal {W}}_R$ correction of $U_n/U_c$, as applied to the dimensionless tangential velocity $U_t/U_c$ earlier (see (3.3)) to account for the precursor capillary wave effects, does not collapse the normal velocity data. To address this scaling problem, we now analyse the average velocity of shrinkage of the cavity in two mutually perpendicular directions, viz., (i) in the equatorial plane in the horizontal direction, where the local radius of the cavity from its vertical axis of symmetry is maximum, and (ii) in the meridional plane along the vertical axis of symmetry (see figure 2d).
3.2.1. Average normal shrinkage velocity in the equatorial plane and along the vertical axis
Figure 9(a) shows the average shrinkage velocity normal to the cavity boundary in the equatorial plane  ${\bar {U}}_{ne} = D_{ne}/t_{e}$, scaled with the capillary velocity scale, as a function of $Bo$. Here, $D_{ne}$ is the average normal displacement of the cavity surface in the equatorial plane over a time $t_e$, where $t_e$ is the time taken for the kink to reach the equatorial plane; these are shown in figure 2(d). It is seen in figure 9(a) that ${\bar {U}}_{ne}/U_c$ is independent of $Bo$ and scales as
 \begin{equation} {\bar{U}}_{ne}=0.35{U_c}. \end{equation}
Thus, in the equatorial plane, where there is symmetry in the azimuthal direction, the velocity of shrinking scales with the capillary velocity  $U_c$, devoid of any viscous and gravity effects.

Figure 9. (a) Variation of the dimensionless average shrinkage velocity at the equatorial plane ( ${\bar {U}}_{ne}/U_c$) with $Bo$. — , ${\bar {U}}_{ne}/U_c=0.37$. (b) Dimensionless shrinkage of the cavity bottom, ${D_{nb}}/(R{\mathcal {W}}_R)$, plotted as a function of $Bo$. —, ${D_{nb}}/(R{\mathcal {W}}_R)= 0.14(Z_{c}/R)$. $\triangle$, water; $\blacktriangle$, GW48 (30 $^{\circ }$C); $\square$, GW55; $*$, GW68; $\lozenge$, GW72; $+$, 2-propanol; $\triangleleft$, ethanol.
On the contrary, the normal shrinkage at the cavity bottom is strongly dependent on  $Bo$, as is seen in figure 9(b), where the dimensionless normal distance of shrinking at the bottom of the cavity $D_{nb}/R$ over a time $t_{bc}$, corrected by ${\mathcal {W}}_R$, similar to that in figure 5, is plotted as a function of $Bo$. The variation of the data in the figure is well represented by the variation of the normalised cavity depth $Z_c/R$ with $Bo$, obtained using the closed form solution for $Z_c/R$ in terms of $Bo$, given by Puthenveettil et al. (Reference Puthenveettil, Saha, Krishnan and Hopfinger2018) as (C1); this representation reveals the dependence of $D_{nb}$ on $Z_c$. Thus, the expression of the best fit of the data in figure 9(b) is
 \begin{equation} {D_{nb}}/(R{\mathcal{W}}_R)= 0.14(Z_{c}/R). \end{equation}
The average velocity of cavity shrinking at the bottom is  ${\bar {U}}_{nb} = D_{nb}/t_{bc}$. Using (3.18) and $t_{bc}$ from (3.10), the average vertical shrinking rate of the cavity bottom then becomes
 \begin{equation} \frac{\bar{U}_{nb}}{U_c} = \frac{Z_c}{R} \frac{\mathcal{W}_R} {\mathscr{L}}, \end{equation}
where  $Z_c/R$ is the static aspect ratio of the cavity, given by (C1). Equation (3.19) shows that the precursory capillary waves act as deformations on the cavity surface, reducing cavity shrinking velocity at the bottom of the cavity, when $Oh<0.02$. This reduced shrinking velocity of the cavity in low-viscosity fluids can also be seen in figure 8. The resulting capillary velocity scaling of $\bar {U}_{nb}$ is in agreement with the radial velocity scaling of the cavity in the inviscid limit, proposed by Gañán Calvo & López-Herrera (Reference Gañán Calvo and López-Herrera2021) for $Oh\ll 0.04$. However, the present $\bar {U}_{nb}$ differs from the viscous–capillary velocity ( $V_{\mu }$) dependence of radial velocity proposed by Gañán Calvo & López-Herrera (Reference Gañán Calvo and López-Herrera2021), for the final stage of collapse at around $Oh=0.04$. This difference is possibly due to the fact that $\bar {U}_{nb}$ is the velocity averaged over $t_{bc}$, which may not capture the sharp changes in velocities near the flow convergence. In fact, a direct comparison of our results (both tangential and normal velocities of the interface) with Gañán Calvo & López-Herrera (Reference Gañán Calvo and López-Herrera2021) is difficult because the scalings presented in Gañán Calvo & López-Herrera (Reference Gañán Calvo and López-Herrera2021) are based on the liquid motion, whereas ours are based on the interface movement.
In any case, it is clear from (3.19) and (3.14) that the bottom interface of the cavity, prior to the flow convergence, closes with two different velocity scales, originating from two different physical mechanisms. As we discuss in Appendix A, the velocities normal to the cavity need to be considered while modelling the jet, so as to correctly balance the mass flux associated with the cavity collapse. We show in § 4 that the mass flux, which is entirely due to the radial shrinking of the cavity with normal velocity  $U_n$, is capillary–gravity dependent, and thus is the reason for the unusual gravity dependence of jet velocity for $Bo>0.1$, reported earlier (Krishnan et al. Reference Krishnan, Hopfinger and Puthenveettil2017). It is also of interest to note that the cavity shrinking velocity at the equatorial plane ${\bar {U}}_{ne}$ (3.17) is independent of $Oh$. This is in contrast with that of ${\bar {U}}_{nb}$ (3.19), which has a dependence on viscosity through ${\mathcal {W}_R}$, the wave resistance factor, due to the presence of precursory capillary waves. This difference is expected to be because the precursory capillary waves affect the cavity collapse only after the kink crosses the equatorial plane. In the final phase of cavity collapse, i.e. at the arrival of the kink at the cavity bottom, the rise in the normal velocity in low-viscosity fluids is almost an order of magnitude higher (see figure 8) than that in fluids of high viscosity. This rise in $U_n$ occurs when the capillary waves converge at the cavity bottom (see Appendix B).
Finally, to demonstrate the overall shrinking of the cavity, irrespective of the tangentially moving kink, a free-surface bubble of radius  $R=1.7\,{\rm mm}$ was produced in a highly viscous fluid (GW89; $Oh=0.52$). Since the retraction of the rim is fully damped for $Oh>0.24$ (see Krishnan et al. Reference Krishnan, Puthenveettil and Hopfinger2020), we expect the rim retraction, and consequently the kink, to be fully suppressed in this case. Figure 10 shows an image sequence of such a clean spherical shrinking of the cavity surface in the absence of a kink (or tangential movement). This image sequence gives an additional confirmation for the existence of two independent interface dynamics associated with free-surface bubble collapse, viz. (i) a tangential wave propagation velocity of the kink driven by the retraction of the rim, and (ii) an overall spherical shrinking of the bubble cavity due to the sudden reduction of gas pressure.

Figure 10. Collapse of a bubble of radius  $R=1.7\,{\rm mm}$ ( $Bo=0.54$) in a high viscous fluid (GW89, $Oh=0.52$). The times corresponding to each image are $t=0$, $2$,
$2$,  $3.25$, $4.75$ and $6$ ms. Width of each image is $3.84\,{\rm mm}$.
4. The cavity filling rate
Three volume fluxes can be identified in relation with the movement of the cavity boundary, as indicated in figure 2(b), and measured, as discussed in § 2. Figure 11(a) shows the contours of the collapsing cavity of a bubble of radius  $R=0.175\,{\rm mm}$ in water, at different time instances, starting from the static shape of the cavity at $t=0$ until a conical shape is reached. The volume fluxes that can be identified from the figure, and marked by arrows in the figure, are (i) the side (tangential) volume influx $Q_s$, (ii) the bottom (normal) influx $Q_b$ and (iii) the side volume outflux $Q_o$, with the total filling rate being $Q_T=Q_s+Q_b$. Figure 12 shows the variation of the side volume influx $Q_s$ (denoted by hollow symbols) and the total volume influx $Q_T$ (solid symbols) as a function of time, for different size bubbles, in water and GW48. The horizontal and vertical axes in figure 12 span three orders of magnitude of time and volume flux, respectively. The difference between $Q_T$ and $Q_s$ in figure 12 corresponds to the bottom influx $Q_b$ at any given time. The inset in figure 12 shows the variation of the volume outflux $Q_o$ with time, measured for a bubble of radius $R=0.175\,{\rm mm}$ in water. The volume outflux $Q_o$ is not entirely negligible. However, since it is practically constant in time and since $Q_T$ is constant, $Q_{T}-Q_{o}$ is also a constant so that the volume expansion of the cavity at the free surface ( $Q_o$) will not change the functional behaviour of $Q_T$ with time. Therefore, $Q_o$ is not considered further in our analysis. As expected, all the volume fluxes increase with increase in bubble size.

Figure 11. (a) Superimposed contours of collapsing cavity at different time instances of bubble  $R=0.175\,{\rm mm}$ in water, starting from the static shape at $t=0$ until the conical cavity shape is reached. The successive contours are separated by $10\,\mathrm {\mu }{\rm s}$. See movie 3. (b) Contours of initial static cavity configuration, at $t=0$, and at a later time $t>0$. The figure shows the various parameters related with the moving kink; the free surface is indicated by FS.

Figure 12. The rate of filling of the cavity from the tangential direction,  $Q_s$ (hollow symbols), and the total filling rate $Q_T$ (solid symbols) as functions of time, for bubbles of different $Bo$ and $Oh$.
$Oh$.  $\lozenge$, $R=2.15\,{\rm mm}$ ( $Bo=0.63$, $Oh=0.00255$); $\square$, $R=1.89\,{\rm mm}$ ( $Bo=0.49$, $Oh=0.0027$); $\bigcirc$, $R=1.47\,{\rm mm}$ ( $Bo=0.3$, $Oh=0.0031$); $\triangleleft$, $R=0.47\,{\rm mm}$ ( $Bo=0.03$, $Oh=0.0055$); $\triangle$, $R=0.175\,{\rm mm}$ ( $Bo=0.0042$, $Oh=0.0099$) (all data in water). $\triangleright$, $R=1.04\,{\rm mm}$ ( $Bo=0.17$, $Oh=0.0139$) in GW48. The volume outflux, $Q_o$, measured for $R=0.175\,{\rm mm}$ in water, is shown in the inset.
Each data set of  $Q_{T}$ shows an approximately constant value with time, indicated by a horizontal dashed line, and then suddenly drops off when $t>t_{bc}$. This sudden change in $Q_T$ is indicative of an unaccounted volume outflux, due to the creation of the jet inside of the cavity, coinciding with the conical cavity shape. Recently, Gordillo & Blanco-Rodríguez (Reference Gordillo and Blanco-Rodríguez2023) numerically estimated the radial flow rate per unit length of the cavity and observed that this liquid flow rate remains approximately constant for a very short time duration immediately after $t=t_{bc}$, due to liquid inertia and mass conservation during the short duration after jet initiation. Even though we measure the rates of changes of the cavity boundary volumes, which cannot be directly connected to the flow rates of the liquid outside the cavity, the approximately constant slope of $Q_T$ vs $t$ after jet initiation could be related to such a constant radial liquid flow rate; these need to be investigated in future.
The side volume flux  $Q_s$, which is initially a small fraction of $Q_T$, increases with time and represents nearly the total volume flux when the cavity becomes a cone. We now obtain a scaling for this $Q_s$ as follows. The characteristic area of the side flux is $2{\rm \pi} R \bar {z}'(t)$, where $\bar {z}'(t)$ is the height above the kink up to the free-surface level (see figure 11b), with the velocity being the tangential velocity of the kink $U_t$ (§ 3.1). Although the kink moves with a velocity $U_t$, the upper interior region of the concave boundary lags behind the kink (see $A$ in figure 2c), as the velocity of the interior fluid and the velocity of the interface need not be the same, an aspect clarified in §§ 1 and 3. Such a velocity difference inside the side boundary implies the existence of a shear region, which needs to be accounted for in the side volume flux. Hence, we include a viscous correction term of the form $Oh^d$ to estimate the side flux as $Q_s\sim 2{\rm \pi} R U_t Oh^d \bar {z}'(t) \sim 2{\rm \pi} R U_t Oh^d (R-R\cos \phi )$, which then yields
 \begin{equation} \frac{Q_s}{{\rm \pi} R^2 U_t Oh^d}\approx {\mathsf{a}}_{{\mathsf{0}}} + {\mathsf{a}}_{{\mathsf{1}}} \sin^2 (\phi/2), \end{equation}
where  ${\mathsf{a}}_{{\mathsf{0}}}$ and ${\mathsf{a}}_{{\mathsf{1}}}$ are constants to be determined from the experiments. In (4.1) $\phi ={\omega t}+\phi _0$ is the phase angle of the moving kink (see figure 11b), where $\omega$ is the circular frequency and $\phi _0\approx \theta$ (see figure 2d) is the phase angle when the cavity opens. In the inset of figure 13 the dimensionless side volume flux $Q_s/{\rm \pi} R^2 U_t Oh^{-0.12}$ is plotted against the dimensionless time $t/t_{bc}$. Equation (4.1) collapses the data, with the final expression based on the data fit being
 \begin{equation} \frac{Q_s (t)}{{\rm \pi} R^2 U_t Oh^{{-}0.12}} = 0.12 + 0.15 \sin^2 \left(\frac{0.5{\rm \pi} t}{t_{bc}}\right). \end{equation}
The first term on the right-hand side of (4.2), the  $y$-intercept in the inset of figure 13, is interpreted as the initial side flux. The usage of a $y$-intercept was necessary because of the lack of experimental data around the initial time $t=0$.

Figure 13. Variation of the dimensionless total volume influx  $Q_{T}/2{\rm \pi} R Z_c U_c$ and the dimensionless volume influx in the (bottom) normal direction $Q_b/2{\rm \pi} Z_c R U_c$ as a function of the dimensionless time $t/t_{bc}$. The inset figure shows the volume influx along the tangential direction $Q_s$, non-dimensionalised with ${\rm \pi} R^2 U_tOh^{-0.12}$, plotted against the dimensionless time $t/t_{bc}$. — (black), $Q_{T}/2{\rm \pi} R Z_c U_c=1$; — (red), $Q_b(t)/2{\rm \pi} Z_c R U_c = 0.5\cos ^2 (0.42{\rm \pi} {t}/{t_{bc}})$; — (blue), $Q_s(t)/{\rm \pi} R^2 U_t Oh^{-0.12} = 0.13 + 0.15\sin ^2 (0.5{\rm \pi} {t}/{t_{bc}})$. Symbols with dots represent the volume influx in the (bottom) normal direction $Q_b$. The rest of the symbols are the same as in figure 12.
We now consider the scaling of the bottom flux. The characteristic area below the kink is  $2{\rm \pi} R \bar {z}(t)$, where $\bar {z}(t)$ is the vertical distance between the kink and the cavity bottom (see figure 11b). The velocity of shrinking in the equatorial plane follows the capillary velocity (see (3.17)). Hence, the normal influx below the kink is $Q_b\sim 2{\rm \pi} R \bar {z}(t) U_c \sim 2{\rm \pi} R U_c (Z_c-R(1-\cos \phi ))$. Taking $2R/Z_c\approx 1$ for small $Bo$ (Puthenveettil et al. Reference Puthenveettil, Saha, Krishnan and Hopfinger2018) results in the simplified relation
 \begin{equation} \frac{Q_b}{2{\rm \pi} R Z_c U_c}\approx {\mathsf{a}}_{{\mathsf{2}}} \cos^2 (\phi/2), \end{equation}
where  ${\mathsf{a}}_{{\mathsf{2}}}$ is a numerical prefactor. Figure 13 shows that (4.3) collapses the $Q_b$ data at various $Bo$ and $Oh$, with the best fit relation for the non-dimensional bottom flux, $Q_b(t)/2{\rm \pi} R Z_c U_c$, shown in figure 13 being
 \begin{equation} \frac{Q_b (t)}{2{\rm \pi} R Z_c U_c} = 0.5 \cos^2 \left(\frac{0.42{\rm \pi} t}{t_{bc}}\right). \end{equation}
The phase angle of  $Q_s$ in (4.2), ${\rm \pi} t$, is slightly larger than that of $Q_b$ in (4.4), $0.84{\rm \pi} t$, an artefact of the side flux area being at the top of the bottom flux area.
We now assume that the retracting rim solely creates a wave-like propagating disturbance without causing any effective mass transfer down the cavity. Then, the total cavity filling rate  $Q_T\approx (Q_b+Q_s)|_{t\rightarrow 0}\approx 2{\rm \pi} R Z_c U_c$. This means that the initial side flux in (4.2) is then due to the normal shrinking. Figure 13 shows that $Q_{T}/2{\rm \pi} R Z_c U_c$ collapses the data reasonably well. From the plot, the equation of best fit is
 \begin{equation} \frac{Q_{T} (t)}{2{\rm \pi} R Z_c U_c} \approx 1, \end{equation}
validating our assumptions to arrive at the above relation.
Equation (4.5) shows that the total volume flux is entirely due to the normal shrinkage velocity of the cavity. When  $Bo<0.1$, the normalised cavity depth $Z_c/R\rightarrow 2$ (Puthenveettil et al. Reference Puthenveettil, Saha, Krishnan and Hopfinger2018), and is independent of $Bo$. Then, $Q_T\simeq 4{\rm \pi} R^2 U_c$, so that gravity effects in $Q_T$ becomes negligible. Gravity effects become significant in $Q_T$ through the $Bo$ dependency of $Z_c$, given by (C1), in the moderate to large bubble size range ( $Bo>0.1$). As we show in Appendix A, towards $t=t_{bc}$, when the cavity becomes conical, if we assume that the total mass flux $\rho Q_T$, where $Q_T$ is given by (4.5), initiates a jet by momentum exchange, we then retrieve the observed jet velocity scaling.
5. Conclusions
The disintegration of the thin film at the top of the floating bubble, and the rim retraction that follows, leads to the formation of a kink (intersection of the concave with the convex cavity boundary) that propagates as a capillary wave with a velocity  $U_t$ tangentially along the cavity boundary. Precursory capillary waves move ahead of this kink. Simultaneously, the cavity shrinks with a normal velocity $U_n$ due to the sudden reduction of the gas pressure after the film rupture. The tangential motion of the kink, combined with the overall inward shrinkage of the cavity due to reduction in gas pressure is a unique feature of surface bubble cavity collapse, not encountered in open cavity collapse problems as treated by Zeff et al. (Reference Zeff, Kleber, Fineberg and Lathrop2000), Bergmann et al. (Reference Bergmann, van der Meer, Stijnman, Sandtke, Prosperetti and Lohse2006), Bartolo et al. (Reference Bartolo, Josserand and Bonn2006), Duclaux et al. (Reference Duclaux, Caille, Duez, Ybert, Bocquet and Clanet2007), Das & Hopfinger (Reference Das and Hopfinger2008), Benusiglio, Quéré & Clanet (Reference Benusiglio, Quéré and Clanet2014), Thoroddsen et al. (Reference Thoroddsen, Takehara, Nguyen and Etoh2018), Yang, Tian & Thoroddsen (Reference Yang, Tian and Thoroddsen2020) and Krishnan, Bharadwaj & Vasan (Reference Krishnan, Bharadwaj and Vasan2022).
An increase in fluid viscosity increases the tangential kink velocity because of the progressive damping of the precursory capillary waves, with complete damping occurring when  $Oh=0.02$. Using an energy model of the main wave upstream of the kink, we show that ${U_{t}}\approx 4.5 U_c {\mathcal {W}}_R$ (3.14), where $U_c$ is the capillary velocity, ${\mathcal {W}}_R= { (1-\sqrt {Oh{\mathscr {L}}})^{-1/2}}$ (3.15) is the wave resistance factor, with $\mathscr {L}(Bo)={\rm \pi} -{R_r}/{R}$ (3.8) being the correction for the path length of the travel of the kink, $Oh$ the Ohnesorge number, $Bo$ the Bond number and $R_r$ the rim radius.
The sudden release of compressed gas from the bubble cavity, immediately after the thin film rupture, causes an overall inward shrinking of the cavity. It produces a normal velocity component of the kink. In the horizontal equatorial plane, the normal velocity scales with  $U_c$ (3.17), devoid of viscous and gravity effects. In contrast, the bottom part of the cavity shrinks vertically upwards with a velocity ${U_c (Z_c/R) {\mathcal {W}}_R}{{\mathscr {L}}}^{-1}$ (3.19). The viscous effect on the vertical shrinkage at the bottom, ${\mathcal {W}}_R$, is due to the deformations by the precursory capillary waves on the cavity. The gravity effect on this shrinkage originates from the initial static geometry of the cavity, indicated by the aspect ratio of the cavity $Z_c/R$, and the path correction $\mathscr {L}$.
The total time of cavity collapse is shown to scale as  ${t_{bc}}\approx 0.13 t_c{\mathscr {L}}$ (3.10) with the gravity dependency being due to the $Bo$-dependency of the kink trajectory ${\mathscr {L}}$. This leads to the understanding that the damping of the precursory capillary waves follows a modified relation $\lambda /R\approx {Oh^{1/2}{\mathscr {L}}^{1/2}}$ (3.12), indicating that the damping slightly decreases with an increase in Bond number.
The mass flux of cavity filling,  $\rho Q_T$, consists of a sum of the side flux $\rho Q_s$ and the normal bottom flux $\rho Q_b$. We show that $Q_T\approx 2{\rm \pi} RZ_c U_c$ (4.5), which, through its dependence on the aspect ratio of the cavity $Z_c/R$, is a function of $Bo$. The entire magnitude of $\rho Q_T$ originates from the normal shrinkage of the cavity, confirming that the kink movement, initiated by the rim retraction, is a wave propagation with no effective mass transfer. Indeed, the tangential velocity $U_t$, which is constant with respect to time for a given bubble, corresponds closely to the phase velocity of a capillary wave of wavelength $\lambda$, i.e. $U_t\approx {c_p}$ (3.16), where $c_p=(2{\rm \pi} )^{1/2}\sqrt {{\sigma }/{\rho \lambda }}$. With the experimental value of $\lambda /R\approx {0.36}$, we get $c_p\approx 4.2U_c$, which is close to $U_t$ (3.14), neglecting the weak dependency on viscosity and gravity. The role of outflux $Q_o$ in the cavity collapse has not been analysed in this paper. This outflux becomes relevant in deciding the far field conditions at the free surface, and hence, can potentially influence the flow field around the cavity interface.
At the bottom of the cavity, there is an exchange of momentum, via pressure build-up, between the mass flux  $\rho Q_T$ of the cavity and the initial mass flux of the jet, $\rho {\rm \pi}{r_b}^2U_j$, where $r_b$ is the base radius of the cavity and $U_j$ the jet velocity (see Appendix A). This exchange gives a jet Weber number scaling of $(U_j/U_c)^2\sim (Z_cR/{r_b}^2)^2$, the same scaling relation as proposed by Krishnan et al. (Reference Krishnan, Hopfinger and Puthenveettil2017).
Supplementary movies
Supplementary movies are available at https://doi.org/10.1017/jfm.2024.26.
Funding
The authors would like to acknowledge the partial financial support from DST, Government of India, under the FIST Grants SR/FST/ETII-017/2003, SR/FST/ETII-064/2015 and the Core Research Grants SR/S3/MERC/028/2009, CRG/2021/007497 for this study.
Declaration of interests
The authors report no conflict of interest.
Appendix A. Momentum balance at the cavity bottom
Deike et al. (Reference Deike, Ghabache, Liger-Belair, Das, Zaleski, Popinet and Séon2018) and Duchemin et al. (Reference Duchemin, Popinet, Josserand and Zaleski2002) observed in their numerical simulations, two successive velocity (or pressure) peaks at the cavity bottom, with the second peak being the highest. Considering the initial peak to be due to the capillary waves, and the second one to be due to the kink, the momentum of the precursor waves is then not significant, compared with that of the kink, an aspect clarified by Gañán Calvo (Reference Gañán Calvo2018). However, the volume flux (or mass flux) is associated with the capillary velocity  $U_c$ due to the normal shrinking of the cavity (see (4.5)), while $U_t$ is only a propagation velocity, carrying little mass. The rate of change of momentum of the liquid of the collapsing cavity is then ${{\rm d}}(mU_c)/{{\rm d}t}$, where $m$ is the associated liquid mass. Differentiation gives $\dot {m}U_c+m\dot {U_c}$, where $\dot {m}$ is the mass flux of the cavity collapse. Since $U_c$ is a constant with respect to time, we get
 \begin{equation} \frac{{\rm d}}{{\rm d}t}(mU_c)=\dot{m}U_c. \end{equation}
The momentum flux in (A1) will appear as a force during the axisymmetric flow-convergence at the cavity bottom. The corresponding pressure build-up is
 \begin{equation} p\simeq{\dot{m}U_c}/2{\rm \pi} {r_b}^2, \end{equation}
where  $2{\rm \pi} {r_b}^2$ is the characteristic area at the base of the cavity of bottom radius $r_b$ (see figure 2d). The radius $r_b$ is a characteristic value, which is an upper limit of the cavity bottom radius, which decreases with time during the flow convergence. The reader is referred to Eggers et al. (Reference Eggers, Fontelos, Leppinen and Snoeijer2007), Eggers & Fontelos (Reference Eggers and Fontelos2015) and to the recent work of Gañán Calvo & López-Herrera (Reference Gañán Calvo and López-Herrera2021) for detailed discussions on the dynamics of the local cylindrical collapse within the length scale $r_b$, at the cavity bottom. By substituting the total mass influx $\dot {m}=\rho Q_T$ from (4.5) in (A2), we get an estimate of the pressure at the bottom of the cavity at flow convergence as
 \begin{equation} p\simeq \left(\frac{Z_c}{R}\right){\rho {U_c}^2}\left(\frac{R}{r_b}\right)^2. \end{equation}
Equation (A3) shows that the pressure build-up at the bottom of the cavity, has primarily a capillary–inertial scaling, of the form  $\rho {U_c}^2$. As the aspect ratio of the cavity ${Z_c}/{R}$ is a function of $Bo$, as given by (C1) (Puthenveettil et al. Reference Puthenveettil, Saha, Krishnan and Hopfinger2018), $p$ also depends on $Bo$. Similarly, the effect of precursory capillary waves on $p$ is accounted for by the term $(R/r_b)^2$ in (A3). As we discuss later, a reduced area of impact, due to lower $r_b$ in the absence of capillary waves, increases the impact pressure.
The pressure impulse of the impact  $I=\int _{t_i}^{t_f} p\,{\rm d}t$, where the subscripts $i$ and $f$ denote the initial and the final values of time $t$, is estimated to be
 \begin{equation} I\approx p\Delta t, \end{equation}
where  $\Delta t=t_f -t_i$ is the characteristic time scale of the impact. The natural choice of this time scale of impact, since the flow convergence is capillary driven, is
 \begin{equation} \Delta t\simeq {r_b}/{U_c}. \end{equation}
The vertical jet velocity is
 \begin{equation} U_j={-}\boldsymbol{\nabla} ({I}/{\rho}), \end{equation}
since the gradient of pressure impulse drives the jet in the axial direction. Substituting (A3) and (A5) in (A4) and the resulting expression for  $I$ in (A6), we obtain
 \begin{equation} U_j \simeq \boldsymbol{\nabla}\left(\frac{ R Z_c {U_c}}{r_b}\right). \end{equation}
Approximating the gradient operator  $\boldsymbol {\nabla }$ as $1/r_b$, gives the jet Weber number $We_j$ as
 \begin{equation} We_j = \left(\frac{U_j}{U_c}\right)^2\sim \left(\frac{Z_c}{R}\right)^2 \left(\frac{R}{r_b}\right)^4, \end{equation}
with the ratio  $R/r_b$ depending on the presence, or absence, of the precursor capillary waves. The presence of precursory capillary waves in low $Oh$ results in a larger cavity base radius $r_b$ (see figure 3i), in comparison with that at larger $Oh$ (see figure 4i).
Figure 14 shows the measurements of  $r_b$, non-dimensionalised with $R$, and corrected using an $Oh$ factor to account for the precursory capillary waves effect, plotted as a function of $Bo$. The figure shows that the data falls on to a horizontal line, indicating a linear dependence of $r_b$ with the bubble radius $R$, and that the vertical offsets between the data sets due to precursory capillary waves are reduced by using an $Oh^{-0.15}$ factor. The best fit power law relation, shown as the solid line in the figure, is
 \begin{equation} r_b\approx0.1 R Oh^{{-}0.15}, \end{equation}
which is valid for  $0.002< Oh<0.035$ and $10^{-3}< Bo<1$. Substituting (A9) in (A8), yields
 \begin{equation} We_j\sim (Z_c/R)^2 Oh^{0.6}, \end{equation}
which is the same scaling as that proposed by Krishnan et al. (Reference Krishnan, Hopfinger and Puthenveettil2017), with a small variation in the exponent of  $Oh$.
$Oh$.

Figure 14. Variation of the dimensionless bottom radius ( $r_b/R$) of the cavity, with an $Oh$ correction, with the Bond number $Bo$.
$Bo$.  $\triangle$, water; $\triangleleft$, ethanol; $\blacktriangle$, GW48 (30 $^{\circ }$C); $\square$, GW55; —, $r_b=0.075~R~Oh^{-0.15}$.
Appendix B. Sudden rise in normal velocity $U_n$

The rise in normal velocity at the bottom of the cavity, observed in low-viscosity fluids in figure 8, is due to the convergence of precursory capillary waves at the bottom of the cavity, and the subsequent momentum exchange at the interface. These higher velocities can be obtained as in the case of an analogous problem of waves on the surface of a drop impacting a solid surface, studied by Renardy et al. (Reference Renardy, Popinet, Duchemin, Renardy, Zaleski, Josserand, Drumright-Clarke, Richard, Clanet and Quéré2003). During wave focusing at the bottom of the cavity, the local cylindrical radius of the cavity  $r \simeq \lambda$, where $\lambda$ is the wavelength. The inward pull due to the unbalanced surface tension along the azimuthal direction is $F_{\sigma }=2{\rm \pi} \lambda \sigma$. The rate of change of momentum of the interface ${\rm d}P/{\rm d}t={\rm \pi} \rho \lambda ^3 V_b/t_{c \lambda }$, where the time scale over which the momentum changes $t_{c \lambda }=\sqrt {\rho \lambda ^3/\sigma }$, and $V_b$ is the normal velocity at the bottom of the cavity. Equating ${\rm d}P/{\rm d}t$ with $F_{\sigma }$ results in an approximate estimate of the higher values of the normal velocity at the bottom of the cavity as $V_b\simeq 2\sqrt {\sigma /\rho \lambda }$. Substituting $\lambda \approx 0.4 R$ (Krishnan et al. (Reference Krishnan, Hopfinger and Puthenveettil2017)) in $V_b$, an order of magnitude higher value of velocity, in comparison with (3.19), is obtained.
Appendix C. Solution for $Z_c(Bo)$ by Puthenveettil et al. (Reference Puthenveettil, Saha, Krishnan and Hopfinger2018)

The closed form solution for the dimensionless cavity depth, when  $Bo\leq 1$, is expressed as
 \begin{equation} \frac{Z_c(Bo)}{R}=\mathscr{F} - \frac{\chi \xi (\mathscr{F} + 2/Bo)}{16+8\chi \xi \sqrt{Bo} + \xi^2(4+Bo(\chi^2+4\mathscr{F})+Bo^2{\mathscr{F}}^2)}, \end{equation}
where  $\chi ={\rm K}_0((R_r/R){Bo}^{1/2})/{\rm K}_1((R_r/R){Bo}^{1/2})$, $\xi =({1-(\mathscr {G}-\mathscr {H}-(1/3))})^{1/2}$ and $\mathscr {F}=1+({\mathscr {G}-\mathscr {H}-(1/3)})^{1/2}$. Here, $R_r/R$ is the dimensionless rim radius given by (3.9), ${\rm K}_0$ is the modified Bessel function of the second kind of order zero, ${\rm K}_1$ is the first derivative of ${\rm K}_0$ with respect to its argument, $\mathscr {G}=2(1/Bo + 1/Bo^2)$, and $\mathscr {H}=(-4/(3Bo^2) +8/Bo^3 +4/Bo^4)^{1/2}$.


