


1. Introduction
Vortex-induced vibration (VIV) of a rigid cylinder and its control are of practical importance in a range of applications. The phenomenon has garnered extensive interest owing to its widespread occurrence and significant impact on the safety and performance of engineering structures subjected to fluid dynamics. In the pursuit of improved understanding and effective mitigation of the VIV problem, researchers have explored a variety of approaches, ranging from experimental investigations to numerical simulations and theoretical analyses. Relevant review articles include Bearman (Reference Bearman1984), Williamson & Govardhan (Reference Williamson and Govardhan2004), Sarpkaya (Reference Sarpkaya2004) and Gabbai & Benaroya (Reference Gabbai and Benaroya2005). As such, the study of VIV continues to be an active area of research, with ongoing efforts focused on gaining new insights and developing innovative control strategies.
1.1. Mechanism of VIV
A substantial number of studies have focused on understanding the mechanism of VIV, especially the frequency lock-in phenomenon, by applying either experimental or numerical methods. Researchers (Bishop & Hassan Reference Bishop and Hassan1964; Feng Reference Feng1968) have found that the vibration frequency of the cylinder no longer follows the vortex shedding frequency but becomes consistent with the natural frequency of the cylinder as the natural frequency approaches the vortex shedding frequency of the fixed cylinder. This unusual phenomenon is called frequency ‘lock-in’. Later, the lock-in phenomenon and VIV at subcritical Reynolds numbers ( $Re < 47$) were verified in experiments and simulations (Buffoni Reference Buffoni2003; Mittal & Singh Reference Mittal and Singh2005). Bourguet (Reference Bourguet2023) found that forced rotation could even enhance cylinder VIV at a subcritical Reynolds number. However, there has been ongoing discussion regarding the mechanism of the lock-in phenomenon. Since the work of Den Hartog (Reference Den Hartog1985) and Blevins (Reference Blevins1979), the conventional view has been that large-amplitude oscillations occurring at velocities where the vortex shedding frequency is comparable to the natural frequency are caused by resonance. Yet, this interpretation has its limitations for explaining why VIV can happen at subcritical Reynolds numbers and the maximum amplitude is not at the resonance point. De Langre (Reference De Langre2006) utilized a semi-empirical model which neglected all nonlinear and dissipative terms. The results show that the frequency lock-in is primarily caused by the coupled-mode flutter. This idea opens up a new perspective for the interpretation of the frequency lock-in phenomenon, although it was not widely accepted at first because of the simplified semi-empirical model.
Given the complexity of fluid–structure interaction (FSI) problems and the lack of ideal theoretical models, direct experimental and numerical methods have difficulty in addressing the underlying physical mechanisms of frequency lock-in in VIV. Thus, more and more researchers tend to use dynamic stability analysis methods. Cossu & Morino (Reference Cossu and Morino2000) utilized a global stability analysis of an elastically supported cylinder at subcritical  $Re$ and proved that the occurrence of vortex shedding is due to the instability of the structural mode. Meliga & Chomaz (Reference Meliga and Chomaz2011) investigated the stability characteristics of the coupled system through an asymptotic expansion method and pointed out the significance of the structural mode (SM). Zhang et al. (Reference Zhang, Li, Ye and Jiang2015) studied a reduced-order model (ROM) via the autoregressive with exogenous input (ARX) technique and divided the frequency lock-in into a ‘resonance-induced’ region and a ‘flutter-induced’ region. Furthermore, Yao & Jaiman (Reference Yao and Jaiman2017) found that there is only a ‘flutter-induced’ region when $Re > 70$. Kou et al. (Reference Kou, Zhang, Liu and Li2017) and Lyu, Kou & Zhang (Reference Lyu, Kou and Zhang2022) obtained the stable van Kármán mode using dynamic mode decomposition (DMD) at subcritical $Re \approx 20$. Such strategies can also provide guidance for flow control (Feng, Wang & Pan Reference Feng, Wang and Pan2011; Noack et al. Reference Noack, Stankiewicz, Morzyński and Schmid2016). These studies generally agree that frequency lock-in is a significant vibration problem caused by the SM instability, but lack strong evidence from experimental perspectives.
1.2. Control of VIV
The control of VIV has been a popular research topic in both academic research and engineering applications. Recent reviews have been provided by Choi, Jeon & Kim (Reference Choi, Jeon and Kim2008), Rashidi, Hayatdavoodi & Esfahani (Reference Rashidi, Hayatdavoodi and Esfahani2016) and Chen et al. (Reference Chen, Huang, Chen, Yu and Gao2022). According to whether external energy input is required, control strategies are usually divided into passive ways and active ways. However, to better understand the ideas of control strategies, we generally divide the research on VIV control into two categories: (i) changing the flow field to reduce or eliminate vortex shedding from the perspective of flow stability; (ii) direct application on the structure to reduce or eliminate the vibration response from the perspective of forced response.
The first strategy, modifying the flow field to control VIV from the perspective of flow stability, is a commonly used method by fluid mechanics researchers. The most direct approach is to modify the surface shape of the structure such as by introducing roughness (Gao et al. Reference Gao, Fu, Wang, Song and Chen2015; Jiang et al. Reference Jiang, Gao, Fu, Chai and Shi2023), grooves (Lim & Lee Reference Lim and Lee2002; Huang Reference Huang2011; Law & Jaiman Reference Law and Jaiman2018), shroundings (Kumar et al. Reference Kumar, Kolahalam, Kantharaj and Manda2018) and so on. However, this approach may have limited effects on VIV control, as it often results in relatively small disturbances to the flow field and insignificant changes to the stability characteristics of the flow. In order to enhance the perturbations to the flow field, additional passive measures have been employed, such as the splitter plate (Pfister & Marquet Reference Pfister and Marquet2020; Cui & Feng Reference Cui and Feng2022; Mittal & Sharma Reference Mittal and Sharma2022), strakes (Sui et al. Reference Sui, Wang, Liang and Tian2016) and tripping wires (Kim et al. Reference Kim, Alam, Sakamoto and Zhou2009; Quadrante & Nishi Reference Quadrante and Nishi2014). Research findings have revealed that under appropriate parameter settings, these methods can effectively suppress vortex shedding and mitigate VIV. Compared with passive control methods, active control techniques such as blowing and suction (Dong, Triantafyllou & Karniadakis Reference Dong, Triantafyllou and Karniadakis2008; Qu et al. Reference Qu, Wang, Sun, Feng, Pan, Gao and He2017) can directly inject energy into the flow field, changing the stability of the wake mode. Furthermore, machine learning methods provide a brand new approach to flow control (Ren, Wang & Tang Reference Ren, Wang and Tang2019; Maceda et al. Reference Maceda, Li, Lusseyran, Morzyński and Noack2021; Li, Li & Noack Reference Li, Li and Noack2022). However, the location of the actuation, the velocity of the blowing or suction and other factors have crucial influences on the control effect. Nevertheless, active strategies are not well received in engineering, considering their cost and complexity.
Regarding the second strategy, the direct control applied to the structure from the perspective of forced response represents a conventional approach. On the one hand, increasing structural damping (Soti et al. Reference Soti, Zhao, Thompson, Sheridan and Bhardwaj2018) or adjusting the structural frequency to avoid the lock-in region is common in practical engineering applications. On the other hand, direct actuation on the structure (Baz & Kim Reference Baz and Kim1993; Zhang et al. Reference Zhang, Fan, Chen and Li2014) can reduce the amplitude of VIV, but the operating condition is typically stringent.
Although controlling flow stability is a valid approach, it might not be required in all technical applications for VIV suppression, nor might it be practical. Meanwhile, controlling VIV from the perspective of forced response makes it challenging to achieve satisfactory results. In essence, the challenge lies in the lack of a comprehensive understanding and control design based on the VIV mechanism.
1.3. Motivation for passive modal control in VIV
Previous studies on the mechanism of VIV emphasize the importance of SM stability for VIV. However, it is difficult to directly extract SM stability in the experiment. To deal with this problem, a passive modal controller (PMC) is used to suppress VIV and a series of analyses on the control mechanism is conducted. The PMC, such as a mass–stiffness–damping device attached to the main system (Frahm Reference Frahm1909), is widely regarded as a relatively simple and effective control method for flow-induced vibration in civil engineering. The traditional PMC control design theory is based on a forced vibration with external excitation of sinusoidal or random signals (Den Hartog Reference Den Hartog1985; Villaverde Reference Villaverde1985; Argenziano et al. Reference Argenziano, Faiella, Carotenuto, Mele and Fraldi2022). The main idea is to use energy transfer and dissipation mechanisms for vibration amplitude reduction. However, this analysis method for flow-induced vibration problems of bluff bodies neglects the FSI effect and has considerable limitations. On the one hand, VIV, which is a finite-amplitude vibration in civil engineering fields, is often treated as a response problem with the aim of reducing the response amplitude. On the other hand, due to the lack of effective analysis methods, the PMC control mechanism of VIV has not been thoroughly studied. In recent years, scholars have recognized that PMC parameters cannot be designed solely from the perspective of mechanical structure response control. Bakis et al. (Reference Bakis, Massaro, Williams and Graham2017) replaced the forced excitation with a Theodorsen aerodynamic model. Dai, Abdelkefi & Wang (Reference Dai, Abdelkefi and Wang2017) introduced a wake oscillator model to design PMC parameters for VIV control of bridge sections. The FSI effect has been considered in these studies, but the semi-empirical model has limitations in regard to revealing the deep physical mechanisms. Tumkur et al. (Reference Tumkur, Pearlstein, Masud, Gendelman, Blanchard, Bergman and Vakakis2017) studied the control effect and response characteristics of a nonlinear energy sink on VIV by numerical simulation techniques. We have primarily analysed the stability characteristics in VIV control with a PMC (Luo, Gao & Zhang Reference Luo, Gao and Zhang2022). However, none of the above studies have conducted experimental verification of the numerical analysis results.
1.4. Contribution and organization
The primary objective of the present study is to investigate and provide answers to the following research questions: (i) How can a PMC (a supplementary subsystem) be used for the purpose of VIV control at the lock-in region? (ii) What is the principle underlying VIV? Is the PMC solely a device used for anti-resonance or energy dissipation in VIV suppression? How do PMC parameters affect the efficacy of control? (iii) What is the primary determinant for VIV suppression? Is the VIV caused by unsteady vortex shedding?
The present work focuses on understanding the mechanisms behind the passive suppression of VIV by the following means: (i) carrying out experiments in a rotating water channel at  $Re = 60$ and $Re = 40$; (ii) examining the vorticity field from time-averaged particle image velocimetry (PIV) data; (iii) examining the vibration response from digital image correlation (DIC) data; (iv) performing linear stability analysis based on a FSI ROM; (v) conducting DMD of the vorticity field from PIV data.
This article is organized as follows. Section 2 describes the problem set-up and the methodology, including the experimental set-up and the ROM establishment. Section 3 presents the results of the experiments, stability analysis and DMD. Section 4 shows the parametric studies of the effect of PMC parameters on VIV suppression. Discussion and conclusions are presented in § 5 and the final section.
2. Problem set-up and methodology
This section describes the problem set-up and the methodology used in this study. The schematic of a transversely vibrating cylinder with a PMC is sketched in figure 1. The equations of motion can be written as
 \begin{equation} \left.\begin{array}{l@{}} m_{y} \ddot{y}+c_{d}(\dot{y}-\dot{z})+k_{y} y+k_{d}(y-z)=L \\ m_{d} \ddot{z}+c_{d}(-\dot{y}+\dot{z})+k_{d}({-}y+z)=0 \end{array}\right\} , \end{equation}
Figure 1. Schematic of a one-degree-of-freedom transversely vibrating cylinder with a PMC.
where m is the actual mass, c is dimensional damping and k is the stiffness. The above equations can be written in the dimensionless form
 \begin{equation} \left.\begin{array}{l@{}} Y^{\prime \prime}+\varepsilon \cdot 4 {\rm \pi}\lambda_{d} F_{d}(Y^{\prime}-Z^{\prime})+(2 {\rm \pi}F_{y})^{2}Y+(2 {\rm \pi}F_{d})^{2}(Y-Z)=2 C_{l} /({\rm \pi} m_{y}^{*}) \\ Z^{\prime \prime}+4 {\rm \pi}\lambda_{d} F_{d}({-}Y^{\prime}+Z^{\prime})+(2 {\rm \pi}F_{d})^{2}({-}Y+Z)=0 \end{array}\right\} , \end{equation}
 where  $Y$ and $Z$ denote the transverse displacements of the cylinder and PMC, respectively. We define the reduced natural frequency as $F = f{D}/U$, where f denotes the natural frequency, so that $F_{y} = f_{y}D/U$ and $F_{d} = f_{d}D/U$. The mass ratio of the cylinder can be defined as $m_{y}^{*}=4 m_{y} /({\rm \pi} \rho D^{2})$, where $m_{y}$ is the actual mass of the oscillator and $\rho$ is the density of the fluid. Furthermore, the dimensionless damping of the PMC is denoted by $\lambda _{d} = c_{d} /(4 {\rm \pi}m_{d} f_{d})$. We also introduce the mass ratio $\varepsilon$ and frequency ratio $\varOmega$ of the PMC to the cylinder, defined as $\varepsilon = m_{d}/m_{y}$ and $\varOmega = F_{d}/F_{y}$, respectively. The hydrodynamic coefficient is determined by $C_{l} = 2L/(\rho UD^{2})$, where $L$ signifies the $Y$-component of the hydrodynamic force acting on the cylinder, $U$ represents the free-stream velocity and $D$ is the diameter of the cylinder. Notably, we define $U^{*} = 1/F_{y}$. For more detailed definitions and information, please refer to the Appendix.
Thus, the generalized structural model is as follows:
 \begin{equation} \boldsymbol{M} \boldsymbol{\zeta}^{\prime \prime}+\boldsymbol{G} \boldsymbol{\zeta}^{\prime}+\boldsymbol{K} \boldsymbol{\zeta}=\boldsymbol{Q}, \end{equation}
where
 \begin{equation} \left.\begin{array}{c} \boldsymbol{\zeta}=\left[\begin{array}{l} Y \\ Z \end{array}\right], \quad \boldsymbol{M}=\left[\begin{array}{ll} 1 & 0 \\ 0 & 1 \end{array}\right], \quad \boldsymbol{G}=\left[\begin{array}{cc} \varepsilon \cdot 4 {\rm \pi}\lambda_d F_d & -\varepsilon \cdot 4 {\rm \pi}\lambda_d F_d \\ -4 {\rm \pi}\lambda_d F_d & 4 {\rm \pi}\lambda_d F_d \end{array}\right] \\ \boldsymbol{K}=\left[\begin{array}{cc} (2 {\rm \pi}F_y)^2+\varepsilon(2 {\rm \pi}F_d)^2 & -\varepsilon(2 {\rm \pi}F_d)^2 \\ -(2 {\rm \pi}F_d)^2 & (2 {\rm \pi}F_d)^2 \end{array}\right], \quad \boldsymbol{Q}=\left[\begin{array}{c} 2 C_l / {\rm \pi}m_y^* \\ 0 \end{array}\right] \end{array}\right\} . \end{equation}
2.1. Experimental set-up
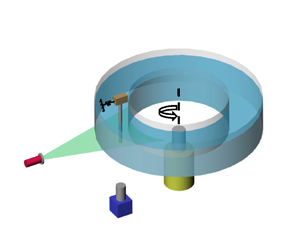
To achieve a very low but stable flow, a rotating channel is designed by referring to the rotating tank in geophysical studies (Griffiths & Hopfinger Reference Griffiths and Hopfinger1986; Afanasyev & Peltier Reference Afanasyev and Peltier1998). As shown in figure 2(a), the rotating channel mainly consists of two concentric cylinders with diameters of 500 mm and 380 mm. The channel is driven by a stepper motor which allows the channel to rotate in an angular speed range of 0–0.306 rad s $^{-1}$. To eliminate the effect of temperature on the viscosity coefficient, the temperature of the environment and the water is strictly controlled at $18 \pm 0.1\,^\circ$C. PIV is utilized to quantify the speed distribution of the flow field in the rotating channel at a rotational speed of $N = 0.102$ rad s $^{-1}$.

Figure 2. Sketch of (a) the rotating water channel and measurement techniques and (b) the experimental model of the cylinder with a PMC.
A continuous laser provides an illumination plane with a thickness of approximately 1 mm at a distance of 45 mm from the bottom of the water tank. A high-speed camera (Pointgrey GS3-U3-23S6M-C) with  $1920 \times 1200$ image resolution is used to capture the particle images. In total, 2000 snapshots were captured at a sample rate of 100 Hz for each single test case. The post-processing to acquire the velocity fields is conducted with an open-source package, PIVlab v2.3.1 (Thielicke & Sonntag Reference Thielicke and Sonntag2021). Meanwhile, the displacements of the cylinder were revolved with the DIC method by tracking the reflected light on the cylinder surface.
Figure 2(b) depicts a schematic diagram of the experimental model set-up. The model in the experiment is an aluminium cylinder with a diameter of  $D = 2$ mm and a length of $l = 100$ mm. The top of the cylinder is firmly held by a wooden block. The two sides of the wooden block are connected to the fixed base with polyvinyl chloride (PVC) strips to provide elastic support. A rectangular magnet block is the lumped mass of the PMC. The stiffness of the PMC is provided by a PVC strip. The relative motion between the magnet and the aluminium sheet adhered to the light wooden board can generate eddy currents, providing damping. The frequency of the model and PMC can be changed by adjusting the length of the PVC strip. The damping of the PMC can be changed by adjusting the relative distance between the magnet block and the aluminium sheet. It is noted that, in this study, PMC closure refers to the fixed connection between the PMC and the cylinder, while opening means the release of PMC degrees of freedom.
Figure 3(a) depicts the instantaneous speed distribution of the horizontal cross-section of the channel, and the flow speed is rather uniform. Figure 3(b) shows that the turbulence intensity distribution  $I_{\infty }$ is less than 1 % in the centre of the channel. To evaluate the effect of rotation, the Rossby number, defined as $Ros = U/2ND$, is introduced. When $Ros > 1$, the effect of rotation on the flow is negligible (Boyer & Kmetz Reference Boyer and Kmetz1983; Pham et al. Reference Pham, Plourde, Kim and Balachandar2006). In this research, $Ros = 55$, which is substantially larger than 1. Thus, the effect of rotation on the flow can be neglected. Considering the effect of the wake on vortex shedding, the diameter of the cylinder used in the experiment is rather small ( $D = 2$ mm), so the wake can be dissipated completely after the channel rotates half a circle. The PIV measurement approximately 10 $D$ upstream of the model shows that the incoming flow meets the uniformity condition, so the influence of the wake can be ignored. Lyu et al. (Reference Lyu, Kou and Zhang2022) has conducted a series of tests at different $Re$, and the Strouhal number is in good agreement with previous experiments and numerical simulations.

Figure 3. Distribution of (a) flow velocity and (b) turbulence intensity in the cross-section of the rotating channel at a rotational speed of  $N = 0.102$ rad s $^{-1}$.
Figure 4 shows the maximum transverse displacement and the dimensionless response frequency  $F^{*}$ (defined as $F^{*} = F_{v} / F_{y}$) varying with the reduced natural frequency of the cylinder in the experiment and computational fluid dynamics/computational structural dynamics (CFD/CSD) simulation for $Re = 60$. The details of the simulation are discussed in Zhang et al. (Reference Zhang, Li, Ye and Jiang2015) and Luo et al. (Reference Luo, Gao and Zhang2022). Because of the structural damping in the experiment, the vibration amplitude is smaller than that in the CFD/CSD simulation. However, the frequency lock-in is well captured in the experiment, as well as the onset of the frequency lock-in.

Figure 4. (a) The maximum transverse displacement  $Y^{max}$ and (b) the response frequency $F$ varying with the reduced natural frequency of the cylinder $F_{y}$ in the experiment and CFD/CSD simulation for $Re = 60$.
2.2. The ARX-based ROM
In this article, an identification technique via the ARX model is employed to construct the reduced-order unsteady aerodynamic model at  $Re = 60$ and $Re = 40$. The work of Cowan, Arena & Gupta (Reference Cowan, Arena and Gupta2001) was one of the earliest to use such a model for unsteady aerodynamic modelling. Thereafter, extensive studies on analysing and explaining the mechanisms of different aeroelastic and flow-induced vibration problems have been conducted by Zhang and his coworkers (Gao & Zhang Reference Gao and Zhang2020; Kou & Zhang Reference Kou and Zhang2021).
The compressible Navier–Stokes equations were utilized to simulate the two-dimensional laminar flow past a circular cylinder at  $Re = 40$ and $Re = 60$. The ROM is trained based on the unstable steady-state base flow, which is computed by a time-filtering method. More details have been demonstrated in our prior work (Zhang et al. Reference Zhang, Li, Ye and Jiang2015; Luo et al. Reference Luo, Gao and Zhang2022).
The ARX model provides a general description of linear dynamic systems in the discrete-time domain, which are governed by linear differential equations. The model formulation is as follows:
 \begin{equation} \boldsymbol{f}(k)=\sum_{i=1}^{n a} \boldsymbol{A}_{i} \,\boldsymbol{f}(k-i)+\sum_{i=0}^{n b-1} \boldsymbol{B}_{i} \boldsymbol{u}(k-i)+\boldsymbol{e}(k), \end{equation}
where  $\boldsymbol {f}$ is the output vector of the system and $\boldsymbol {u}$ is the input vector, $\boldsymbol {A}_{i}$ and $\boldsymbol {B}_{i}$ are constant coefficients to be estimated, and na and nb are the delay orders determined by the user. For the current single-input–single-output model, $\boldsymbol {u}=[Y]$ (transverse displacement of the cylinder) and $\boldsymbol {f}= [C_{l}]$ (hydrodynamic coefficient).
To couple the structural equations, the discrete-time state-space form is converted into the continuous-time form. The model in the continuous-time state-space form is constructed as follows:
 \begin{equation} \left.\begin{array}{c@{}} \dot{\boldsymbol{x}}_{a}(t)=\boldsymbol{A}_{a} \boldsymbol{x}_{a}(t)+\boldsymbol{B}_{a} \boldsymbol{u}(t) \\ \boldsymbol{f}_{a}(t)=\boldsymbol{C}_{a} \boldsymbol{x}_{a}(t)+\boldsymbol{D}_{a} \boldsymbol{u}(t) \end{array}\right\} . \end{equation}
The structural equations in state-space form and the output equations can be expressed as follows:
 \begin{equation} \left.\begin{array}{c@{}} \dot{\boldsymbol{x}}_{s}(t)=\boldsymbol{A}_{s} \boldsymbol{x}_{s}(t)+q \boldsymbol{B}_{s}\,\boldsymbol{f}_{a}(t) \\ \boldsymbol{u}(t)=\boldsymbol{C}_{s} \boldsymbol{x}_{s}(t)+q \boldsymbol{D}_{s} \,\boldsymbol{f}_{a}(t) \end{array}\right\} . \end{equation}
Coupling the structural state equation (2.7) and the aerodynamic state equation (2.6), the state equations for the aeroelastic system can be obtained, which are
 \begin{equation} \left\{\begin{array}{@{}c@{}}
\dot{\boldsymbol{x}}_{s}(t) \\ \dot{\boldsymbol{x}}_{a}(t)
\end{array}\right\}=\boldsymbol{A_{FS}}\cdot\left\{\begin{array}{c}
\boldsymbol{x}_{s}(t) \\ \boldsymbol{x}_{a}(t)
\end{array}\right\}=\left[\begin{array}{@{}cc@{}}
\boldsymbol{A}_{s}+q \cdot \boldsymbol{B}_{s}
\boldsymbol{D}_{a} \boldsymbol{C}_{s} & q \cdot
\boldsymbol{B}_{s} \boldsymbol{C}_{a} \\ \boldsymbol{B}_{a}
\boldsymbol{C}_{s} & \boldsymbol{A}_{a} \end{array}\right]
\cdot\left\{\begin{array}{@{}c@{}} \boldsymbol{x}_{s}(t) \\
\boldsymbol{x}_{a}(t) \end{array}\right\},
\end{equation}
\begin{equation} \left\{\begin{array}{@{}c@{}}
\dot{\boldsymbol{x}}_{s}(t) \\ \dot{\boldsymbol{x}}_{a}(t)
\end{array}\right\}=\boldsymbol{A_{FS}}\cdot\left\{\begin{array}{c}
\boldsymbol{x}_{s}(t) \\ \boldsymbol{x}_{a}(t)
\end{array}\right\}=\left[\begin{array}{@{}cc@{}}
\boldsymbol{A}_{s}+q \cdot \boldsymbol{B}_{s}
\boldsymbol{D}_{a} \boldsymbol{C}_{s} & q \cdot
\boldsymbol{B}_{s} \boldsymbol{C}_{a} \\ \boldsymbol{B}_{a}
\boldsymbol{C}_{s} & \boldsymbol{A}_{a} \end{array}\right]
\cdot\left\{\begin{array}{@{}c@{}} \boldsymbol{x}_{s}(t) \\
\boldsymbol{x}_{a}(t) \end{array}\right\},
\end{equation}
where  $\boldsymbol {B}_{s} = \boldsymbol {B}_{s1} \boldsymbol {B}_{s2}$ and $q = 2/({\rm \pi} m_{y}^{*})$. The subscript a denotes the aerodynamic force and subscript s denotes the structure. The matrices are
 \begin{equation}
\boldsymbol{A}_{s}=\left[\begin{array}{@{}cc@{}} \boldsymbol{O} &
\boldsymbol{I} \\ -\boldsymbol{M}^{{-}1} \boldsymbol{K} &
-\boldsymbol{M}^{{-}1} \boldsymbol{G} \end{array}\right],
\quad \boldsymbol{B}_{s 1}=\left[\begin{array}{@{}c@{}}
\boldsymbol{O} \\ \boldsymbol{M}^{{-}1} \end{array}\right],
\quad \boldsymbol{B}_{s 2}=\left[\begin{array}{@{}l@{}}
\boldsymbol{I} \\ \boldsymbol{O} \end{array}\right], \quad
\boldsymbol{C}_{s}=\left[\begin{array}{@{}ll@{}} \boldsymbol{I} &
\boldsymbol{O}
\end{array}\right],
\end{equation}
\begin{equation}
\boldsymbol{A}_{s}=\left[\begin{array}{@{}cc@{}} \boldsymbol{O} &
\boldsymbol{I} \\ -\boldsymbol{M}^{{-}1} \boldsymbol{K} &
-\boldsymbol{M}^{{-}1} \boldsymbol{G} \end{array}\right],
\quad \boldsymbol{B}_{s 1}=\left[\begin{array}{@{}c@{}}
\boldsymbol{O} \\ \boldsymbol{M}^{{-}1} \end{array}\right],
\quad \boldsymbol{B}_{s 2}=\left[\begin{array}{@{}l@{}}
\boldsymbol{I} \\ \boldsymbol{O} \end{array}\right], \quad
\boldsymbol{C}_{s}=\left[\begin{array}{@{}ll@{}} \boldsymbol{I} &
\boldsymbol{O}
\end{array}\right],
\end{equation}
where  $\boldsymbol {I}$ and $\boldsymbol {O}$ represent the identity matrix and zeros matrix, respectively.
Thus, an analysis model for FSI based on ROM, as represented in (2.8), is conducted. The FSI stability problem is converted into solving for and analysing the eigenvalues of  $\boldsymbol {A_{FS}}$. The real part of the eigenvalue represents the growth rate of the eigenmode, whereas the imaginary part corresponds to the circular frequency, which is equal to 2 ${\rm \pi}$ times the eigenfrequency of the eigenmode. For the given Reynolds number and mass ratio, the natural frequency of the cylinder or the PMC is changed to obtain the root loci of the coupled system. On this basis, the effects of different PMC parameters such as the frequency, damping and mass ratio on the stability of the coupled system can be studied, as well as the coupling among various modes after the introduction of the control mode (CM).
In this study, a chirp signal with a broadband reduced frequency of  $[0.04,0.20]$ is used as the training signal. We consider the aerodynamic modelling with delay orders $na = nb = 120$ at $Re = 60$ and $Re = 40$. The identified results are compared with those of direct numerical simulations in figure 5; good agreement is observed between the two sets of results. The modelling error is less than $1\,\%$. Therefore, it can be concluded that the identification method based on the ARX model has high numerical accuracy. Figure 6 shows the eigenvalues of the coupled system varying with the reduced natural frequency of the cylinder ( $F_{y}$) for $Re = 60$ and $Re = 40$. Two neutral modes of interest exist, namely the ‘nearly structural mode’ (referred to here as the SM) and the ‘von Kármán mode’ (referred to here as the wake mode, WM). The critical Reynolds number of a rigid cylinder is $Re_{cr} \approx 47$. Therefore, the WM is absolutely unstable for $Re = 60$ while it is stable at $Re = 40$. Meanwhile, the SM becomes unstable at certain frequencies because of the interaction with the WM. The instability of the SM plays an important role in the frequency lock-in of VIV.

Figure 5. Identified results under the training signal compared with those of direct numerical simulations for (a)  $Re = 60$ and (b) $Re = 40$.

Figure 6. Root loci of the coupled system without control for (a)  $Re = 60$ and (b) $Re = 40$.
3. Mechanism of lock-in elimination with a PMC
This section reports the results obtained from experiments on VIV suppression with a PMC for  $Re = 60$ and $Re = 40$. The mechanism of lock-in elimination is analysed through linear stability analysis based on the FSI ROM.
3.1. Supercritical case:  $Re = 60$

Figure 7 shows the maximum transverse displacement  $Y^{max}$ and the vibration frequency of the cylinder with and without PMC control for $Re = 60\ {\rm and}\ m_{y}^{*} = 21$. Here, the PMC mass ratio is $\varepsilon = 5.35\,\%$, the damping coefficient is $\lambda _{d} = 5\,\%$ and the frequency is $F_{d} = 0.14$. As seen in figure 7(a), the cylinder undergoes large-amplitude vibration at $0.1 < F_{y} < 0.18$. The maximum displacement reaches approximately $0.5D$. After PMC control, the vibration amplitude of the cylinder can be reduced by two orders of magnitude. Meanwhile, figure 7(b) depicts the lock-in phenomenon for the plain cylinder. Notably, the lock-in phenomenon has been eliminated after the introduction of the PMC. The response frequency is consistent with the frequency of unsteady vortex shedding. Figure 8 shows the comparisons of time responses and power spectral density (PSD) results for the plain cylinder and the cylinder attached to a PMC at $F_{y} = 0.169$. The small oscillation caused by vortex shedding after control is negligible. The PSD analysis shows that the response frequency has shifted before and after control.

Figure 7. (a) The maximum transverse displacement  $Y^{max}$ and (b) the response frequency varying with the reduced natural frequency of the cylinder with and without PMC control for $Re = 60 \text{ and } m_{y}^{*} = 21$. The PMC parameters are as follows: mass ratio $\varepsilon = 5.35\,\%$, damping $\lambda _{d} = 5\,\%$ and frequency $F_{d} = 0.14$.

Figure 8. Comparisons of time responses and PSD results for (a,c) the plain cylinder ( $F_{y} = 0.169$) and (b,d) the cylinder attached to a PMC, where $f = 2.56$ Hz corresponds to the reduced frequency $F = 0.165$ and $f = 2.1$ Hz corresponds to the reduced frequency $F = 0.135$.
The linear stability analysis of VIV control for  $Re = 60$ is performed based on the FSI ROM. The PMC parameters are consistent with experimental values where $m_{y}^{*} = 21, \varepsilon = 5\,\%, \lambda _{d} = 5\,\%$ and $F_{d} = 0.14$. Particularly, the structural damping coefficient is assigned a zero value. Figure 9 shows the root loci of the controlled system varying with the reduced natural frequency $F_{y}$, as well as the real and imaginary parts of the root loci. From figure 9(a), it can be seen that the root loci of the WM are still unstable, while the SM is stable at low or high reduced natural frequency conditions under which the interaction between the SM and WM is weak. However, compared with figure 6(a), the root loci of the SM become stable as the reduced natural frequency of the cylinder approaches the PMC frequency. Although the FSI effect is strong at these frequencies, the SM is not tightly coupled with the WM but with the CM. That is the reason PMC can eliminate the frequency lock-in and suppress VIV. The experimental results also indicate that when the SM becomes stable, the frequency lock-in will exit and the large-amplitude vibration will be significantly suppressed. However, it is also observed in the experiment that after introducing PMC control, although frequency lock-in has been eliminated, there are still weak periodic oscillations. From the PSD results, it is found that the vibration frequency is consistent with the vortex shedding frequency. The results of the linear stability analysis also prove that the unstable WM does not change due to the introduction of the PMC. The final weak periodic oscillation is a kind of forced vibration caused by the unsteady vortex shedding. Next, the above viewpoint will be further validated by analysing the flow field snapshots captured in the experiment with the DMD method.

Figure 9. Root loci of the controlled system for  $Re = 60$: (a) root loci versus reduced natural frequency $F_{y}$; (b) real and (c) imaginary parts of the root loci.
For a detailed study of frequency lock-in elimination mechanisms with a PMC, figure 10 depicts the vorticity of the flow field and the dominant mode obtained by DMD in three scenarios (elastic cylinder with frequency  $F_{y} = 0.169$ with and without control, and stationary cylinder). Figure 10(a ${-}$c) shows the comparison of the vorticity fields in the three scenarios. The 2S mode (two single vortices formed per cycle) is observed for the elastic cylinder with PMC control and the stationary cylinder, whereas the C(2S) mode is observed for the elastic cylinder without control. The C(2S) mode is very similar to the 2S mode except that the vortices coalesce in the far wake, which is typical evidence of the flutter response (Williamson Reference Williamson1988; Singh & Mittal Reference Singh and Mittal2005; Zhang et al. Reference Zhang, Li, Ye and Jiang2015). In the case of $F_{y} = 0.169$, the wake begins to coalesce from the fifth to the sixth vortices (figure 10a). Figure 10(d ${-}$f) illustrates the dominant mode of flow around the cylinder for the three conditions. It can be seen that the dominant mode for the cylinder without control is the VIV mode. The frequency obtained by DMD is $F_{DMD} = 0.163$, which indicates that the SM is unstable. Meanwhile, the dominant mode for the stationary cylinder and the cylinder with PMC control is the von Kármán mode. The frequency of the dominant mode for the stationary cylinder is $F_{DMD} = 0.132$, whereas the frequency of the dominant mode for the cylinder with PMC control is $F_{DMD} = 0.133$. This means that the stability of the SM is typically improved after PMC control, so the vibration has been greatly suppressed and the frequency lock-in has been eliminated. The results provide evidence that the stability of the SM is the key to VIV control.

Figure 10. The vorticity of the flow field and the dominant mode obtained by DMD at  $Re = 60$ for (a,d) the elastic cylinder without control, (b,e) the elastic cylinder with PMC control and (c,f) the stationary cylinder.
3.2. Subcritical case: $Re = 40$

To further explore the role of the SM in the VIV of a cylinder, an experiment is conducted at a subcritical Reynolds number,  $Re = 40$. A reduced natural frequency of the cylinder ( $F_{y} = 0.149$) with a larger amplitude in the lock-in region is selected to compare the phenomenon before and after PMC control. Owing to the impact on engineering structures, VIV and associated control strategies have been the subject of a number of studies at higher $Re$, as reviewed, for example, by Williamson & Govardhan (Reference Williamson and Govardhan2004), Choi et al. (Reference Choi, Jeon and Kim2008) and Chen et al. (Reference Chen, Huang, Chen, Yu and Gao2022). In recent years, Boersma et al. (Reference Boersma, Zhao, Rothstein and Modarres-Sadeghi2021) presented experimental evidence of VIV at subcritical $Re$. There are no experimental reports of VIV control at subcritical $Re$ to our knowledge. The study of VIV control at subcritical $Re$ can further enhance our understanding of the mechanism of frequency lock-in and PMC control.
Figure 11(a) shows the vorticity of the flow field around the elastic cylinder at  $Re = 40$ for $F_{y} = 0.149$. Modal analysis of the flow around the cylinder is performed via DMD. Figure 11(b) illustrates the dominant mode, which represents the VIV mode. The dominant frequency of the flow is $F_{DMD} = 0.145$ and it is similar to the reduced natural frequency of the cylinder, indicating that the SM is unstable. Meanwhile, figure 12 depicts the comparisons of time responses and PSD results at $Re = 40$ for the elastic cylinder with and without control. The black dashed line represents the displacement of the uncontrolled cylinder with a dimensionless amplitude close to $0.5D$. Through PSD analysis, it can be obtained that the vibration response frequency of the uncontrolled cylinder is 1.52 Hz (figure 12b), corresponding to the reduced frequency $F=0.145$. The result is consistent with the dominant frequency obtained from DMD. The solid red line represents the response after PMC control, and it can be seen that the vibration has almost been completely suppressed. Figure 13 illustrates the vorticity of the flow field at $Re = 40$ for the controlled cylinder and the stationary cylinder. It can be seen from figures 12(a) and 13(a) that after applying PMC control, the vibration of the cylinder has been eliminated and there is no vortex shedding. The vorticity of the flow field for the controlled cylinder is the same as that for the stationary cylinder, indicating that the unstable SM has been successfully suppressed. It is noted that the frequency lock-in at subcritical $Re$ no longer exists when the SM becomes stable. Therefore, the experimental results verify that the instability of the SM is the key factor for the frequency lock-in in VIV.

Figure 11. (a) The vorticity of the flow field and (b) the dominant mode obtained by DMD at  $Re = 40$ for the elastic cylinder without control.

Figure 12. Comparisons of (a) time responses and (b) PSD results at  $Re = 40$ for the elastic cylinder with and without control.

Figure 13. The vorticity of the flow field at  $Re = 40$ for (a) the controlled cylinder and (b) the stationary cylinder.
Moreover, linear stability analyses on the uncontrolled and controlled coupled systems at  $Re = 40$ are performed based on the FSI ROM. Figure 14 shows the root loci and the real parts of the root loci for the uncontrolled system (figure 14a,b) and the controlled system with PMC (figure 14c,d). The PMC parameters are set to $\varepsilon = 5\,\%, \lambda _{d} = 5\,\%$ and $\varOmega = 0.9$. It can be seen that the WM is absolutely stable at $Re = 40$. As the reduced natural frequency of the cylinder approaches the WM, the FSI effect becomes strong. Finally, the SM becomes unstable at certain natural frequencies ( $0.102 < F_{y} < 0.159$). This is also the fundamental cause of subcritical VIV (Kou et al. Reference Kou, Zhang, Liu and Li2017; Li, Zhang & Gao Reference Li, Zhang and Gao2018). As shown in figure 14(a,b), the root loci of the coupled system undergo significant changes due to the application of the PMC. The instability range of the SM has been narrowed from the uncontrolled $0.102 < F_{y} < 0.159$ to $0.1 < F_{y} < 0.122$. Thus, the SM becomes stable for $F_{y} = 0.149$, and that is why the vibration has been eliminated. It is noted that the WM is stable at $Re = 40$ so there is no unsteady vortex shedding after control, which is also observed in the experiment (figure 13a). The results of the experiments and linear stability analysis indicate that the VIV phenomenon at subcritical Reynolds numbers is a SM instability problem caused by the coupling of the SM and the stable WM. By introducing a dynamic subsystem to adjust the SM to stability, the vibration is eliminated and there is no vortex shedding anymore.

Figure 14. The root loci and their corresponding real parts at  $Re = 40$ for (a,b) the uncontrolled system and (c,d) the controlled system with PMC.
4. Effects of PMC parameters on VIV control
This section studies the effects of PMC parameters on VIV control at  $Re = 60$.
4.1. The effect of PMC frequency
The PMC frequency plays an essential role in determining the performance of VIV suppression. Figure 15 displays the maximum vibration amplitude varying with the reduced natural frequency of the PMC at  $Re = 60$ for $F_{y} = 0.163$. The PMC mass ratio is set to $\varepsilon = 5.35\,\%$ and the damping coefficient is $\lambda _{d} = 5\,\%$. The long dashed line in figure 15 represents the vibration amplitude of the plain cylinder without control for $F_{y} = 0.163$. Compared with the uncontrolled cylinder, the vibration amplitude of the controlled cylinder with the PMC has decreased in general. Even in the scenario where the frequency lock-in is not eliminated, the amplitude has decreased by approximately 25 %. However, this is different from the traditional civil engineering perspective, which considers the optimal frequency of PMC to be consistent with the natural frequency of the structure. The experimental results indicate that the frequency range in which the PMC can effectively eliminate lock-in is mainly below the structural frequency, and the range is wide. Our previous work has provided an explanation for why the optimal frequency does not occur at the structural natural frequency by considering the coupling between the SM and WM. Furthermore, the modal analysis method is adopted here to validate the explanation.

Figure 15. The maximum vibration amplitude varying with the reduced natural frequency of the PMC at  $Re = 60$ for $F_{y} = 0.163$.
Figure 16 depicts the root loci and the real parts of the root loci of the controlled system at  $Re = 60$. The mass ratio and damping coefficient of the PMC are both set to 5 %. Figure 16(a,b) shows the frequency ratio of the PMC to the cylinder for $\varOmega = 0.6$. The real part of the SM can be observed to cross the imaginary axis at $F_{y}=0.163$, transitioning from unstable to stable by becoming negative. Meanwhile, figure 16(c,d) demonstrates that for $\varOmega =1.1$, the real part of the SM switches from unstable to stable at $F_{y} = 0.163$. To more clearly demonstrate the change in structural modal stability with PMC frequency, $F_{y}$ is kept at 0.163 during the linear stability analysis and the PMC frequency is varied to obtain the root loci and eigenvalue real part change curve of the coupled system, as shown in figure 17(a,b). Figure 17(b) indicates that the real part of the eigenvalue of the SM is stable (less than 0) when $\varOmega$ ranges from 0.6 to 1.1 and unstable (greater than 0) when $\varOmega < 0.6$ or $\varOmega > 1.1$. See also the supplementary movies available at https://doi.org/10.1017/jfm.2024.180. The experimental results demonstrate that the effective frequency range of the PMC in this scenario is $0.67 < \varOmega <1.0$ (seen in figure 17c), which is slightly narrower than the frequency range predicted by the linear stability analysis. The reason for this difference may be that the mass ratio and damping coefficient provided in the ROM do not completely match the actual measurements. Nevertheless, the experimental result indicates that it is reasonable and feasible to design VIV control via modal stability analysis.

Figure 16. The root loci and their corresponding real parts of the controlled system varying with the reduced natural frequency of the cylinder at  $Re = 60$ for (a,b) $\varOmega = 0.6$ and (c,d) $\varOmega = 1.1$.

Figure 17. (a) The root loci and (b) the real parts of the root loci of the controlled system varying with the reduced natural frequency of the PMC at  $Re = 60$ for $F_{y} = 0.163$, compared with (c) the maximum amplitude of the controlled cylinder in the experiment.
The range of  $\varOmega = 0.6\unicode{x2013}1.1$ obtained from the linear stability analysis corresponds to the effective frequency range of the PMC under the condition of a single natural frequency of the cylinder at $F_{y} = 0.163$, which can be referred to as ‘local stability’. To obtain the range of $\varOmega$ ensuring that the SM is stable at any natural frequency of the cylinder, further linear stability analysis is performed via the ROM, as shown in figure 18. The real parts of the root loci for the SM will be less than 0 at any natural frequency of the cylinder from $\varOmega = 0.74$ to $\varOmega = 1.08$. This can be referred to as ‘global stability’. Compared with the frequency ratio range required for ‘local stability’, it is noted that the frequency ratio range for achieving ‘global stability’ is more stringent. Therefore, by incorporating the FSI ROM with PMC, appropriate PMC parameters can be determined based on whether the actual problem requires ‘local stability’ at a certain natural frequency of the structure or ‘global stability’ at multiple natural frequencies.

Figure 18. The root loci and their corresponding real parts of the controlled system varying with the reduced natural frequency of the cylinder at  $Re = 60$ for (a,b) $\varOmega = 0.74$ and (c,d) $\varOmega = 1.08$.
4.2. The effect of the PMC damping and mass ratio
The mass ratio and damping of the PMC determine the margin of the improved stability of the SM. Therefore, an experiment is conducted to study the effect of the PMC damping and mass ratio on VIV suppression.
In the experiment, the mass ratio of the PMC is relative to the number of magnet blocks. By adjusting the length of the PVC strips as well as the distance between the magnet and the aluminium sheet, the PMC frequency is fixed at  $F_{d} = 0.14$ for each mass ratio. The PMC damping coefficient is approximately 5 %. Figure 19 shows the transverse responses of the cylinder with different PMC mass ratios measured in the experiment over a period of 1 second, as well as the corresponding amplitudes varying with the PMC mass ratios. The results indicate that, within a certain range, the greater the mass ratio of the PMC, the better the control effect. However, it is observed that the lock-in has not been eliminated for $\varepsilon = 2.67\,\%$, although the response amplitude has been reduced by half.

Figure 19. Time responses of the cylinder at  $Re = 60$ for $F_{y} = 0.163$, as well as the maximum vibration amplitude $Y^{max}$ varying with the PMC mass ratio.
The damping of the PMC is the core parameter that determines whether the PMC can eliminate the frequency lock-in. Six PMC damping coefficients ( $\lambda _{d} = 0.47\,\%, 1.82\,\%, 5.39\,\%, 10.19\,\%, 29.07\,\%$ and $66.84\,\%$) are investigated in the experiment. The PMC damping can be adjusted by changing the distance between the permanent magnet and the aluminium sheet. The PMC free attenuation response is measured by DIC to extract the damping coefficient. Analogously, the tests are conducted at $Re = 60$ for $F_{y} = 0.163$, and the PMC frequency and mass ratio are set to $F_{d} = 0.14$ and $\varepsilon = 5.35\,\%$. Figure 20 demonstrates the transverse responses of the cylinder for different PMC damping coefficients, as well as the maximum vibration amplitude varying with the PMC damping coefficient. The findings reveal that the PMC with a damping coefficient ranging from 5 % to 10 % can yield substantial control benefits, effectively suppressing VIV and eradicating frequency lock-in. However, when the PMC damping coefficient is too small ( $\lambda _{d} = 0.47\,\%, 1.82\,\%$), the amplitude of the cylinder after introducing PMC control is similar to that of an uncontrolled cylinder, indicating that the PMC has almost no effect on VIV control. When the damping coefficient of the PMC increases, or even approaches overdamping, the vibration amplitude of the cylinder decreases but the frequency lock-in is not eliminated. This observation suggests that there is no direct correlation between the dampening of the PMC and the quality of the control effect. Furthermore, it is evident that the elucidation of the control mechanism of the PMC through energy dissipation is hindered.

Figure 20. Time responses of the cylinder at  $Re = 60$ for $F_{y} = 0.163$, as well as the maximum vibration amplitude $Y^{max}$ varying with the PMC damping coefficient.
5. Discussion
There are two misunderstandings in traditional VIV control and PMC design: (i) VIV is caused by vortex shedding or turbulence; (ii) the PMC suppresses VIV by damping dissipation.
Firstly, although the importance of structural mode stability has been recognized, VIV is still primarily treated as a forced response in most engineering applications. Figure 21 shows the transverse vibration amplitude of the cylinder as a function of  $F_{y}$ obtained by FSI simulation and forced response simulation. The vibration amplitude is generally small except at the resonance point in the forced response simulation, which is not consistent with the VIV phenomenon in the experiment. Hence, VIV cannot be treated as a resonance response without the FSI effect. The numerical research on the mechanism of frequency lock-in in VIV mainly focuses on the low-Reynolds-number range. In particular, research on the mechanism of VIV from the perspective of stability based on feature analysis methods mostly concentrates on Reynolds numbers from the tens to the hundreds, and is limited by the extraction of the base flow. Although scholars have gradually recognized that the frequency lock-in in VIV is mainly due to the instability of the SM, there are few reports on VIV experiments and related control studies at such a low Reynolds number. In recent years, Boersma et al. (Reference Boersma, Zhao, Rothstein and Modarres-Sadeghi2021) and Lyu et al. (Reference Lyu, Kou and Zhang2022) utilized the rotating water channel as the experimental platform at low Reynolds number and provided experimental evidence of VIV at subcritical Reynolds numbers. The flow at subcritical Reynolds numbers is stable. It is quite difficult to directly extract SM stability in experiments, so we want to conversely prove that SM instability is the key to frequency lock-in by making the SM stable and causing the lock-in to exit. Therefore, the PMC is carefully designed. As an additional subsystem of the structure, the PMC is not directly coupled with the WM but can improve the SM stability. Besides, at low Reynolds numbers, the linear stability analysis can specifically provide the mechanism of PMC for VIV control. The results obtained by the FSI ROM show good agreement with the experimental observations.

Figure 21. Transverse vibration amplitude of the cylinder as a function of the reduced natural frequency obtained by FSI simulation and forced response simulation.
Meanwhile, the PMC is not just a damping dissipation device in VIV control (Blanchard, Bergman & Vakakis Reference Blanchard, Bergman and Vakakis2020; Chen et al. Reference Chen, Marzocca, Xiao, Zhan and Gu2020). Figure 22(a) depicts the time responses of the cylinder for structural damping coefficient  $\lambda _{y} = 0.04$ and PMC control. The PMC parameters are set to $\varepsilon = 0.1, F_{d} = 0.135 \text{ and } \lambda _{d} = 0.04$. The vibration amplitude is indeed reduced with structural damping, but the vibration frequency is still dominated by the SM, indicating that the SM is still unstable. Compared with directly adding structural damping (figure 22b), the vibration has been effectively suppressed by the PMC and the response frequency after PMC control is consistent with the vortex shedding frequency (figure 22c), which means that lock-in has been eliminated. Han et al. (Reference Han, de Langre, Thompson, Hourigan and Zhao2023) confirmed a phenomenon of VIV forever at any reduced velocity, even with high structural damping. Therefore, it is difficult to suppress VIV with just damping dissipation, let alone in engineering applications.

Figure 22. (a) Time responses and (b,c) PSD results of the cylinder for structural damping  $\lambda _{y} = 0.04$ and PMC control obtained by FSI simulation.
6. Conclusions
For a single-degree-of-freedom transversely vibrating cylinder in cross-flow at  $Re = 60$ and $Re = 40$, this study has demonstrated that the PMC is capable of efficiently suppressing VIV. The experiment is conducted in a rotating water channel. An ROM-based linear stability analysis is performed to reveal the mechanism of lock-in elimination with the PMC. Finally, we investigated the effects of PMC parameters on VIV suppression. The main conclusions are as follows:
(i) The proposed PMC achieves significant VIV control of the cylinder in the lock-in region with a simple structure and minimal mass cost. A rotating water channel is used to provide low-Reynolds-number experimental conditions. The mass ratio, frequency and damping of the PMC are adjustable. The time responses of the cylinder and the flow pattern are obtained by DIC and PIV. For
$Re = 60$, it is found that the vibration amplitude decreases significantly and the frequency lock-in is eliminated after PMC control. For $Re = 40$, the vibration has been suppressed completely and there is no vortex shedding after PMC control.(ii) The PMC couples with the main system to stabilize the unstable SM, thereby suppressing the VIV in the lock-in region. The results of the linear stability analysis indicate that the introduction of a PMC as a dynamic subsystem alters the unstable SM in the original FSI system, resulting in stability through the FSI feedback mechanism when proper PMC parameter settings are applied. In addition, at a cost of increasing the mass by
$5\,\%$, the VIV amplitude is reduced by two orders of magnitude. Meanwhile, the equivalent damping of the PMC is only $1/20$ of the directly applied structural damping, but the vibration amplitude decreases by 10 times.(iii) The effects of the PMC frequency, mass ratio and damping coefficient on VIV suppression are studied in the experiment. The results show that, unlike the traditional perception that the effective frequency ratio of PMC is
$\varOmega \approx 1$, the frequency range in which the PMC can effectively eliminate frequency lock-in at $Re = 60$ is mainly below the structural frequency, closer to the vortex shedding frequency. Although the PMC has the disadvantage of single frequency control, it is indeed a very effective control method for the large-amplitude vibration of VIV in the lock-in region (essentially single-degree-of-freedom flutter).(iv) The experimental results further confirm that the frequency lock-in of VIV is not a nonlinear resonance problem, but rather a single-degree-of-freedom flutter problem caused by SM instability. The results indicate that flow mode stability is not a necessary condition for the control of VIV, but that SM stability is the key factor. This conclusion is similar to that of Bukka, Magee & Jaiman (Reference Bukka, Magee and Jaiman2020).


Based on this study, future research can further explore how to improve SM stability for VIV control and frequency lock-in exit methods so that VIV can be suppressed more efficiently. Meanwhile, this article only discusses the simple configuration of a single-degree-of-freedom PMC with linear stiffness and damping. For a nonlinear energy sink, which is currently a popular research topic, a combination of theoretical and experimental research can also be performed with the above methods and ideas to explore more complex phenomena such as chaos (Tumkur et al. Reference Tumkur, Pearlstein, Masud, Gendelman, Blanchard, Bergman and Vakakis2017).
Supplementary movies
Supplementary movies are available at https://doi.org/10.1017/jfm.2024.180.
Funding
The authors gratefully acknowledge funding from the National Natural Science Foundation of China (grant nos. 11572252 and 11622220).
Declaration of interests
The authors report no conflict of interest.
Appendix


