


1. Introduction
Thermal convection in liquid metal occurs widely in geophysical, astrophysical systems and industrial processes (Lohse & Shishkina Reference Lohse and Shishkina2023), such as the outer core of the Earth (King & Aurnou Reference King and Aurnou2013) and blanket design of nuclear fusion reactors (Salavy et al. Reference Salavy, Boccaccini, Lässer, Meyder, Neuberger, Poitevin, Rampal, Rigal, Zmitko and Aiello2007). The most salient feature of liquid metal is its Prandtl number  $Pr=\nu /\kappa$ being much smaller than unity, resulting in faster diffusion of heat than momentum. Here, $\nu$ and $\kappa$ are the fluid's kinematic viscosity and thermal diffusivity, respectively. To study the various thermal convection phenomena, the Rayleigh–Bénard convection (RBC) system is usually employed (for reviews, see e.g. Ahlers, Grossmann & Lohse Reference Ahlers, Grossmann and Lohse2009; Lohse & Xia Reference Lohse and Xia2010; Chillá & Schumacher Reference Chillá and Schumacher2012; Xia Reference Xia2013). In RBC, a horizontally infinite fluid layer confined between two plates is heated from below and cooled from above. This system is governed by two control parameters, namely, the Rayleigh number $Ra=\alpha g\Delta T H^3/(\nu \kappa )$ and $Pr$, where $\alpha$, $\Delta T$ and $g$ denote the thermal expansion coefficient, the applied temperature difference across the fluid layer and the gravitational acceleration constant, respectively. In addition, the aspect ratio $\varGamma =D/H$ for a given cell geometry is used to characterize the effect of spatial confinement with $H$ and $D$ being the height and diameter for a cylindrical cell. Understanding the heat transport mechanism remains one of the central issues in the study of thermal convection. Much progress has been made regarding heat transport in fluids like water/air with $Pr\sim O(1)$. A great success is the good agreement of the Nusselt number $Nu$ between the prediction of the theory proposed by Grossmann & Lohse (Grossmann & Lohse Reference Grossmann and Lohse2000; Stevens et al. Reference Stevens, van der Poel, Grossmann and Lohse2013) (GL theory) and various experimental and numerical measurements in cells with $\varGamma \sim 1$ (see, e.g. Ahlers et al. Reference Ahlers, Grossmann and Lohse2009, and references therein). Here, the $Nu$ number characterizes the ratio between the heat flux transported by the system to that by thermal conduction alone, which is usually expressed in terms of a power law with $Ra$, i.e. $Nu\sim Ra^{\alpha }$.
As a sidewall is unavoidable in experimental set-ups,  $\varGamma$ for a given cell geometry is also important. Owing to the demand for achieving, as large as possible, the $Ra$ for a given $D$, slender cells with $\varGamma <1$ are usually preferred. For the onset of convection, Shishkina (Reference Shishkina2021) theoretically showed that the critical Rayleigh number for the onset of convection is $Ra_{c,\varGamma }=(2{\rm \pi} )^4(1+1.49/\varGamma ^2)(1+0.34/\varGamma ^2)$, and the heat transport just above the onset of convection is predicted to be $Nu-1\sim (1+1.49/\varGamma ^2)^{-1}Ra$ . Experimental measurements of $Ra_{c,\varGamma }$ have confirmed the above $\varGamma$-dependence of $Ra_c$ (Zhang & Xia Reference Zhang and Xia2023; Ren et al. Reference Ren, Tao, Xia and Xie2024). However, the predicted heat transport relation has yet not been tested. In the turbulent state, studies on the effects of $\varGamma <1$ mainly focus on fluids with $Pr\sim 4.3$. Two-dimensional direct numerical simulation (DNS) shows that small $\varGamma$ has more profound influences on the heat transport in fluids with $Pr=0.7$ when compared with that with $Pr=4.3$ (Van der Poel, Stevens & Lohse Reference Van der Poel, Stevens and Lohse2011). In rectangular cells, it is shown that reducing $\varGamma$ in one direction leads to the condensation of coherent structures and the emergence of an optimal heat transport state (Huang et al. Reference Huang, Kaczorowski, Ni and Xia2013; Xia et al. Reference Xia, Huang, Xie and Zhang2023). In cylindrical cells, the heat transport depends weakly on $\varGamma$ with the maximum difference being $\sim 2\,\%$ for $4\times 10^9 \le Ra \le 10^{11}$ in cells with $1/3\le \varGamma \le 1$ (Xi & Xia Reference Xi and Xia2008; Weiss & Ahlers Reference Weiss and Ahlers2011), despite that the large-scale circulation (LSC) changes from a double-roll-mode (DRM) dominated state to a single-roll-mode (SRM) dominated state when $\varGamma$ changes from 1/3 to 1. The insensitive heat transport to the LSC mode is partially due to the thermal boundary layer (BL) being protected by the viscous BL in fluids with $Pr>1$. Thus, the changes in the LSC mode cannot directly impact the thermal BL that controls the heat transport efficiency.
Compared with the large body of knowledge accumulated on the effects of small  $\varGamma$ in working fluids with $Pr\ge 0.7$, studies on the effects of small $\varGamma$ in liquid metal convection with $Pr\sim 10^{-2}$ remain scarce. Early studies in liquid metal convection mainly focus on the regime with $\varGamma \ge 1$ and found that $Nu \sim Ra^{0.25}$ (Rossby Reference Rossby1969; Takeshita et al. Reference Takeshita, Segawa, Glazier and Sano1996; Cioni, Ciliberto & Sommeria Reference Cioni, Ciliberto and Sommeria1997; Horanyi, Krebs & Müller Reference Horanyi, Krebs and Müller1999; Aurnou & Olson Reference Aurnou and Olson2001; King & Aurnou Reference King and Aurnou2013; Scheel & Schumacher Reference Scheel and Schumacher2016; Zürner et al. Reference Zürner, Schindler, Vogt, Eckert and Schumacher2019; Ren et al. Reference Ren, Tao, Zhang, Ni, Xia and Xie2022). In cells with $\varGamma =1$ and 1/2, it is found that the LSC exhibits different structures depending on the cell geometry and the $Ra$ range. For example, in a $\varGamma =1/2$ cuboid cell for $10^5< Ra<10^7$, the LSC evolves from a twisted LSC state to a LSC state, and the heat transport of the latter is approximately 35 % larger than that of the former when they coexist (Chen et al. Reference Chen, Xie, Yang and Ni2023). The SRM LSC usually observed in cylindrical cells with $\varGamma =1$ are found to collapse in a cell with $\varGamma =1/2$ when $Ra >2\times 10^8$ (Schindler et al. Reference Schindler, Eckert, Zürner, Schumacher and Vogt2022). After a correction to the experimental data first published in Schindler et al. (Reference Schindler, Eckert, Zürner, Schumacher and Vogt2022), the heat transport in the $\varGamma =1/2$ cell is found to be systematically larger (up to 30 %) than that in the $\varGamma =1$ cell (Schindler et al. Reference Schindler, Eckert, Zürner, Schumacher and Vogt2023). For even smaller $Pr$, i.e. liquid sodium with $Pr\sim 0.009$, the heat transport scaling $\alpha$ is found to depend strongly on $\varGamma$, i.e. $\alpha =0.40$ in a $\varGamma =1/5$ cell for $6.50\times 10^8 \le Ra \le 1.25\times 10^9$ (Frick et al. Reference Frick, Khalilov, Kolesnichenko, Mamykin, Pakholkov, Pavlinov and Rogozhkin2015) and $\alpha =0.76$ in a $\varGamma =1/20$ cell for $2.02\times 10^{10} \le Ra \le 4.56\times 10^{10}$ (Mamykin et al. Reference Mamykin, Frick, Khalilov, Kolesnichenko, Pakholkov, Rogozhkin and Vasiliev2015), highlighting the significance of $Pr$ on heat transport in slender cells. Apart from heat transport, it is also found that spatial confinement facilitates the transition to turbulence in liquid metal convection due to the formation of multiple vertically stacked rolls and frequent transitions between them in the small $\varGamma$ regime (Ren et al. Reference Ren, Tao, Xia and Xie2024). The above analysis suggests our understanding of the effects of $\varGamma <1$ on heat transport in liquid metal convection remains incomplete, which motivates the present study.
In this paper, combing experimental measurements and DNS, we will show that just above the onset of convection, in the range of  $1/50\le \varGamma \le 1$, the $Nu$ grows linearly with $Ra$ with $Nu-1=0.018(1+0.34/\varGamma ^2)(Ra/Ra_{c,\varGamma }-1)$. If the flow becomes time-dependent when $Ra$ increases beyond $Ra_{c,\varGamma }$, the slope of the linear growth will decline. Extending the theory by Shishkina (Reference Shishkina2021), we propose a length scale in the turbulent state, i.e. $\ell = H/(1+1.49\varGamma ^{-2})^{1/[3(1-\alpha )]}$. We will show that once this new length scale is employed, the heat transport efficiency in turbulent liquid metal convection with $\alpha =1/4$ in cells with $1/3\le \varGamma \le 1$ will collapse for $Ra_{\ell } \ge 7\times 10^5$.
2. The experimental and numerical set-ups
2.1. The experiments
The experiments were carried out in cylindrical convection cells with the aspect ratio varied in the range of  $1/20\le \varGamma \le 1$ and the $Ra$ in a range of $4\times 10^3\le Ra\le 7\times 10^8$. To achieve such a wide range of $Ra$, three sets of cells with diameter
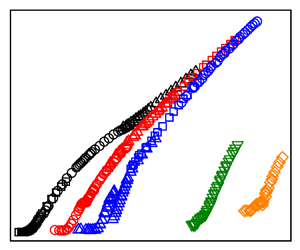
  $D=20.14$ mm, 40.37 mm and 103.91 mm were constructed. They are referred to as sets A, B and C, respectively. Figure 1(a) shows the range of $\varGamma$ and $Ra$ for each set of cells. To vary $\varGamma$ for each set, sidewalls with respective height $H$ corresponding to the designed $\varGamma$ were used. In total 11 convection cells were used. The design and construction of the cells are similar and can be found in Ren et al. (Reference Ren, Tao, Zhang, Ni, Xia and Xie2022). We mention here only their essential features. Each convection cell consists of a top cooling copper plate, a bottom heating copper plate and a Plexiglas sidewall. The surface facing the fluid is coated with a thin layer of nickel. The Plexiglas sidewall was sandwiched between the two copper plates. A fluorine rubber O-ring was employed between the ends of the sidewall and the plates to prevent the leakage of gallium–indium–tin (GaInSn). The bottom plate was heated by a nichrome wire heater, while the top plate was cooled by circulating temperature-controlled water. The temperature boundary condition at the bottom plate is a constant heat flux and that of the top plate is a constant temperature, nominally. The respective temperatures of the top (bottom) plate were measured using four (five) thermistors inserted into blind holes drilled from their sides with a distance of 3 mm from the plate–fluid interface. A digital multimeter was used to measure the resistance of the thermistors, which were then converted to temperatures using calibrated parameters. The sampling rate of the temperature measurement is 0.35 Hz. By measuring the voltage $V$ and current $I$ applied to the heater using a four-wire method, the applied time-averaged heat flux $q=4VI/({\rm \pi} D^2)$ and thus the $Nu=qH/(\chi \Delta T)$ can be obtained. Here $\chi =24.9$ W (mK) $^{-1}$ is the thermal conductivity of GaInSn. The experimental conditions of sets A and B can be found in the appendix of Ren et al. (Reference Ren, Tao, Xia and Xie2024). For the set C cells, $\Delta T$ varies in the range of [0.48, 23.69] K and [0.61, 19.54] K for $\varGamma =1/2$ and 1/3, respectively. For high-precision heat transport measurements, side and bottom temperature-controlled thermal shields were installed. We refer to Ren et al. (Reference Ren, Tao, Zhang, Ni, Xia and Xie2022) for more details on the experimental procedure. The liquid metal alloy GaInSn was used as the working fluid. Its physical properties are documented in Ren et al. (Reference Ren, Tao, Zhang, Ni, Xia and Xie2022). Its $Pr$ was fixed at $Pr=0.029$ with a mean fluid temperature of $35\,^{\circ }{\rm C}$.

Figure 1. The  $\varGamma -Ra$ parameter space for (a) experiments and (b) DNS with $Pr=0.029$.
2.2. Direct numerical simulations
Direct numerical simulations were conducted in a cylindrical domain with  $1/50\le \varGamma \le 1$ and in the Ra range of $3.7\times 10^3\le Ra\le 6.9\times 10^9$. Figure 1(b) shows the range of $\varGamma$ and $Ra$ for DNS. The non-dimensional governing equations with the Oberbeck–Boussinesq approximation, cf. (2.1), were numerically solved using a fourth-order finite-volume method on staggered grids, and the time marching is done using the Euler-leapfrog scheme (Chong, Ding & Xia Reference Chong, Ding and Xia2018),
 \begin{align} \frac{\partial \boldsymbol{u}}{\partial t}+(\boldsymbol{u}\boldsymbol{\cdot}\boldsymbol{\nabla}) \boldsymbol{u}={-}\boldsymbol{\nabla} p+\sqrt{\frac{Pr}{Ra}}\nabla^2 \boldsymbol{u}+T\hat{z}; \quad \frac{\partial T}{\partial t}+(\boldsymbol{u}\boldsymbol{\cdot}\boldsymbol{\nabla}) T=\sqrt{\frac{1}{Ra Pr}}\nabla^2 T;\quad \boldsymbol{\nabla} \boldsymbol{\cdot} \boldsymbol{u} = 0, \end{align}
where  $\boldsymbol {u}$, $T$ and $p$ are, respectively, the dimensionless velocity, temperature and pressure; $\hat {\boldsymbol {e}}_{\boldsymbol {z}}$ is the unit vector in the vertical direction. Equations (2.1) have been made dimensionless using the cell height $H$, the temperature difference across the cell $\Delta T$, the free-fall velocity $u_{ff}=\sqrt {\alpha g \Delta T H}$ and the free-fall time scale $\tau _{ff}=H/u_{ff}$. All boundaries satisfy the no-penetration and no-slip velocity boundary conditions. The top/bottom plates are kept isothermal and the sidewalls are kept adiabatic.
The accuracy of the DNS is verified through the two well-known exact relations in RBC (Ahlers et al. Reference Ahlers, Grossmann and Lohse2009), i.e.  $Nu=Nu_{\epsilon _u}=Nu_{\epsilon _T}$. Here $Nu=1+\sqrt {RaPr}\left \langle u_zT\right \rangle _{V,t}$, $Nu_{\varepsilon _u}=1+\sqrt {RaPr}\left \langle \varepsilon _u\right \rangle _{V,t}$ and $Nu_{\varepsilon _T}=\sqrt {RaPr}\left \langle \varepsilon _T\right \rangle _{V,t}$, where $\left \langle \cdots \right \rangle _{V,t}$ denotes averaging over the entire simulation domain and the statistical time. Here $Nu$,
$Nu$,  $Nu_{\varepsilon _u}$ and $Nu_{\varepsilon _T}$ are the directly calculated Nusselt number, the Nusselt number calculated based on the viscous dissipation rate $\varepsilon _u$ and the thermal dissipation rate $\varepsilon _T$, respectively. For simulations just above the onset of convection, the difference between three $Nu$ values is within $0.1\,\%$, and that of the turbulent state is within $4\,\%$. Each simulation case was started from a state with a linear temperature profile and zero velocity plus a small perturbation. Details of the simulation can be found in the Appendix.
3. Results and discussions
3.1. General features of the heat transport
We first take an overview of the heat transport data. Figure 2(a) plots  $Nu$ as a function of $Ra$ obtained experimentally as open symbols and numerically as solid stars in cells with $1/20\le \varGamma \le 1$. The green solid line marks the theoretical prediction of the GL theory for $\varGamma =1$ (Grossmann & Lohse Reference Grossmann and Lohse2000) with modified prefactors taking into account new measurements at $Pr=0.029$ from Ren et al. (Reference Ren, Tao, Zhang, Ni, Xia and Xie2022). Firstly, it is seen that the experimentally measured $Nu$ and the $Nu$ obtained from DNS in a cell with $\varGamma = 1$ for $Ra = 10^7$ and in a cell with $\varGamma =1/2$ for $Ra = 5\times 10^7$ overlap with each other within $\sim 3\,\%$, suggesting that the finite conductivity effects (Verzicco Reference Verzicco2004) in the studied parameter range is small. One also observes that the agreement between measurements and DNS data near the onset of convection is not good. This point will be discussed in § 3.2. For large enough $Ra$,
$Ra$,  $Nu$ in cells with $1/3\le \varGamma \le 1$ all approach the prediction of the GL theory, suggesting that the system will become $\varGamma$-independent when $Ra$ is larger than a $\varGamma$-dependent critical value. This observation is different from the results reported by Schindler et al. (Reference Schindler, Eckert, Zürner, Schumacher and Vogt2023) within a similar range of $Ra$ and the same $Pr$, where they observe a $\sim 30\,\%$ difference in $Nu$ between measurements in two cylindrical cells with $\varGamma =1$ and 1/2 (see figure 5c).
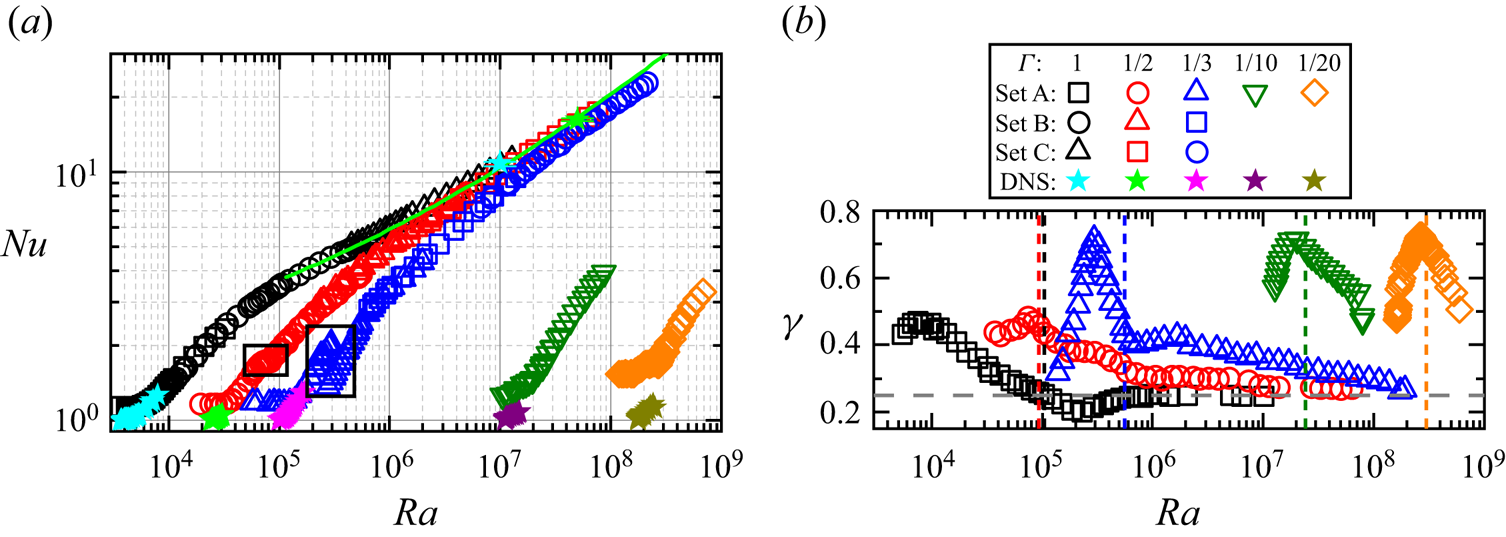
Figure 2. (a) Measured  $Nu$ versus $Ra$ from experiments (open symbols) and DNS (solid symbols) for different $\varGamma$. The green solid line is the prediction of the GL theory with $\varGamma =1$ (Grossmann & Lohse Reference Grossmann and Lohse2000). (b) The local effective heat transport scaling exponent $\gamma$ versus $Ra$. The vertical dashed lines mark the transitional $Ra$ when the system becomes turbulent.
We now study measurements in the  $\varGamma =1$ cells. Figure 2(a) shows that $Nu$ numbers measured in three sets of cells overlap well with each other when there is an overlap in $Ra$. The flow evolves from the conduction state at $Ra\approx 5\times 10^3$ to a turbulent state for $Ra>10^5$. Let us denote the $Nu$ measured experimentally in the conduction state as $a_{\varGamma }$. Note $a_{\varGamma }$ should be 1, independent of $\varGamma$ by definition. However, due to unknown parasitic heat leakage, figure 2(a) shows that $a_{\varGamma }$ is slightly larger than 1 and increases with decreasing $\varGamma$. Before the transition-to-turbulence state, i.e. $Ra$ smaller than the vertical dashed lines, which mark the critical Rayleigh number for the transition-to-turbulence state reported in Ren et al. (Reference Ren, Tao, Zhang, Ni, Xia and Xie2022, Reference Ren, Tao, Xia and Xie2024), the local effective heat transport scaling exponent $\gamma$ of $Nu$ versus $Ra$, i.e. $\gamma = {\rm d}\log Nu/{\rm d}\log Ra$, changes continuously, as shown in figure 2(b). Here $\gamma$ is obtained by fitting the data using a sliding window covering approximately half a decade in $Ra$. In the turbulent state, we observe an $Nu\sim Ra^{0.25}$ scaling, in good agreement with the prediction of $\alpha =1/4$ obtained from the GL theory (Grossmann & Lohse Reference Grossmann and Lohse2000), experimental measurements (Cioni et al. Reference Cioni, Ciliberto and Sommeria1997; Glazier et al. Reference Glazier, Segawa, Naert and Sano1999; Zürner et al. Reference Zürner, Schindler, Vogt, Eckert and Schumacher2019; Ren et al. Reference Ren, Tao, Zhang, Ni, Xia and Xie2022) and numerical simulations (Verzicco & Camussi Reference Verzicco and Camussi1997; Scheel & Schumacher Reference Scheel and Schumacher2016).
In the cells with  $\varGamma =1/2$ and $1/3$, the $Nu$ measured in different sets of cells but the same $\varGamma$ also overlap with each other when there is an overlap in $Ra$. The system starts from the conduction state and evolves into a turbulent state when $Ra$ is larger than the critical values marked by the vertical dashed lines in figure 2(b). Similar to the case with $\varGamma =1$, the local effective heat transport scaling exponent $\gamma$ increases with $Ra$ before the system becomes turbulent, and it decreases with $Ra$ in the turbulent state. For sufficiently large $Ra$,
$Ra$,  $\gamma$ approaches 0.25 as marked with a long-dashed horizontal line in figure 2(b).
In the strongly confined regime with  $\varGamma =1/10$ and $1/20$, the system starts from the conduction state and becomes turbulent very quickly after the onset of convection (Ren et al. Reference Ren, Tao, Xia and Xie2024). The local effective heat transport scaling exponents $\gamma$ show similar behaviour as those in cells with $1/3\le \varGamma \le 1$, i.e. they increase to a maximum value $\gamma _{max}$ and then start to decrease in the turbulent state. In these two cases, we observe $\gamma _{max}=0.75$. We note that a similar observation, i.e. an increased local effective scaling exponent $\gamma$ with decreasing $\varGamma$ was reported in strongly confined rectangular cells with water ( $Pr=4.38$) as the working fluid (Zhang & Xia Reference Zhang and Xia2023). However, the $\gamma$ in water is much larger than in the present study with liquid metal. For example, Zhang & Xia (Reference Zhang and Xia2023) reported $\gamma _{max}=4.30$ and 8.49 from the experiment and DNS in a cell with $\varGamma =1/20$, respectively. The difference may be attributed to the difference in $Pr$ or the cell geometry, highlighting the sensitive dependence of the heat transport on the control parameters and cell geometry in the severely confined RBC. Finally, we note that there are discontinuities in the $Nu\sim Ra$ curve beyond the onset of convection in cells with $\varGamma =1/2$ and 1/3, marked by the two black rectangles in figure 2(a). The reason for the discontinuities will be discussed in § 3.3.
3.2. Length scale in confined turbulent RBC
Shishkina (Reference Shishkina2021) predicts that near the onset of convection, the heat transport is
 \begin{equation} Nu-1=C(1+c_u\varGamma^{{-}2})^{{-}1}Ra \end{equation}
with  $c_u=1.49$ and $C$ being a undetermined prefactor. Thus, the relevant length scale near the onset of convection is $\ell =H/(1+c_u\varGamma ^{-2})^{1/3}$. Assuming there is a power law relation between $Nu$ and $Ra$, i.e. $Nu-1 \sim Ra^{\alpha }$, following Shishkina (Reference Shishkina2021), let us define a function $f\equiv (Nu-1)Ra^{-\alpha }$. Then (3.1) transforms into
 \begin{equation} f \equiv (Nu-1)Ra^{-\alpha} \sim \left [\frac{Ra}{(1+c_u\varGamma^{{-}2})^{1/(1-\alpha)}}\right ]^{1-\alpha}. \end{equation}
In the classical turbulent regime, the heat transport scaling  $Nu-1 \sim Ra^{\alpha }$ holds with the scaling exponent $\alpha$ depending on the flow regime (Grossmann & Lohse Reference Grossmann and Lohse2000) but weakly depend on $\varGamma$. Following Shishkina (Reference Shishkina2021), we further assume that the expression inside the square bracket of (3.2) near the onset of convection also holds in the classical turbulent regime and denote it as $Ra_{\ell }$. We then obtain a $\alpha$-dependent length scale $\ell = H/[(1+c_u\varGamma ^{-2})^{1/[3(1-\alpha )]}]$. For turbulent liquid metal convection, our measurements in cells with $1/3\le \varGamma \le 1$ (see figure 2b) and previous studies in cells with $\varGamma =1$ (Takeshita et al. Reference Takeshita, Segawa, Glazier and Sano1996; Cioni et al. Reference Cioni, Ciliberto and Sommeria1997; Glazier et al. Reference Glazier, Segawa, Naert and Sano1999; King & Aurnou Reference King and Aurnou2013; Zürner et al. Reference Zürner, Schindler, Vogt, Eckert and Schumacher2019; Ren et al. Reference Ren, Tao, Zhang, Ni, Xia and Xie2022) suggest $\alpha$ approaches 1/4 with increasing $Ra$, which is also predicted by GL theory for small $Pr$ and not too large $Ra$ (Grossmann & Lohse Reference Grossmann and Lohse2000). Plugin $\alpha =1/4$ into $\ell$ and $Ra_{\ell }$, we have
 \begin{equation} \ell =H/(1+c_u\varGamma^{{-}2})^{4/9} \quad Ra_{\ell} \equiv Ra/(1+c_u\varGamma^{{-}2})^{4/3}, \end{equation}
for turbulent liquid metal convection. We are now in a position to test the above length scales using the heat transport data just above the onset of convection and in the turbulent state. As we will show next, (3.1) and (3.3) hold near the onset of convection and in the turbulent state in liquid metal convection, respectively, suggesting that the proposed length scales are justified.
Just above the onset of convection, the experimentally measured  $Nu$ is not accurate (see figure 2a) due to unknown parasitic heat leakage. Thus, the following discussion about heat transport just above the onset of convection is mainly based on the DNS data. Details of the DNS data just above the onset of convection can be found in the Appendix.
Figure 3(a) plots  $Nu-1$ versus $Ra/Ra_{c,\varGamma }-1$ just above the onset of convection obtained numerically. Here $Ra_{c,\varGamma }$ is the $\varGamma$-dependant critical Rayleigh number for the onset of convection reported in Ren et al. (Reference Ren, Tao, Xia and Xie2024). The horizontal grey dashed line marks $Nu-1=0$, i.e. the conduction state. A linear function, i.e. $Nu-1= A(Ra/Ra_c-1)$, is used to fit the data for different $\varGamma$ with the fitting results shown as solid lines in the figure. It is seen that with decreasing $\varGamma$, the slope of the linear curve becomes larger, suggesting a steeper growth of $Nu$ with $Ra/Ra_{c,\varGamma }$ for smaller $\varGamma$. Figure 3(b) shows $(Nu-1)/A$ versus $Ra/Ra_{c,\varGamma }-1$. It is seen that data for different $\varGamma$ now collapse onto a single master curve with a slope of 1, suggesting that the proposed length scale near the onset of convection, i.e. $\ell =H/(1+c_u\varGamma ^{-2})^{1/3}$, is justified. The fitted coefficient $A$ versus $\varGamma$ is shown in figure 3(c). A fitting function in the form of $A=C(1+0.34/\varGamma ^2)$ as proposed by Shishkina (Reference Shishkina2021) is used to fit the coefficient $A$ obtained from DNS data, from which we obtain $C=0.018\pm 0.01$. Thus, the heat transport just above the onset of convection follows $Nu-1=0.018(1+0.34/\varGamma ^2)(Ra/Ra_{c,\varGamma }-1)$. The inset of figure 3(c) plots $A$ versus $1/\varGamma ^2$, which now becomes a straight line. It is seen that the numerically obtained $A$ is in good agreement with the fitting curve.

Figure 3. Numerically obtained heat transport just above the onset of convection. (a) Here,  $Nu-1$ versus $Ra/Ra_{c,\varGamma }-1$. The horizontal dashed line marks the conduction state. The solid lines are linear fitting to the data just above the onset of convection, i.e. $Nu-1=A(Ra/Ra_{c,\varGamma }-1)$. (b) Here, $(Nu-1)/A$ versus $Ra/Ra_{c,\varGamma }-1$. (c) The prefactor $A$ of the linear fitting versus $\varGamma$. Red circles and black squares represent the DNS and experimental (EXP) data, respectively. The red solid line is a fit of $A=0.018(1+0.34/\varGamma ^2)$ to the DNS data. The inset shows $A$ versus $1/\varGamma ^2$.
The experimentally measured  $Nu$ just above the onset of convection is shown in figure 4(a,b). It can be seen that the data also follow the linear trend (the solid lines) with the slope of the linear fitting increasing with decreasing $\varGamma$. However, a noticeable difference between $A$ obtained numerically and experimentally can be observed, see figure 3(c). The possible reason might be twofold. First, figure 3(a) shows that the range of the linear trend shortens as $\varGamma$ decreases. For example, the linear growth range is within $0< Ra/Ra_{c,\varGamma }-1<0.05$ in a cell with $\varGamma =1/5$ and it shortens to within $0< Ra/Ra_{c,\varGamma }-1<0.01$ in a cell with $\varGamma =1/20$. The $Nu$ data go below the linear trend with increasing $Ra$, resulting in lower $A$ if one cannot make measurements very close to the onset. It is very difficult to make measurements very close to $Ra_{c,\varGamma }$ in cells with $\varGamma \le 1/10$. Thus, the experimentally measured $A$ in this range is underestimated. Secondly, to reduce $\varGamma$ for fixed $D$ in the experiment, we increased the cell height $H$. In this case, the Oberbeck–Boussinesq approximation may not hold in these slender geometries due to the pressure work that cannot be ignored in the energy equation (Shishkina Reference Shishkina2021; Lohse & Shishkina Reference Lohse and Shishkina2024; Weiss, Emran & Shishkina Reference Weiss, Emran and Shishkina2024), which may also contribute to the difference between DNS and experiment.

Figure 4. Experimentally obtained heat transport just above the onset of convection. (a) Here,  $Nu-a_\varGamma$ versus $Ra/Ra_{c,\varGamma }-1$. The horizontal dashed line marks the conduction state. The solid lines are linear fitting to the data just above the onset of convection, i.e. $Nu-a_\varGamma =A(Ra/Ra_{c,\varGamma }-1)$. (b) Here, $(Nu-a_{\varGamma })/A$ versus $Ra/Ra_{c,\varGamma }-1$.
The measured  $Nu-a_{\varGamma }$ versus $Ra$ in the turbulent state in cells with $\varGamma =1, 1/2$ and $1/3$ is shown as a compensated plot in figure 5(a). The green solid line marks the prediction of the GL theory in a $\varGamma =1$ cell (Grossmann & Lohse Reference Grossmann and Lohse2000; Stevens et al. Reference Stevens, van der Poel, Grossmann and Lohse2013). Although $Nu$ in the $\varGamma =1$ cell agrees well with the GL prediction, we see $Nu$ data in cells with $\varGamma =1/2$ and 1/3 deviate from the $\varGamma =1$ data and the GL prediction. As discussed previously, the appropriate length scale and Rayleigh number in turbulent liquid metal convection are $\ell =H/(1+c_u\varGamma ^{-2})^{4/9}$ and $Ra_{\ell } \equiv Ra/(1+c_u\varGamma ^{-2})^{4/3}$, respectively. Thus, we plot in figure 5(b) $(Nu-a_\varGamma )/Ra^{1/4}$ versus $Ra_{\ell }$. It is seen that once $Ra_{\ell }$ is adopted, the $Nu$ data collapse with each other and the GL prediction with the difference between them being smaller than 5 % for $Ra_{\ell } \ge 7\times 10^5$, as indicated by the yellow error bar in figure 5(b). In addition, one observes that this difference in $Nu$ decreases with increasing $Ra_{\ell }$. We note that a similar collapse of $Nu$ data with $Ra_\ell$ for different $\varGamma$ is found in working fluids such as gas and water (with $\alpha =1/3$) (Shishkina Reference Shishkina2021; Ahlers et al. Reference Ahlers2022). However, the functional form of $\ell$ and $Ra_\ell$ is different due to $Nu\sim Ra^{1/3}$ in these two fluids. We now test the proposed length scale in the turbulent state using data from the literature. Figure 5(c) plots $(Nu-a_{\varGamma })/Ra^{1/4}$ versus $Ra$ from present study and previous data in cells with $\varGamma =1$ and 1/2 (Cioni et al. Reference Cioni, Ciliberto and Sommeria1997; Glazier et al. Reference Glazier, Segawa, Naert and Sano1999; Schindler et al. Reference Schindler, Eckert, Zürner, Schumacher and Vogt2023). From figure 5(c), it can be seen that the overall trends of $Nu$ versus $Ra$ from different studies are consistent. When these $Nu$ data are plotted against $Ra_{\ell }$, as shown in figure 5(d), we notice that $Nu$ data in cells with $\varGamma =1/2$ will collapse on the prediction curve of GL theory with very weak $\varGamma$-dependence when $Ra_{\ell } \ge 7\times 10^5$. One may notice that the data from Cioni et al. (Reference Cioni, Ciliberto and Sommeria1997) is systematically lower than the other groups of data, for which we do not know the exact reason. But it should be noted that different sidewall materials, i.e. stainless steel in Cioni et al. (Reference Cioni, Ciliberto and Sommeria1997) and Plexiglas in the present work, were used.

Figure 5. Data from the present study: (a) compensated plot of  $Nu$ versus $Ra$ obtained experimentally (open symbols) and numerically (solid symbols) for different $\varGamma$; (b) compensated $Nu$ versus $Ra_{\ell }$, i.e. a Rayleigh number based on the length scale $\ell$, for the same data as in (a). Comparison of the present data with those published in the literature: (c) compensated plot of $Nu$ versus $Ra$ and (d) compensated plot of $Nu$ versus $Ra_{\ell }$.
3.3. The two discontinuities
We now study the two discontinuities marked with rectangles in figure 2(a). Close-up views of the two rectangles are shown in figure 6(a,b) for  $\varGamma =1/3$ and $1/2$, respectively. Let us first focus on measurements in the $\varGamma =1/3$ cell. With increasing $Ra$ (open symbols in figure 6a), the system goes through a Hopf bifurcation, transitioning from the steady convection state to an oscillatory state (Ren et al. Reference Ren, Tao, Xia and Xie2024). When time dependency occurs, we observe a drop in $Nu$, resulting in it not following the linear trend just above the onset of convection (the dashed line). Measurement of the LSC structure using the multi-thermal-probe method (Xie, Wei & Xia Reference Xie, Wei and Xia2013) suggests that the LSC is a SRM in the convection state. This can be seen clearly from the time-averaged flow strength $\langle \delta \rangle$ and its orientation $\langle \theta \rangle$ shown as open symbols in figures 6(c) and 6(d), respectively. For $Ra<2.68 \times 10^5$, typical behaviours for a single-roll LSC can be observed, i.e. $\delta$ at three heights with distances $H/4$, $H/2$ and $3H/4$ from the bottom plates remain close to each other and well above zero; and $\langle \theta \rangle$ at three heights remains close to each other. A snapshot of the reconstructed SRM using the measured sidewall temperature is shown as an inset in the lower left-hand corner of figure 6(c). When $Ra$ is increased beyond a critical point, i.e. $2.92\times 10^5$, we observe a sudden drop of $Nu$ up to $34\,\%$. If we check $\langle \delta \rangle$ and $\langle \theta \rangle$ shown in figure 6(c,d), one sees that while $\langle \delta \rangle /\Delta T$ at the midheight of the cell drops close to zero, $\langle \delta \rangle /\Delta T$ at the top and bottom parts of the cell remains well above zero. Meanwhile, there is a $\sim {\rm \pi}$ phase difference between the top and bottom parts of the LSC. These are typical signatures of a DRM of the LSC. The reconstructed structure of the DRM is shown in the upper right-hand corner of figure 6(c). It thus becomes clear that this sudden drop in $Nu$ is due to a bifurcation of the LSC from the SRM to the DRM in the oscillation regime. When $Ra$ is increased further, we only observe oscillation of this DRM. The bifurcation process discussed above is observed with increasing $Ra$. What will happen if we decrease $Ra$? In figure 6(a), the red solid squares are $Nu$ measured when $Ra$ is decreased from $3.92\times 10^5$. Interestingly, the data shows hysteresis, i.e. the DRM could survive at even smaller $Ra$ than the case with increasing $Ra$. In the convection state, we see no noticeable difference between increasing/decreasing $Ra$. The LSC is in the form of SRM.

Figure 6. Here,  $Nu$ versus $Ra$ for (a) $\varGamma =1/3$ and (b) $\varGamma =1/2$. The black dashed line represents a linear fitting to the $Nu$ versus $Ra$ data in the convection state. The vertical lines mark the transition between different flow states reported in Ren et al. (Reference Ren, Tao, Xia and Xie2024). Time averaged (c) flow strength $\langle \delta \rangle /\Delta T$ and (d) orientation $\langle \theta \rangle$ of the LSC versus $Ra$ in the $\varGamma =1/3$ cell. The open and solid symbols are taken with increasing and decreasing $Ra$, respectively. The lower left-hand and upper right-hand insets in (c) are reconstructed SRM and DRM from the sidewall temperatures.
Note the transition between SRM and DRM has been reported in Rayleigh–Bénard turbulence in water (Verzicco & Camussi Reference Verzicco and Camussi2003; Xi & Xia Reference Xi and Xia2008; Weiss & Ahlers Reference Weiss and Ahlers2011). In addition, hysteresis between different flow structures is observed in Taylor–Couette turbulence (Huisman et al. Reference Huisman, van der Veen, Sun and Lohse2014). The present study in liquid metal differs from that in water in two ways. Firstly, the heat transport difference in SRM and DRM in liquid metal is an order of magnitude larger than that in water. Secondly, the hysteresis is observed in an oscillation state, not a turbulent state.
In the  $\varGamma =1/2$ cell, we observed similar behaviours to that in the cell with $\varGamma =1/3$ (cf. figure 6b). However, the LSC in this cell is always in the SRM. When a Hopf bifurcation occurs, we observe a slight drop in the linear slope of $Nu$ versus $Ra$. In addition, hysteresis is observed when $Ra$ is deceased. Because the structure of the LSC in this cell does not change, the maximum difference in $Nu$ when hysteresis occurs is only 1.7 %.
The above observation indicates that when time dependency occurs in cells with  $\varGamma =1/2$ and 1/3, the heat transport of the system always decreases. If this time dependency could be delayed or even suppressed, e.g. by applying rotation or a magnetic field to liquid metal convection, one can then achieve higher heat transport efficiency, which will be useful in engineering heat transport management.
4. Conclusion
We have studied the effect of a small aspect ratio  $\varGamma$ on the heat transport in liquid metal convection with $Pr=0.029$. In the range of $1/50\le \varGamma \le 1$, the DNS shows that just above the onset of convection, $Nu-1=0.018(1+0.34/\varGamma ^2)(Ra/Ra_{c,\varGamma }-1)$ which suggests that the relevant length scale $\ell$ is $\ell =H/(1+c_u\varGamma ^{-2})^{1/3}$ with $c_u=1.49$. The local effective heat transport scaling exponent $\gamma$ reaches its maximum before the system becomes turbulent. In a turbulent state, the measured value of $\gamma$ approaches the GL prediction of 1/4 with increasing $Ra$. Assuming $Nu-1\sim Ra^\alpha$ in turbulent RBC, we propose that the length scales in cells with $\varGamma <1$ is $\ell = H/(1+c_u\varGamma ^{-2})^{1/[3(1-\alpha )]}$. In the $Ra$ range of the present study, we observe $\alpha =0.25$ in turbulent liquid metal convection. Substituting $\alpha =1/4$ into $\ell$, one obtains a length scale $\ell =H/(1+c_u\varGamma ^{-2})^{4/9}$ and $Ra_{\ell } \equiv Ra/(1+c_u\varGamma ^{-2})^{4/3}$. Once the $Nu$ is plotted against $Ra_\ell$, the present study shows that, for $Ra_{\ell }\ge 7\times 10^5$, the heat transport in cells with $1/3\le \varGamma \le 1$ will collapse with each other and with the prediction of the GL theory for $\varGamma =1$. In turbulent thermal convection for $Pr>1$ with $\alpha =1/3$, the above proposed length scale $\ell$ replicates the justified length scale proposed by Shishkina (Reference Shishkina2021) and Ahlers et al. (Reference Ahlers2022), i.e. $\ell =H/(1+c_u\varGamma ^{-2})^{1/2}$. It is also found that when the flow transitions from a steady state to an oscillatory state with increasing $Ra$, the linear growth rate of $Nu$ versus $Ra$ declines. A hysteresis is observed in cells with $\varGamma =1/3$ in the oscillation state. Measurements of the LSC suggest that the hysteresis is caused by the LSC switching from a SRM to a DRM. The SRM is found to be $34\,\%$ more efficient in heat transport when compared with that of the DRM. Since a reduced $\varGamma$ for fixed $D$ is always employed as an efficient way to achieve higher $Ra$, the present study demonstrates quantitatively how a decrease in $\varGamma$ will affect the heat transport behaviour just above the onset of convection and in the turbulent state. It extends the recent theoretical findings by Shishkina (Reference Shishkina2021) obtained for moderate $Pr$ to the case of liquid metal with small $Pr$. It will be interesting to test if $Ra_{\ell }$ is a proper control parameter for fluids with large $Pr$ in the $\varGamma <1$ regime and to turbulent liquid metal convection with even higher $Ra$ where a transition to the ultimate regime is expected.
Acknowledgements
We are grateful to O. Shishkina for helpful discussions.
Funding
This work was supported by the National Science Foundation of China (grant nos 92152104, 12072144, 12232010, 12202173) and a XJTU young talent support plan.
Declaration of interests
The authors report no conflict of interest.
Appendix
Table 1 and table 2 provide details on the DNS.
Table 1. Details of the DNS in the turbulent state. Here  $\varGamma$ is the aspect ratio of the cell; $N_z$, $N_\phi$ and $N_r$ are the number of grid points in the vertical, azimuthal and radial directions, respectively. Here $Ra$ is the Rayleigh number; $Nu$,
$Nu$,  $Nu_{\varepsilon _u}$ and $Nu_{\varepsilon _T}$ are the directly calculated Nusselt number, the Nusselt number calculated based on the viscous dissipation rate and the thermal dissipation rate, respectively.
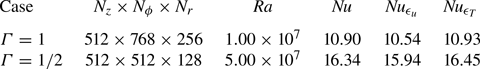
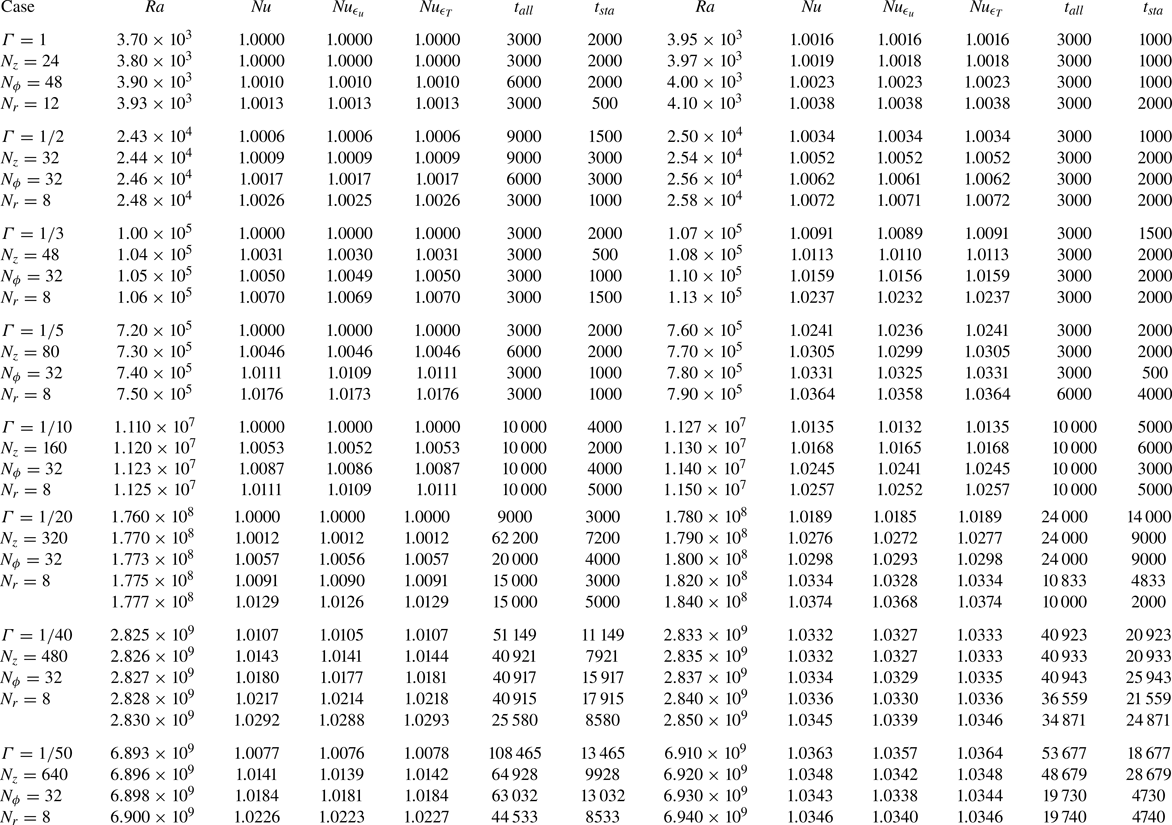
Table 2. Details of the DNS near the onset of convection in the range of  $1/50\le \varGamma \le 1$. The definitions of the symbols is the same as table 1. Only data very close to the onset of convection are listed. Note that a much longer simulation time is required in cells with smaller $\varGamma$ to reach a statistically steady state.


 Open access