


1. Introduction
Impact of compound drops on a solid substrate can be widely seen in industrial processes, such as ink-jet printing (Derby Reference Derby2010; Wijshoff Reference Wijshoff2018; Lohse Reference Lohse2022), tissue construction (Murphy & Atala Reference Murphy and Atala2014; Hendriks et al. Reference Hendriks, Visser, Henke, Leijten, Saris, Sun, Lohse and Karperien2015) and microcapsule collection in pharmacy (Delcea, Mohwald & Skirtach Reference Delcea, Mohwald and Skirtach2011; De Cock et al. Reference De Cock, De Koker, De Geest, Grooten, Vervaet, Remon, Sukhorukov and Antipina2010; Liu et al. Reference Liu, Wu, Dwivedi, Hu, Zhu, Shen, Chu, Zhao, Si and Xu2018a). In these industrial processes, the compound drops consist of an outer (or shell) droplet and one/multiple inner (or core) droplets, and the inner droplets are encapsulated by the outer one. To optimize the processes requires us to gain insights into the impact dynamics of compound drops, especially the deformation of the inner droplet and the spreading of the whole compound drop at various impact conditions. Similar to impacting pure drops (Yarin Reference Yarin2006; Josserand & Thoroddsen Reference Josserand and Thoroddsen2016), the dynamics of impacting compound drops is affected by impact velocity  $V$, surface tension $\gamma$, drop size $D$, wettability of the solid wall and the material properties of the liquid. For compound drops, the differences in fluid properties between the inner and outer droplets, e.g. the volume ratio ( $\alpha$), surface tension ratio ( $\eta$), viscosity ratio and density ratio ( $\lambda$) of the inner droplet to the outer one, are also expected to influence the flow features of drop impact. Therefore, the impact dynamics of compound drops is much more complicated than that of pure drops. A schematic diagram of compound drops impacting onto a substrate is shown in figure 1. Two dimensionless parameters are usually used to describe the impact dynamics of compound drops, i.e. the Weber number $We$ ( $=\rho _1 V^2D/\sigma _{13}$) and the Reynolds number $Re$ ( $=\rho _1 VD/\mu _1$), where $\rho _1$ and $\mu _1$ are the density and viscosity of the shell liquid, respectively, and $\sigma _{13}$ denotes the surface tension coefficient between the shell fluid and surrounding air.

Figure 1. A sketch of a compound drop impacting onto a horizontal substrate at a vertical velocity  $V$. The diameters of the outer and inner droplets of the compound drop are $D$ and $d$, respectively. The simulations are performed in cylindrical coordinates ( $r$,
$r$,  $z$), with $z=0$ being the substrate.
The presence of inner droplets gives rise to fascinating flow phenomena during the impact processes. Gulyaev & Solonenko (Reference Gulyaev and Solonenko2013) observed the occurrence of a counter-jet rising vertically along the centre line of the drop in the experimental investigation of hollow glycerin drops impacting onto a solid surface. Liu & Tran (Reference Liu and Tran2018) revealed in experiments that the change of the volumetric oil ratio in compound drops consisting of water and silicone oil might lead to the transition from spreading to splashing. Moreover, they also reported the emergence of two spreading lamellae, which significantly affect the overall spreading behaviour. Later, they further investigated the splashing dynamics of impacting compound drops (Liu & Tran Reference Liu and Tran2019). Blanken et al. (Reference Blanken, Saleem, Antonini and Thoraval2020) experimentally found that, for an impacting compound drop consisting of core water droplet and oil shell, the core water droplet could rebound from the surface below a threshold impact velocity; they attributed this phenomenon to the lubrication from the oil shell that prevents the contact between the water core and the substrate. Zhang, Li & Thoroddsen (Reference Zhang, Li and Thoroddsen2020) reported the occurrence of fine radial jets near the substrate in the impact of a compound drop containing a number of emulsion droplets. The formation of these radial jets results from the local focusing of the outer liquid, which is forced into the narrowing wedge under each internal droplet.
Numerical simulations have also been used to investigate the impact dynamics of compound drops. Tasoglu et al. (Reference Tasoglu, Kaynak, Szeri, Demirci and Muradoglu2010) studied the deformation and spreading of compound drops at relatively low  $We$ ( $\sim$0.5–10) and $Re$ ( $\sim$15–45) using a front-tracking method, to model the printing of droplet-encapsulated biological cells. Liu et al. (Reference Liu, Zhang, Gao, Lu and Ding2018b) investigated the maximal spreading ratio of impacting compound drops with equal density (i.e. $\lambda =1$) at moderate Reynolds and Weber numbers ( $Re = 1000$ and $10\le We\le 800$), with a focus on the effect of $\alpha$ and $\eta$. Based on the morphology of the compound drop at maximal spreading, they identified two flow regimes, i.e. jammed spreading (at small $\alpha$) and joint rim formation (at relatively large $\alpha$), which differ in that the inner droplet does not participate in the rim formation of the compound drop in the former while it does in the latter. A universal rescaling of impacting compound drops was then proposed with a corrected Weber number that takes $\alpha$, $\eta$ and the flow regime into account. Wei & Thoraval (Reference Wei and Thoraval2021) simulated the impact dynamics of an air-in-liquid compound drop with various $\alpha$. They observed that the addition of a bubble in the drop decreases its maximal spreading, and attributed this to the decrease of the kinetic energy of the drop and the formation of a vertical jet at its centre. A recent review on impacting compound drops can be found in Blanken et al. (Reference Blanken, Saleem, Thoraval and Antonini2021).
Despite of this research on compound drops impacting onto a flat substrate, the density effect on the interaction between the inner and outer interfaces of the compound drops remains unclear. Also, it is important in practice to understand how the density difference between the inner and outer droplets affects the deformation and motion of the inner droplet, and the overall spreading behaviour of whole compound drops.
In this paper, we numerically investigate the dynamics of compound drops impacting onto a flat substrate, aiming to evaluate the effect of  $\lambda$ on the evolution of the interfaces. For this purpose, we perform axisymmetric simulations using a ternary-fluid diffuse-interface method, in the parameter space of $We=50\unicode{x2013}500$, $\lambda =0.001\unicode{x2013}4$, $\alpha =0.027\unicode{x2013}0.216$ and $Re=1000$. We examine the temporal evolution of the inner and outer interfaces, and assess the interaction between the inner and outer droplets at different stages of drop impact. Based on the numerical results, we characterize the motion and deformation of the inner droplet at various $\lambda$, and establish a new universal model for the maximal spreading ratio of impacting compound drops.
2. Problem statement and methodology
2.1. Problem statement
We consider here the axisymmetric impact of a compound drop onto a rigid smooth substrate, as shown in figure 1. The compound drop consists of two concentric droplets, with diameters denoted by  $d$ (for the inner droplet) and $D$ (for the outer droplet), respectively. The density and viscosity of the fluids are defined as $\rho _i$ and $\mu _i$, where the subscript $i$ denotes the respective fluid ( $i = 1$, 2 or 3). The surface tension coefficient between fluid $i$ and $j$ is represented by $\sigma _{ij}$. We assume that the compound drop is made of liquids of low viscosity. For convenience of study, the following parameters are fixed: $Re=1000$, $\rho _3/\rho _1=0.001$, $\mu _2/\mu _1=1$, $\mu _3/\mu _1=0.025$ and the ratio of the inner and outer interfacial tension coefficient $\sigma _{12}=\sigma _{13}$. Then, we restrict our study to the variation of $We$ (or surface tension coefficients), density ratio $\lambda =\rho _2/\rho _1$ and volume ratio $\alpha =(d/D)^3$, with a focus on the effect of the density and size of the inner droplet on the dynamics of impacting compound drops. To avoid very strong coupling between the inner and outer interfaces from the very beginning of drop impact, we only consider relatively small $\alpha$, ranging from $0.027$ to $0.216$. Such a numerical set-up is relevant to real physical conditions. For example, if water is taken as the shell fluid, $Re=1000$ corresponds to a millimetre-sized drop with impact velocity of $O(1)$ m s $^{-1}$. Accordingly, the gravity effect is negligibly small compared with the acceleration encountered in the drop impact ( ${\sim }V^2/D$); for example, the Froude number $Fr=V^2/gD$ is of the order of $10^2$, where $g$ is the gravitational acceleration. Unless stated otherwise, the diameter of the compound droplet $D$ is chosen as the unit length, the time is made dimensionless by the scale $D/V$ and the time $t = 0$ refers to the moment when the compound drop comes into contact with the substrate.
In the present study, the core droplet hardly comes into contact with the solid surface during the spreading of the compound drop, primarily owing to the lubrication effect of the liquid film under it (Blanken et al. Reference Blanken, Saleem, Antonini and Thoraval2020). It should also be noted that there is no splashing of the shell droplet in the range of parameters considered. Therefore, the wetting dynamics is mainly determined by the contact angle  $\theta _{13}$, i.e. the angle at which the interface between fluids 1 and 3 intersects with the substrate. In particular, we consider a superhydrophobic substrate with a fixed $\theta _{13} (=150^\circ )$, while $\theta _{12}$ and $\theta _{23}$ are set to $150^\circ$ and $90^\circ$, respectively. Given $\sigma _{12}$, $\sigma _{13}$, $\theta _{12}$, $\theta _{13}$ and $\theta _{23}$, the surface tension coefficient $\sigma _{23}$ can be uniquely determined (Zhang et al. Reference Zhang, Ding, Gao and Wu2016), specifically, here, $\sigma _{23}=2\sigma _{13}$.
A ternary-fluid diffuse-interface model is used to simulate the impact dynamics of compound drops (Zhang et al. Reference Zhang, Ding, Gao and Wu2016). The same method has been used previously to investigate the maximal spreading of impacting compound drops with  $\lambda =1$ (Liu et al. Reference Liu, Zhang, Gao, Lu and Ding2018b), i.e. the shell and core liquids have the same density. In the method, a cylindrical coordinate system ( $r$,
$r$,  $z$) is adopted to simulate the flow dynamics in a computational domain of $2D \times 1.2D$ on a uniform Cartesian mesh. A no-slip condition and the geometric moving contact line model are imposed at the substrate ( $z=0$), a symmetry condition at $r=0$ and a far-field boundary condition at the right and upper boundaries. Initially, the compound drop is located above the substrate with a distance of $0.1D$, and then descends with velocity of $V$, while the surrounding air is assumed to be stationary.
2.2. Convergence study
We simulate the impact dynamics of a compound drop at  $We=500$, $\alpha =0.064$ and $\lambda =0.1$, to check the convergence of the numerical results. Figure 2 shows snapshots of the compound drop at the dimensionless time $t=0.5$ on successively refined meshes, where the mesh sizes are ${\rm \Delta} x=0.004$, $0.002$ and $0.001$. It is clear that the numerical results converge with the mesh refinement, in terms of the drop shape. The numerical results with ${\rm \Delta} x=0.002$ are nearly overlapping with those on the finest mesh ${\rm \Delta} x=0.001$. We also examine the convergence of the maximal spreading ratio $\beta _{max}$, which is the diameter ratio of the wetted area at the maximal spreading to the initial compound drop. Table 1 shows the variation of $\beta _{max}$ for the different meshes, where the difference decreases with mesh refinement. In particular, the relative error $\epsilon$ between the meshes ${\rm \Delta} x=0.002$ and $0.001$ becomes rather small ( $\epsilon =0.24$%). Therefore, a Cartesian mesh with mesh size of ${\rm \Delta} x=0.002$ is used in the following studies.

Figure 2. Convergence study with respect to the drop shape at the dimensionless time  $t=0.5$ with $We=500$, $\alpha =0.064$ and $\lambda =0.1$. Different curves denote the numerical results with different mesh resolutions: ${\rm \Delta} x=0.004$ (dash-dot-dotted), $0.002$ (dashed) and $0.001$ (solid). The inset shows a zoomed-in view of the interface near the bottom of the inner droplet.
Table 1. Convergence study on successive refined meshes.

3. Results and discussion
3.1. Impact dynamics of compound drops
Figure 3 shows the snapshots of impacting compound drops with a fixed volume fraction ( $\alpha =0.064$) and Weber number ( $We=500$), but different density ratios ( $\lambda = 0.1$, 1 and 4), where the results of a pure drop ( $\alpha =0$) are included for a comparison of the dynamic process. The dynamics of the impacting compound drops is shown in the three supplementary movies available at https://doi.org/10.1017/jfm.2023.388. At the early stage of drop impact ( $t\leq 0.5$), the outer interfaces of all the impacting compound drops have a close resemblance to that of the pure drop. There is little interaction between the inner and outer interfaces at this stage, primarily because the distance between the two interfaces remains relatively large. By contrast, the effect of different $\lambda$ can be clearly seen in the movement of the inner droplets: the larger $\lambda$ is, the lower the location the inner droplet reaches. In addition, the inner droplet with $\lambda =0.1$ has a concave bottom at $t=0.25$, while those with $\lambda \ge 1$ have a convex one. At this stage, the inner and outer interfaces of the impacting compound drops appear to evolve independently.

Figure 3. Snapshots of an impacting pure drop at  $We=500$ (a) and impacting compound drops at $\alpha =0.064$, $We=500$ and various density ratios $\lambda$: 0.1 (b), 1 (c) and 4 (d). The columns from left to right correspond to the results at the time $t=0.25$, $0.75$ and $t_{max}$, where $t_{max}$ denotes the moment when the drop reaches its maximal spreading. In each column, the reference velocity vectors are the same and are shown at the upper-right corner in (a). The numbers above the arrows indicate the values of the reference vector.
At the intermediate stage of drop impact (e.g.  $0.5< t\le 1$), the downward motion of the compound drop pushes the inner droplet further towards the substrate; at the same time, the distance between the inner and outer interfaces is gradually shortened. As a result, the effect of $\lambda$ becomes noticeable in this stage: an upward liquid counter-jet is induced at the bottom of the light inner droplet ( $\lambda =0.1$), thereby hindering the descending of the outer interface near the symmetry axis to some degree (see the second image of figure 3b). By contrast, the dense inner droplet ( $\lambda =4$) apparently impacts onto the substrate (with no formation of contact lines), and spreads over a thin film of fluid 1, with its front rolling up (see the second image of figure 3d). At the intermediate stage, the deformation of the inner droplet starts to affect the evolution of the outer interface.
At the late stage of drop impact, e.g. at the moment of maximal spreading  $t_{max}$, the maximal spreading ratio of the compound drop, $\beta _{max}$, depends on the value of $\lambda$. For the case with $\lambda =0.1$, the inner droplet is penetrated by the induced liquid counter-jet, and evolves into a donut-like shape; subsequently, a recirculation zone occurs at the centre of the compound drop. As a result, the supply of fluid 1 is restricted from the central region to the front of spreading, thereby making its $\beta _{max}$ smaller than the pure drop. By contrast, such an effect of flow restriction is much weaker in the case with $\lambda =1$. Therefore, the compound drop with $\lambda =1$ has almost the same $\beta _{max}$ as the pure drop. For the case with large $\lambda (=4)$, the liquid film beneath the inner droplet breaks up and forms a ring on the substrate, while the rolling-up part of the inner droplet pinches off and expands radially outwards. The dense inner droplet provides extra momentum to the spreading of the compound drop, which is responsible for the larger $\beta _{max}$ than that of the pure drop.
It is clear from the observation of numerical results above that the density contrast of the compound drop plays an important role in the evolution of the inner droplet, which in turn affects the maximal spreading ratio of the whole compound drop. In the following, we will further investigate the dynamic behaviours of the inner interface with different  $\lambda$ (in § 3.2), and quantitatively assess the effect of the density contrast on the maximal spreading ratio (in § 3.3).
3.2. Evolution of the inner interface
3.2.1. Uniform acceleration and self-similar interface evolution at  $\lambda =1$

In this section, we study the motion of the inner droplet at the early stage of drop impact and interface evolution at the intermediate stage for compound drops with equal density ( $\lambda =1$). The interface of an impacting drop can be represented by the vertical component of its position vector $z=h(r, t)$. To examine the motion of the inner droplet, we track the vertical positions of its centroid (denoted by $h_C$), as well as the top and bottom of the inner droplet at the symmetry axis (denoted by $h_T$ and $h_B$, respectively; see the first image in figure 3c). The temporal evolutions of $h_T$, $h_B$ and $h_C$ are shown in figure 4 for an impacting compound drop at $We=500$, $\alpha =0.064$, $\lambda =1$ and various $\alpha$ ( $=0.027$, 0.064 and 0.125). We find that the inner droplet experiences a uniform acceleration $a$ at the early stage, in the sense that $h_C$ can be approximated by
 \begin{equation} h(0, t)=h(0, 0)-t+\tfrac{1}{2}a_0 t^2,\end{equation}
where  $h(0, 0)$ is the initial position and $a_0=aD/V^2$ denotes the dimensionless acceleration. Moreover, the trajectories of $h_C$ are the same for three different $\alpha$ (so as to give a constant $a_{0, C}=1.5$ for $0\le t\le 0.4$ by data fitting), which suggests that the motion of the inner droplet does not depend on $\alpha$ at the early stage of drop impact.

Figure 4. Motion of the inner droplet in terms of time variation of  $h_C$, $h_T$ and $h_B$, with $We=500$, $\lambda =1$ and various $\alpha$: (a) $\alpha =0.064$, (b) $\alpha =0.027$ and (c) $\alpha =0.125$. The dashed lines represent the prediction of (3.1), and the solid lines correspond to the prediction of (3.5). (d) Evolution of the apex of the compound droplets, where the dashed line represents the prediction of (3.1) with zero acceleration.
Interestingly, the time variations of  $h_T$ and $h_B$ in figure 4(a–c) follow a manner very similar to $h_C$, and can also be described by (3.1). For example, in the case of $\alpha =0.064$, we can obtain $h_T|_{t=0}=0.7$ and $h_B|_{t=0}=0.3$ from the initial set-up, and the acceleration at the top of the inner droplet $a_{0, T}=0.83$ and that at the bottom $a_{0, B}=3.5$ by data fitting; here, the duration of acceleration depends on the vertical location, and $0\le t\le 0.5$ at the top and $0\le t \le 0.2$ at the bottom of the inner droplet. That is, the acceleration at the bottom of the inner droplet is much higher than its top, which accounts for its gradual flattening with time. The difference between $a_{0, T}$ and $a_{0, B}$ is found to increase with $\alpha$, e.g. $a_{0, B}=4.8$ and $a_{0, T}=0.75$ for $\alpha =0.125$ while $a_{0, B}=2.8$ and $a_{0, T}=0.95$ for $\alpha =0.027$. Such an acceleration process is not contradictory with zero acceleration at the drop apex at the early stage of impact of pure drops (Eggers et al. Reference Eggers, Fontelos, Josserand and Zaleski2010). Figure 4(d) shows the trajectories of drop apex of the impacting compound drops for $\alpha =0.027$, 0.064 and 0.125. We can see that all the trajectories generally overlap and, moreover, have nearly zero acceleration until $t\approx 0.2$, at which time the pressure gradient arising from drop impact starts to affect the drop apex; see e.g. figure 5.

Figure 5. Time variation of pressure contours (black thin lines) of an impacting compound drop (blue thick lines) with  $We = 500$, $\alpha = 0.064$ and $\lambda = 1.0$ at times $t=0.05$, $0.10$, $0.15$, $0.20$, $0.25$, $0.30$.
The motion of the inner droplet is closely related to the pressure distribution inside the compound drop. Figure 5 shows the pressure contours at the early stage of drop impact (from  $t=0.05$ to $0.30$), with $\lambda =1$, $We=500$ and $\alpha =0.064$. Firstly, once the drop comes into contact with the substrate, we can see that a high pressure zone is instantaneously established in the vicinity of the impact region, and the inner droplet is immediately surrounded by vertical pressure gradients. After this, the high pressure zone expands with the increase of the wetted area on the substrate, while the magnitude of the highest pressure gradually decreases with time. In principle, at the early stage of drop impact, the process of an impacting compound drop with high impact speed and equal density and viscosity (i.e. $\lambda =1$, $\mu _2=\mu _1$, $We\gg 1$ and $Re\gg 1$), is similar to that of an impacting pure drop, owing to the dominance of drop inertia over the surface tension of the inner droplet. Consequently, the interface of the inner drop can be viewed as a flow tracer, until the effect of its surface tension cannot be neglected anymore (e.g. when the curvatures at the sides of the flattened inner droplet become high). This explains why the trajectories of $h_C$ and the drop apex are independent of $\alpha$. Secondly, the flow inside the compound drop is decelerated vertically by the pressure gradients, and is then redirected near the substrate to the spreading (see also figure 3). We note that the pressure gradient varies with the vertical position. More precisely, the closer the position relative to the substrate, the stronger the pressure gradient and, therefore, the larger the acceleration of the flow. In addition, because the maximum pressure decreases with time, the pressure distribution around the inner droplet does not significantly change with the droplet descending, leading to the more or less uniform acceleration of the inner droplet. Thirdly, as the drop apex is away from the substrate, it is hardly affected by the pressure gradient at the very beginning of drop impact.
In the intermediate stage, the flow inside the drop is no more driven by the high pressure induced by the impact, and can be approximated by an axisymmetric stagnation point flow (Eggers et al. Reference Eggers, Fontelos, Josserand and Zaleski2010). As a result, the shape evolution of an impacting pure drop would enter a self-similar inertial regime thereafter (Eggers et al. Reference Eggers, Fontelos, Josserand and Zaleski2010; Lagubeau et al. Reference Lagubeau, Fontelos, Josserand, Maurel, Pagneux and Petitjeans2012; Gordillo, Sun & Cheng Reference Gordillo, Sun and Cheng2018; Mitchell et al. Reference Mitchell, Klewicki, Korkolis and Kinsey2019). Because the inner droplet is enclosed by the outer liquid of the compound drop, the self-similar evolution of the inner interface is supposed to start at the same time as the establishment of the stagnation point flow inside the impacting compound drop.
If the flow in the compound drop evolves into stagnation point flow, it can be expressed in the axisymmetric framework by
 \begin{equation} v_r = \frac{r}{\tau} \quad \text{and}\quad v_z ={-} \frac{2z}{\tau}, \end{equation}
where  $\tau$ denotes the time of the stagnation point flow, $v_r$ and $v_z$ are the radial and vertical velocity components, respectively. The subsequent interface evolution follows $Dh/D\tau =0$, or
 \begin{equation} \frac{\partial h}{\partial \tau}+ v_r\frac{\partial h}{\partial r} = v_z.\end{equation}
Equation (3.3) has the similarity solution
 \begin{equation} h(r,\tau) = \frac{1}{\tau^2} H\left(\frac{r}{\tau}\right),\end{equation}
which is valid for any function  $H$ (Eggers et al. Reference Eggers, Fontelos, Josserand and Zaleski2010). In other words, if the deformed interface has a scale of $l$ in the $z$ direction, (3.4) suggests that its scale in the $r$ direction should be of the order of $l^{-1/2}$.
Eggers et al. (Reference Eggers, Fontelos, Josserand and Zaleski2010) reported that the stagnation point flow might start from  $t\approx 0.5$ for an impacting pure drop. We check whether this is also true for the impacting compound drop by examining the time variation of $h_T$ and $h_B$. Note that $\tau$ is related to the physical time $t$ by $\tau =t+t_0$, in which $t_0$ is a case-dependent constant. To determine $t_0$ in a specific flow problem, we need to take account of the condition of $v_z$ in (3.2a,b). From the numerical results at $t=0.5$, we get $h_T=0.307$ and $v_z=-0.52$ at the top of the inner interface, which suggests $t_0=0.680$. In addition, we can also obtain $h_B=0.092$ and $v_z=-0.16$ at the bottom of the inner interface at $t=0.5$, which gives $t_0=0.644$. Because the two $t_0$ only have a difference of 5 % in magnitude, it implies that the flow in the compound drop at $t=0.5$ is very close to stagnation point flow.
Suppose that the flow enters the regime of stagnation point flow at  $\tau =\tau _0$, it is easy to obtain from (3.4) that the subsequent time variation of $h_T$ (and $h_B$) should obey
 \begin{equation} \frac{h(0, \tau)}{h(0, \tau_0)}=\left(\frac{\tau_0}{\tau}\right)^ 2. \end{equation}
We plot in figure 4 the prediction of  $h_C$, $h_T$ and $h_B$ by (3.5), with $\tau _0=0.5+t_0$ and $t_0=0.662$ (i.e. the averaged value of the two $t_0$). We can see that the theoretical prediction agrees well with the numerical results for $t\in [0.5, 1]$. Furthermore, it is also interesting to see in figure 4(a) that the self-similar solution of $h_C$ can be extended to as early as $t=0.24$, while it is $t=0.16$ for $h_B$ and $t=0.44$ for $h_T$. This observation suggests that the lower part of flow enters the self-similar inertial regime at an earlier time.
Figure 6(a) shows the snapshots of the inner interface in the stagnation point flow at  $We=500$, $\lambda =1$ and $\alpha =0.064$ (specifically from time $t=0.5$ to $0.9$, with a time interval of $0.1$). To check whether the interface evolution is self-similar, we firstly choose $l=h_T-h_B$ as the characteristic length of the deformed inner droplet in the $z$ direction. If the inner interface undergoes self-similar evolution, it would have $1/\sqrt {h_T-h_B}$ as its characteristic length in the $r$ direction. Then, we rescale the corresponding droplet shapes by the self-similar scales, i.e. ( $r\sqrt {h_T-h_B}$, $(z-h_B)/(h_T-h_B)$), and the results are shown in figure 6(b). We can see that the inner interface at different times appears to overlap in the self-similar coordinate, except the region near its spreading front. The deviation from the self-similar solution at the spreading front is reasonably expected at the late times ( $t=0.8$ and $0.9$). Because the local curvature progressively increases with time (also see figure 6a), the effect of surface tension on the drop shape cannot be neglected at the late times.

Figure 6. (a) The superimposed shapes of the inner droplet at different times at  $We=500$, $\lambda =1$ and $\alpha =0.064$. (b) Illustration of self-similar evolution of the inner droplet, in which the droplet shapes are rescaled by the self-similar length scales.
3.2.2. Density effect on the motion of inner droplet
In order to assess the effect of density ratio on the dynamics of the inner droplet, we plot the time evolution of  $h_C$ at $We=500$, $\alpha =0.064$ and various $\lambda (=0.25, 0.5, 1, 2, 4)$ in figure 7. We can see that, the lower the density of the inner droplet, the higher the position of $h_C$. This indicates that the inner droplets encounter different accelerations, of which the magnitude increases monotonically with $\lambda$. The density difference also affect the pressure distribution inside the compound drop. Figure 8 shows the pressure contours of impacting compound drops at the early stage (more precisely, $t=0.15$) with $We = 500$, $\alpha = 0.064$ and various $\lambda$ ( $=0.1$, $1.0$, $4.0$). We can see that the maximum pressure increases with $\lambda$, because initial momentum of the inner droplet also increases with $\lambda$ and a denser droplet is harder to stop. Similar to the cases with $\lambda =1$ in § 3.2.1, a uniform acceleration process is expected for the inner droplet with $\lambda \ne 1$ at the early stage of drop impact. If so, the trajectory of the inner droplet can also be described by (3.1), by replacing $a_0$ by a $\lambda$-dependent acceleration $a_\lambda$.


Figure 8. Pressure contours (lines with numbers) of impacting compound drops (thick lines) with  $We = 500$, $\alpha = 0.064$ and various $\lambda =0.1$, $1.0$, $4.0$ at time $t=0.15$.
Because for small  $\alpha$ the inner and outer interfaces of the impacting compound drops evolve independently at the early stage of impact, the motion of the inner droplet can be modelled as a droplet subject to an impulsive acceleration $a_0$ of the surrounding fluid in an open space. Without loss of generality, we use the Atwood number $A=(\rho _1-\rho _2)/(\rho _1+\rho _2)=(1-\lambda )/(1+\lambda )$ to represent the effect of $\lambda$ on the acceleration $a_\lambda$. A linear approximation of $a_\lambda$ as a function of $A$ can be obtained by Taylor expansion around $A=0$ (or equivalently $\lambda =1$),
 \begin{equation} a_\lambda=a_0+\frac{\partial a_\lambda}{\partial A} A + O(A^2). \end{equation}
At the early stage of drop impact, the buoyancy force and the effect of added mass play a major role in the acceleration process (and both are a linear function of density), while the viscous force exerted by the surrounding fluid can be neglected. It is reasonable to assume that the quadratic term on the right-hand side of (3.6) is negligibly small.
To determine the value of  $({1}/{a_0}) ({\partial a_\lambda }/{\partial A})$, we check $a_\lambda /a_0$ under two extreme conditions, i.e. $A=-1$ and 1 (corresponding to $\lambda \rightarrow \infty$ and $\lambda \rightarrow 0$, respectively). When $A \rightarrow -1$, it is straightforward to have $a_\lambda /a_0\rightarrow 0$. The case of $A \rightarrow 1$ corresponds to a gas bubble immersed in an accelerated dense liquid. We assume that the bubble is more or less spherical, so that the added mass can be approximated by $\frac {1}{2}\rho _1\varOmega$, where $\varOmega$ denotes the volume of the bubble. Taking the added mass and the buoyancy force ( $\approx \rho _1\varOmega a_0$) into account, we can get $a_\lambda /a_0 \rightarrow 2$ for $A \rightarrow 1$. It is noteworthy that we obtain $({1}/{a_0}) ({\partial a_\lambda }/{\partial A})\approx 1$ from either $A \rightarrow -1$ or $A\rightarrow 1$. This fact is further confirmation that the acceleration of the inner droplet at the early stage of drop impact theoretically follows
 \begin{equation} a_\lambda=a_0(1+A).\end{equation}
 Equation (3.7) can be verified by comparing the prediction of  $h_C$ by (3.1) against the numerical results. Figure 9 shows the evolution of $h_C$ at $We = 500$ and various $\alpha$ ( $=0.027$, 0.064 and 0.125) and $\lambda$ ( $=0.25$ and 4), along with the prediction of (3.1), in which $a_{0, C}=1.5$ obtained from numerical results at $\lambda =1$ is used to calculate $a_\lambda$ by (3.7). It is interesting to see that the trajectories of $h_C$ for the three different $\alpha$ are virtually overlapped at the early stage of impact, specifically $t\le 0.25$ for $\lambda =0.25$ and $t\le 0.35$ for $\lambda =4$. That is, the time variation of $h_C$ is not sensitive to $\alpha$ for relatively small $\alpha$. Also, the predictions are in good agreement with the numerical results in the respective range of time, as expected.

Figure 9. Evolution of the vertical position of the centroid of the inner droplet ( $h_C$) at $We = 500$ and various $\alpha$ ( $=0.027$, 0.064 and 0.125). In particular, $\lambda =0.25$ in (a), and $\lambda =4$ in (b). The dashed line corresponds to the prediction of (3.1), with $a_\lambda$ calculated by (3.7). The inset shows the superimposed interfaces of the inner droplets with different $\alpha$.
3.2.3. Density effect on the inner droplet deformation at the immediate stage
At the intermediate stage of drop impact, the deformation of the inner droplets with  $\lambda <1$ is very different from that with $\lambda >1$ (cf. the middle column in figure 3). For $\lambda <1$, the non-alignment of pressure and density gradients at the bottom of the inner droplet gives rise to the baroclinic effect and the subsequent generation of vorticity at the interface (cf. figure 10a). This phenomenon consequently enhances the ascending movement of the bottom of the inner droplet. At a later time, an upward counter-jet is induced by the vorticity, and breaks up the inner droplet (see the two right images in figure 3b). Such a counter-jet has been experimentally observed in a wide range of $Re$ and $We$ after the impact of hollow drops, and it could be so strong as to penetrate the whole compound drop, especially with large impact velocity and $\alpha$ (Gulyaev & Solonenko Reference Gulyaev and Solonenko2013). When the inner droplet with $\lambda \ge 1$ is approaching the substrate, its deformation is characterized by the formation and subsequent evolution of a lamella at the spreading front. Figure 10 shows the snapshots of impacting drops at $\alpha =0.064$, $We=500$ and various density contrasts ( $\lambda =1, 2$ and $4$). We notice that, with the increase of $\lambda$, the lamella becomes thinner and thinner, probably accompanied by curling up.

Figure 10. Snapshots of impacting compound droplets with  $\alpha =0.064$, $We=500$ and various $\lambda$. In particular, (a) $\lambda =0.1$, $t=0.25$, (b) $\lambda =1$, $t=1.25$, (c) $\lambda =2$, $t=0.9$, (d) $\lambda =4$, $t=0.6$. The horizontal velocity contour (left) and vorticity (right) are shown.
Figure 11(a) shows the lamella thickness of the inner droplet ( $h_l$) as a function of $We$ for $\lambda =1$, $1.5$, $2$ and $4$. Here, $h_l$ is defined as the mean thickness of the lamella (over a distance of 0.03 starting from the lamella front), which is measured at the moment when the velocity of the inner droplet centroid approaches zero. Despite of the differences between the results at various $\lambda$, the dimensionless lamella thickness $h_l/D$ is seen to have a scaling of $We^{-1/2}$ for the cases with the same $\lambda$. This observation is very similar to the deformation of a pure drop after impacting onto a substrate, for which Clanet et al. (Reference Clanet, Béguin, Richard and Quéré2004) experimentally found that the dimensionless lamella thickness follows $h_l/D\sim We^{-1/2}$. Moreover, they attributed this to the balance between the surface tension and the vertical deceleration of the drop ( $\sim V^2/D$). The balance gives rise to an effective capillary length ( $\sim \sqrt {\sigma D/(\rho V^2)}=D \,We^{-1/2}$), which is nothing but the scale of the lamella thickness. The idea of Clanet et al. (Reference Clanet, Béguin, Richard and Quéré2004) is adopted here to analyse the lamella thickness of the inner droplet. At the early stage of drop impact, the inner droplet experiences more or less uniform acceleration $a_0(1+A)V^2/D$, as indicated in (3.7). When the inner droplet is approaching the substrate (at $t\approx 0.5$), its vertical velocity approximately reduces to $U_i=V(1-A)/2$. Then, after a time scale of $d/U_i$, the vertical momentum of the inner droplet is supposed to completely transform to its horizontal spreading. In other words, the inner droplet encounters an acceleration of scale $U_i^2/d$ in the process of momentum transformation. Therefore, from the balance between surface tension and drop acceleration as in Clanet et al. (Reference Clanet, Béguin, Richard and Quéré2004), the dimensionless lamella thickness of the inner droplet with $\lambda \ge 1$ should follow
 \begin{equation} \frac{h_l}{D}\sim [\lambda (1-A)^2\alpha^{-{1}/{3}}We]^{-{1}/{2}}.\end{equation}
Figure 11(b) shows  $h_l$ vs $\lambda (1-A)^2\alpha ^{-{1}/{3}}We$ on a log–log scale with different $\lambda$ and $\alpha$. The results roughly collapse onto a straight line, which corresponds to the theoretical predictions in (3.8).

Figure 11. (a) Variation of lamella thickness of the inner droplet ( $h_l/D$) as a function of $We$ at $\alpha =0.064$ on a log–log scale. (b) The lamella thickness as a function of $\lambda (1-A)^2\alpha ^{-{1}/{3}}We$ on a log–log scale, in which $We$ ranges from 50 to 500, $\lambda$ from 1 to 4 and $\alpha$ from 0.027 to 0.125.
The rolling up of the lamella of the inner droplet is caused by a mechanism that is the same as that of the ejected sheet in the impact of a pure drop (Riboux & Gordillo Reference Riboux and Gordillo2014). This is a combined effect of the lubrication force exerted by the surrounding fluid near the lamella front, and the suction force due to the Bernoulli pressure acting on top of the spreading lamella. Obviously, the mechanism becomes more significant for a thinner lamella.
3.3. The maximal spreading ratio of compound drops
At the late stage of spreading of impacting compound drops, the interaction between the inner and outer interfaces becomes more intensive (see e.g. the last column of figure 3), and the presence of the inner droplet can affect the maximal spreading of the whole compound drop. Liu et al. (Reference Liu, Zhang, Gao, Lu and Ding2018b) identified two flow regimes, i.e. jammed spreading (at small  $\alpha$) and joint rim formation (at large $\alpha$). In particular, in the regime of jammed spreading, which is closely related to the present study, the contribution of the initial kinetic energy of the inner droplet to the spreading of the whole drop was found to decrease linearly with $\alpha$. In this section, we focus on the effect of the density variation of the inner droplet (represented by $\lambda$) on the maximal spreading ratio $\beta _{max}$.
Figure 12(a) shows the variation of  $\beta _{max}$ as a function of $We$ for different values of $\alpha$ ( $0\le \alpha \le 0.216$) and $\lambda$ ( $=0.25$ and $2$). We can see that at low $\lambda (=0.25)$, $\beta _{max}$ monotonically decreases with $\alpha$ for all Weber numbers; comparatively, $\beta _{max}$ is less sensitive to the change of $\alpha$ at relatively high $\lambda (=2)$. More results are shown in figure 12(b), in terms of $\beta _{max}$ vs $\lambda$. We can see that $\beta _{max}$ generally increases with $\lambda$ for the same $\alpha$ and $We$.
$We$.

Figure 12. (a) Maximal spreading ratio  $\beta _{max}$ vs $We$ with two fixed $\lambda$; specifically, $\lambda =0.25$ (hollow symbols) and $2$ (filled symbols). Various values of $\alpha$ are considered, including $\alpha =0.064$ ( $\triangle$), 0.125 ( $\triangledown$) and 0.216 ( $\square$). (b) Maximal spreading ratio $\beta _{max}$ at $We=500$ as a function of $\lambda$ with different $\alpha$. The horizontal dashed line denotes the value for the pure drop ( $\alpha =0$).
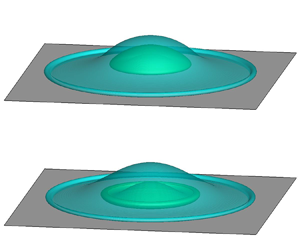
To interpret these observations, we present the snapshots of the impacting compound drops at maximal spreading at different relatively small  $\lambda$ ( $=0.1$ and $0.5$) in figure 13 and relatively large $\lambda$ ( $=1.5$) in figure 14. For the compound drops, the drop shape at the maximal spreading is characterized by the upward bulging of the drop at its centre. The bulging arises from the floating inner droplet, which could be flattened (cf. $\lambda >1$ in figure 14) or reshaped into a ’donut’ (cf. $\lambda =0.1$ in figure 13). The size of the bulging structure can be approximately measured by its height at the symmetry axis $H$ and the radius of the spreading front of the inner droplet $R_b$ (see the first row in figure 13c).

Figure 13. Snapshots of compound drops at the maximal spreading at  $We=500$ and various $\alpha$ and $\lambda$. Specifically, (a) $\alpha =0.064$, (b) $\alpha =0.125$ and (c) $\alpha =0.216$; $\lambda =0.1$ in the top row, $\lambda =0.5$ in the middle row and $\lambda =1.0$ in the bottom row. Here, $H$ and $R_b$ are the dimensionless height of the compound drop at the symmetry axis and the dimensionless radius of the inner droplet, respectively. For comparison, the maximal spreading diameters at $\lambda =1.0$ are marked by the dashed lines.

Figure 14. Snapshots of compound drops at the maximal spreading at fixed  $We$ ( $=500$) and $\lambda$ ( $=1.5$) but different $\alpha$: $0.064$ (a), $0.125$ (b) and $0.216$ (c). The dashed line denotes the maximal spreading diameter for $\alpha =0.216$, i.e. the case in (c).
For the cases with  $\lambda <1$, we can see that the lower the $\lambda$, the higher the $H$; in particular, the deformed inner droplet holds more liquid than that at $\lambda =1$ (figure 13), due to the density effect on its motion (see details in § 3.2.2). This fact gives rise to a smaller $\beta _{max}$ at $\lambda <1$ than at $\lambda =1$, because a larger bulging structure would reduce the liquid supply to the spreading front more significantly. Furthermore, the deformation of the inner droplet with $\lambda \le 1$ can be measured by the relative significance of droplet inertia to surface tension, i.e. $\rho _1 V^2 d/\sigma _{12}=\alpha ^{1/3}We$. A larger $\alpha$ would lead to a more deformed inner droplet (or larger $R_b$; see figure 13) at the same Weber number and subsequently a more noticeable bulging structure. Therefore, the change of the bulging structure for $\lambda <1$ accounts for the monotonic decrease of $\beta _{max}$ with $\alpha$ in figure 12. By contrast, for the cases with $\lambda >1$, the flattened inner drop is generally located in the vicinity of the substrate at the maximal spreading, which is similar to that at $\lambda =1$. Furthermore, $H$ (
$H$ ( $\approx 0.06$) is not sensitive to $\lambda$ for small values of $\alpha$ (see figure 14).
To obtain the relation between  $\beta _{max}$ and $\lambda$ for the impacting compound drops, we follow the modelling strategy of Liu et al. (Reference Liu, Zhang, Gao, Lu and Ding2018b); that is, to propose a corrected Weber number $We^*_\lambda$ by taking account of the density contrast, and use $We^*_\lambda$ in the universal scaling for impacting pure drops. In order to do so, it is crucial to assess how much of the initial kinetic energy of compound drops would contribute to the spreading of the compound drop. The initial kinetic energy of a compound drop can be expressed by $\eta _i E_k$, where $E_k={\rm \pi} \rho _1 D^3 V^2/12$ corresponds to the initial kinetic energy of the compound drop at $\lambda =1$, and
 \begin{equation} \eta_i=1+\alpha(\lambda-1).\end{equation}
 For the impacting compound drops with  $\lambda =1$ in the regime of jammed spreading, which occurs at small $\alpha$, Liu et al. (Reference Liu, Zhang, Gao, Lu and Ding2018b) found that the contribution of the kinetic energy of the inner droplet decreases linearly with $\alpha$. In particular, given $\sigma _{12}/\sigma _{13}=1$, their model of the corrected Weber number ((3.3) in their paper) can be simplified to
 \begin{equation} We^*=(1-\alpha) We.\end{equation}
We can see in figure 3 that the descending inner droplet with  $\lambda >1$ is more capable of draining away the fluid beneath it than that with $\lambda =1$, thereby producing a similar but slightly lower bulging structure. Despite of the possible difference in topology of the inner droplet between $\lambda =1$ and $\lambda >1$, we assume that the effective contribution of the kinetic energy with $\lambda >1$ can also be approximated by (3.10). Combining (3.10) with the correction of drop inertia by $\lambda$, i.e. (3.9), we can obtain the $\lambda$-corrected Weber number
 \begin{equation} We^*_\lambda=\eta_i We^*=(1-\alpha+\alpha\lambda)(1-\alpha)We, \quad {\rm for}\ \lambda\ge1. \end{equation}
 Wang et al. (Reference Wang, Shi, Zhang and Ding2022) recently proposed a universal model to predict  $\beta _{max}$ for impacting pure drops in a wide range of Reynolds number ( $10 \le Re \le 10\ 000$), Weber number ( $20 \le We \le 1000$) and substrate wettability ( $30^\circ \le \theta \le 150^\circ$), which gives
 \begin{equation} \beta_{max}Re^{{-}1/5}=\frac{f(P)}{2+f(P)},\end{equation}
where  $f(P)=P^{1/4}+10P^{1/2}$, and $P=WeRe^{-4/5}(1-\cos \theta )^{-2}$. Substituting the corrected Weber number in (3.11) into (3.12), we can expect to obtain a universal model of $\beta _{max}$ for impacting compound drops.
However, when using (3.11) for the cases with  $\lambda <1$, the numerical results are found to be scattered below the theoretical prediction; by contrast, these with $\lambda =1$ are well predicted by the model; see figure 15(a). The particular bulging structure at $\lambda <1$ is probably responsible for the deviation from the theoretical prediction. Because of the baroclinic effect at the bottom of the inner droplet and the induced counter-jet, the bulging structure at $\lambda <1$ is noticeably bigger than that at $\lambda =1$ (cf. figure 13). This should be taken into account in the estimate of $We^*_\lambda$, e.g. by introducing a correction of $\eta _b$
 \begin{equation} We^{*}_\lambda=(1-\alpha+\alpha\lambda)(1-\alpha-\eta_b)We, \quad {\rm for}\ \lambda\le1.\end{equation}
Clearly, the correction  $\eta _b$ is dependent on $\alpha$ and $\lambda$. It is straightforward to get $\eta _b\rightarrow 0$ when either $\lambda \rightarrow 1$ (compound drops with equal density) or $\alpha \rightarrow 0$ (pure drops). In such a way, the effect of the additional blocked liquid vanishes in case of either compound drops with $\lambda =1$ or pure drops.

Figure 15. Value of  $\beta _{max}$ as a function of $We^{*}_\lambda$ for the cases with $\lambda \le 1$: (a) without the correction $\eta _b$, and (b) with the correction $\eta _b$. The numerical results consist of those with $\alpha =0.216$ and various $\lambda$ ( $=0.1, 0.5, 1$) ( $\square$), those with $\lambda =0.25$ and various $\alpha$ ( $=0.064, 0.125, 0.216$) ( $\lozenge$) and those with $\lambda =0.001$ (corresponding to the hollow drops) and various $\alpha$ ( $=0.064, 0.125, 0.216$) ( $\circ$). The filled symbols indicate the numerical results with $\lambda =1$, and the solid curve represents the universal model of (3.12).
On the other hand,  $\eta _b$ should be proportional to the additional volume of liquid 1 held in the bulging structure at $\lambda <1$ relative to $\lambda =1$. Figure 16(a) shows the variation of the bulge size as a function of $\lambda$ in terms of $H$ and $R_b$ for $\alpha =0.064$, $0.125$ and $0.216$. The plot indicates that $H$ generally decreases with $\lambda$. Moreover, both $H$ and $R_b$ are not sensitive to $\alpha$ when $\lambda \ge 0.5$. For $\lambda < 0.5$, the increase of $\alpha$ leads to more significant changes of $R_b$ with $\lambda$, approximately 10 % at $\alpha =0.064$ and 25 % at $\alpha =0.216$. In the present study, the volume of the bulging structure is approximated by $V_b= 6 R_b^2H$. As shown in figure 16(b), $V_b|_{\lambda <1}-V_b|_{\lambda =1}$ is found to be roughly proportional to $\alpha (1-\lambda )^2(1-\alpha )$; in particular, the smaller the $\alpha$, the better the proportionality. Therefore, $\eta _b$ is expected to have a form
 \begin{equation} \eta_b \propto\alpha(1-\lambda)^2(1-\alpha).\end{equation}
The results with the  $\eta _b$ correction (by an approximation of $\eta _b$ in (3.14) with a prefactor of 1) for $\lambda <1$ are shown in figure 15(b). We can see that the numerical results gather around the theoretical prediction now, and the maximal difference relative to the prediction of (3.13) also reduces from 13 % (without the correction) to 6 % (with the correction).

Figure 16. (a) Variation of  $H$ (filled symbols and solid lines) and $R_b$ (dashed lines and empty symbols) as a function of $\lambda$ at $We=500$. (b) Variation of $V_b|_{\lambda <1}-V_b|_{\lambda =1}$ as a function of $\alpha (1-\lambda )^2(1-\alpha )$ at $We=50$ (filled symbols) and $500$ (empty symbols); the solid line denotes $V_b|_{\lambda <1}-V_b|_{\lambda =1}=6\alpha (1-\lambda )^2(1-\alpha )$. The symbols represent numerical data at different $\alpha$: 0.064 ( $\triangle$), 0.125 ( $\triangledown$) and 0.216 ( $\square$).
It is noteworthy that the corrections of the Weber number in (3.11) and (3.13) are only applicable to relatively small  $\alpha$ ( $\le 0.216$ in the present study). We present all the numerical results in figure 17(a) with respect to $\beta _{max}$ vs $We^{*}_\lambda$. All the results appear to collapse onto a single curve, which is in line with the prediction of (3.12). We find that this universal model for pure drops can well represent the results for compound drops by using $We^*_\lambda$, with a maximum relative difference of 6 %. Based on the numerical simulations, Wei & Thoraval (Reference Wei and Thoraval2021) also proposed a model ((4) in their paper) for impacting hollow drops, i.e. $\lambda =0.001$. Figure 17(b) shows the comparison of the prediction of Wei & Thoraval's model against our numerical results. Note that we use $We_\lambda ^*=(1-\alpha )(1-\alpha +\alpha \lambda )We$ in their model instead of $We_\lambda ^*=(1-\alpha )^2 We$ in the original paper, in order to take account of the density effect in drop inertia and get a better agreement. Because it was established based on results for hollow drops, it is not surprising that the model agrees excellently with our numerical results of hollow drops. However, the distribution of the other data is more scattered compared with the present model in figure 17(a).

Figure 17. (a) Universal model of  $\beta _{max}$ of impacting drops using $We^{*}_\lambda$. The numerical results include symbols pure drops ( $\circ$) and compound drops, and are represented by symbols. For the impacting compound drops, the cases consist of those with $\lambda =0.25$ and various $\alpha$ ( $= 0.064$ ( $\triangle$), 0.125 ( $\triangledown$) and 0.216 ( $\square$)), those with $\lambda =2$ and various $\alpha$ ( $= 0.064$ ( $\blacktriangle$), 0.125 ( $\blacktriangledown$) and 0.216 ( $\blacksquare$)), those with $\alpha =0.216$ and $\lambda$ ranging from $0.1$ to $2$ (
$2$ ( $\ast$) and those with $\lambda =0.001$ and $\alpha$ ranging from $0.064$ to $0.216$ ( $\bullet$). The solid curve denotes the universal model (3.12) with $We^*_\lambda$ as the variable. (b) Rescaled $\beta _{max}$ as a function of $We^*_\lambda$ defined in (3.11). The symbols represent the numerical results, which are the same as in (a); the solid curve denotes the theoretical prediction of Wei & Thoraval (Reference Wei and Thoraval2021), in which the modified Reynolds number $Re^*=0.83(1-\alpha ^{2/3})Re$ and the fitting parameter $\beta _0=1.2$ were used.
4. Conclusion
We have numerically studied the dynamics of impacting compound drops at moderate Weber and Reynolds numbers using a ternary-fluid diffuse-interface method, with a focus on how the density ratio  $\lambda$ between the inner and outer droplets affects the evolution of the interfaces. We firstly examined the dynamic behaviour of the inner droplet at different stages of drop impact. At the early stage, the inner droplet experiences more or less a uniform acceleration, owing to the development of impact-induced pressure. The magnitude of the acceleration at $\lambda \ne 1$ (denoted by $a_\lambda$) was then correlated with the acceleration at $\lambda =1$ (denoted by $a_0$) and the Atwood number ( $A$), specifically by $a_\lambda =a_0(1+A)$. At the intermediate stage, the shape evolution of the inner droplet at $\lambda =1$ followed a self-similar trend, which is closely related to the occurrence of stagnation point flows inside the compound drop. For $\lambda >1$, a lamella was found to form at the spreading front of the inner droplet, similar to the deformation of a pure drop after impacting onto a substrate. We theoretically analysed the thickness of the lamella $h_l$, and ended up with a scale of $h_l/D\sim (\lambda (1-A)^2\alpha ^{-{1}/{3}}We)^{-{1}/{2}}$, which agrees with numerical results. Secondly, we investigated the effect of the density ratio on the maximal spreading of the compound drop. A bulging structure is generally observed at the centre of the compound drop due to the presence of the inner droplet, thereby effectively reducing the liquid supply to the spreading front and leading to a decrease of $\beta _{max}$ as compared with a pure drop. In particular, the occurrence of a counter-jet at $\lambda <1$ makes the bulging structure much larger than that at $\lambda \ge 1$. To obtain a universal expression of $\beta _{max}$ for impacting compound drops, we analysed the effect of $\lambda$ on the contribution of the initial kinetic energy to the drop spreading and the features of the bulging structure. Then, we proposed a corrected Weber number $We^*_\lambda$ by taking account of the combined effects of $\lambda$, $\alpha$, $We$ and the morphology of the compound drop. Replacing $We$ by $We^*_\lambda$ in the universal model for impacting pure drops, we successfully obtained a good prediction of the maximal spreading ratio for compound drops with liquids of different densities.
In the present study, we considered a fixed  $\theta _{13}=150^\circ$. Similarly to the impact dynamics of pure drops (Wang et al. Reference Wang, Shi, Zhang and Ding2022), the substrate wettability (represented by $\theta _{13}$ here) is supposed to affect the maximal spreading of compound drops too. In addition, as the substrate is essentially superhydrophobic, the compound droplet would retract after the maximal spreading happens. The effect of wettability and the retraction dynamics is beyond the scope of the present study and would be the topic of our future research.
Supplementary movies
Supplementary movies are available at https://doi.org/10.1017/jfm.2023.388.
Funding
We are grateful for the support of the National Natural Science Foundation of China (grant numbers 11425210, 11621202, 11672288, 11702288, 11932019), the National Key Project GJXM92579 and the Fundamental Research Funds for the Central Universities.
Declaration of interests
The authors report no conflict of interest.


