


1 Introduction
The spontaneous spreading of thin films is relevant to a variety of industrial and natural processes (Craster & Matar Reference Craster and Matar2009). Commercial interest in spreading films include thin-film evaporators (Ludviksson & Lightfoot Reference Ludviksson and Lightfoot1971), foam stabilization and coating flows (Heidari et al. Reference Heidari, Braun, Hirsa, Snow and Naire2002), the fabrication of conducting polymer films (D’Arcy et al. Reference D’Arcy, Tran, Tung, Tucker-Schwartz, Wong, Yang and Kaner2010), self-assembled monolayers for the creation of photonic crystals and chemical sensors (Mayya & Sastry Reference Mayya and Sastry1999; Binks et al. Reference Binks, Clint, Fletcher, Lees and Taylor2006; Zhang et al. Reference Zhang, Wang, Chao, Velankar and Asher2013) and tertiary oil recovery (Luo et al. Reference Luo, Wang, Zhu, Cao, Liu, Li, Willson, Yang, Chu and Ren2016). In natural processes, the airways of the human lung are coated with a thin liquid layer, which contains pulmonary surfactants to keep alveoli from collapsing (Halpern & Grotberg Reference Halpern and Grotberg1992; Grotberg Reference Grotberg1994). In particular, pulmonary surfactant deficiency is the cause of neonatal respiratory distress syndrome where surfactant replacement therapies – the spreading of pulmonary surfactant across a thin liquid layer – help open closed alveoli by reducing the surface tension, which sets the degree of resistance for the alveoli to expand (Filoche, Tai & Grotberg Reference Filoche, Tai and Grotberg2015). Also, ocular surfaces are coated by a thin liquid layer (e.g. the tear film), as the Meibomian gland secretes polar lipids that lower the surface tension of the aqueous phase, promoting spreading across the eye between blinks. For example, an unstable tear film is commonly the cause of dry eyes in humans (Sweeney, Millar & Raju Reference Sweeney, Millar and Raju2013; Cwiklik Reference Cwiklik2016) and it has been suggested that the interfacial rheology of the Meibomian lipids may play a pivotal role in stabilizing the drainage of tear films (Bhamla et al. Reference Bhamla, Giacomin, Balemans and Fuller2014).
A shared attribute of studies investigating the spontaneous spreading of thin films lies in the minimization of excess surface energy in the presence of a surface tension gradient. In particular, the well-known Marangoni effect may be harnessed to allow for films to climb upwards against gravity. For example, the Marangoni effect describes the dynamics of wine tears (Thomson Reference Thomson1855) as well as how biofilms scale walls (Angelini et al. Reference Angelini, Roper, Kolter, Weitz and Brenner2009). Also, vertically climbing films have been studied on heated substrates; e.g. it was shown that films climbed on a dry (or a micrometre-thick liquid layer wetted) substrate against gravity (Ludviksson & Lightfoot Reference Ludviksson and Lightfoot1971; Cazabat et al. Reference Cazabat, Heslot, Troian and Carles1990, Reference Cazabat, Heslot, Carles and Troian1992; Kataoka & Troian Reference Kataoka and Troian1998; Schneemilch & Cazabat Reference Schneemilch and Cazabat2000): the front of the films advanced as a linear function of time, which was explained by assuming that a Marangoni stress-driven motion acted upwards balanced by gravity. On the other hand, if gravity may be neglected, the Marangoni stress balances the viscous stress in the film to produce a time ( $t$) variation of spreading that scales as $t^{1/2}$ (He & Ketterson Reference He and Ketterson1995), which is consistent with the Marangoni spreading on a horizontal strip (Jensen & Grotberg Reference Jensen and Grotberg1992, Reference Jensen and Grotberg1993). While there are many studies across a wide range of fields that describe a film climbing phenomenon (Fanton, Cazabat & Quéré Reference Fanton, Cazabat and Quéré1996; Münch & Bertozzi Reference Münch and Bertozzi1999; Johnson et al. Reference Johnson, Kang, Vigorita, Amram and Spain2008; Daripa & Paşa Reference Daripa and Paşa2009; Fletcher & Holt Reference Fletcher and Holt2011), the interplay of surface tension, viscous effects and gravity remains an open question: to the best of our knowledge, we are not aware of previous experimental studies of Marangoni spreading on a vertically draining pre-wetted film, and we show that the drainage of the pre-wetted film, where the thickness changes in time, affects the spreading.
Herein we show experiments of a film climbing over a pre-wetted film where the draining and climbing film thicknesses have the same order of magnitude. The climbing film can be tuned by the surfactant concentration, as well as the initial pre-wetted film thickness that is set by the gravitational drainage and drainage time. Particle tracking velocimetry (PTV) is performed to track the flow reversal from drainage to climbing and confirms the dynamics of the film climbing. A high-speed interferometric set-up is used to track the changes in the draining film thickness, and tracks the climbing film position and thickness. Increasing the surfactant concentration in the bath leads to a thicker film and faster film climbing. As for the pre-wetted film thickness, when the surfactant concentration is relatively high, a thicker pre-wetted film leads to faster film climbing, which is a result of the reduced viscous resistance while Marangoni driving dominates. In contrast, when the surfactant concentration is relatively low, a thicker pre-wetted film leads to slower film climbing, which is a result of the increased gravity-induced drainage while Marangoni driving competes with gravitational drainage. We describe the effects of the surfactant concentration and the pre-wetted film thickness as a competition among the Marangoni driving, gravitational drainage and viscous resistance. A dimensionless ratio is then identified to analyse the competition between Marangoni driving and gravitational drainage. Finally, we develop a model, the climbing front motion is analysed, and the effects on the surfactant and the pre-wetted film observed in the experiments are explained.
2 Experiments

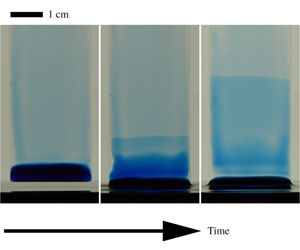
Figure 1. Demonstration of the climbing film as well as the experimental set-up. (a) Film climbing after a glass slide with a pre-wetted water film is inserted into a bath of SDS solution. The pre-wetted water film forms by injecting dyed water at the top of the glass slide, which then drains due to gravity for approximately  $10~\text{s}$. The pre-wetted film contacts the bath ( $1\times 10^{-3}~\text{M}$ SDS) at $t=0~\text{s}$, and then a climbing film (illustrated with dye as the darker blue on the substrate) rises from the bottom to the top of the pre-wetted film. (b) A sketch of interferometry experiments. The pre-wetted water film forms by injecting deionized water onto the glass slide, which then drains by gravity for a drainage time interval $\unicode[STIX]{x1D70F}_{0}$, and then contacts a bath of SDS solution with concentration $c_{0}$. The bath is translated by a motorized linear stage. A He–Ne laser light passes through a beam expander and a beam splitter, and then illuminates the water film on the glass slide. The film thickness profile is measured via the interferometric pattern formed by the two reflected laser lights on the air–water and the glass–air interfaces.
Microscope glass slides ( $25~\text{mm}\times 75~\text{mm}$) were used as the substrates for the pre-wetted film, and were oriented vertically (i.e. along gravity) in all of the experiments. Usually, water has a tendency to dewet on the glass slide. To reduce the effect of water dewetting, a four-step ultrasonic cleaning was applied: the glass slides were successively immersed in surfactant solution, deionized water, alcohol and acetone, and were ultrasonically cleaned for 15 min in each liquid ( $42~\text{kHz}$, Cole-Parmer) and then dried with an air gun. This cleaning ensured a reduced effect of water dewetting on the glass substrate, which will also be discussed in § 3.2. To obtain a pre-wetted water film, approximately $3~\text{ml}$ of deionized water was injected onto the glass substrate, while the position where the water jet contacted the substrate was fixed. Next, the water film was left to drain freely by gravity, for a controlled time period $\unicode[STIX]{x1D70F}_{0}$, and then contacted a bath of water–surfactant solution (approximately $50~\text{ml}$ liquid in a Petri dish with inner diameter $57~\text{mm}$); see figure 1. Sodium dodecyl sulfate (SDS, from Sigma-Aldrich) was used as the surfactant in the experiments and the concentration of the water–SDS solution, denoted as $c_{0}$, varied from $3\times 10^{-5}~\text{M}$ to $1\times 10^{-2}~\text{M}$. The critical micelle concentration of SDS in water is $(7{-}10)\times 10^{-3}~\text{M}$, and the ambient temperature in the experiments was $22{-}24\,^{\circ }\text{C}$. Methylene blue hydrate ( $0.1~\text{wt}\%$, Sigma-Aldrich) was added to the solution to visualize the change of the film thickness on the substrate (figure 1a). Note that dye was only used in the demonstration experiment in figure 1(a), not in the other experiments in this article, since the dye may change the surface tension by reacting with the surfactant (Jin et al. Reference Jin, Jiang, Shan, Pei and Chen2008).
When a pre-wetted water film contacts a water–SDS bath ( $c_{0}=1\times 10^{-3}~\text{M}$ in figure 1a), a layer of liquid rises from the bath along the pre-wetted film against gravity (see also supplementary movie 1, available at https://doi.org/10.1017/jfm.2019.1071). A sharp rising interface between the pre-wetted film and the climbing film is illustrated by the blue dye added to the liquid (figure 1a). We label this sharp horizontal rising interface as the ‘climbing front’, which characterizes the leading edge of the rising liquid film as demonstrated in figure 1(a). Climbing starts from the contact of the pre-wetted glass slide with the SDS solution bath ( $t=0~\text{s}$), and the front rises continuously due to the surface tension difference between the pre-wetted film and the bath, until the front reaches the top of the glass slide ( $t=0.83~\text{s}$). The flow from the bottom to the top of the pre-wetted film occurs at a speed of the order of a centimetre per second, and the climbing front rises faster at early times than later times (in the first $0.03~\text{s}$ the climbing front moves a comparable distance as in the final $0.5~\text{s}$). Also, the edge of the climbing front remains nearly horizontal at all times. The film below the climbing front is darker (lower light intensity) than the film above, indicating that the film below contains more dye; thus the thickness of the film below is thicker than above (figure 1a). Note that the liquid near the two sides of the glass slide is darker (figure 1a), which indicates that the film thickness near the sides is thicker than that in the middle of the substrate. A discussion of this film thickness difference on the side of the substrate is provided in appendix A. In our experiments, we focus on the region in the middle of the glass substrate, where the effect of the sides of the substrate is negligible.
To denote the time in the experiments, two different notations  $\unicode[STIX]{x1D70F}$ and $t$ are used throughout this article: $\unicode[STIX]{x1D70F}$ denotes the drainage time of the pre-wetted film, and at $\unicode[STIX]{x1D70F}=0$ the injection of water on the pre-wetted film ends; $t$ denotes the time that the film climbs, and at $t=0$ the bath contacts the pre-wetted film and a layer of liquid starts to rise. The drainage time interval $\unicode[STIX]{x1D70F}_{0}$ denotes the time interval from $\unicode[STIX]{x1D70F}=0$ to $t=0$, i.e. the time interval from the end of the water injection ( $\unicode[STIX]{x1D70F}=0$) to the contact of the glass slide with the bath $t=0$ is denoted as the drainage time. Hence $\unicode[STIX]{x1D70F}=t+\unicode[STIX]{x1D70F}_{0}$.
In this article, we focus on the position of the climbing front as well as the film thickness profile. For more systematic control and better image quality, rather than inserting a glass slide into a bath, the bath was translated by a motorized linear stage (Thorlabs) and then contacted the glass slide (fixed by a clamp). The motorized stage translated with a constant velocity of  $2~\text{mm}~\text{s}^{-1}$ and stopped as soon as the bath contacted the pre-wetted film on the fixed glass slide. Note that the motorized stage was used in all of the experiments reported in this article, with the exception of the demonstration in figure 1(a).
Interferometric measurements were performed to estimate the climbing front position and the film thickness profile. A sketch of the interferometric set-up is displayed in figure 1(b). Similar to the previous experiments, the glass slide was fixed vertically by a clamp. The pre-wetted water film was formed  $60~\text{mm}$ above the bottom of the glass slide, and then left to drain by gravity for a controlled time $\unicode[STIX]{x1D70F}_{0}$, after which the glass slide contacted the bath with SDS solution. A He–Ne laser ( $18~\text{mW}$ power, wavelength $\unicode[STIX]{x1D706}=633~\text{nm}$, Thorlabs) was used in the interferometric measurements. The laser beam passed through a beam expander and a beam splitter, and then illuminated the liquid film on the glass substrate. When passing through the film, the light reflected from both the air–water interface and the glass–air interface, and these two reflected beams were collected by a high-speed camera (after reflecting from the beam splitter) and a pattern of constructive and destructive interference of light was displayed as bright and dark fringes. Characteristic interferometric patterns are displayed later in figures 4(a–d), 5(a–d), 7(a–d) and 10, which are similar to the interferometric patterns of the climbing films reported in Cazabat et al. (Reference Cazabat, Heslot, Carles and Troian1992) and Schneemilch & Cazabat (Reference Schneemilch and Cazabat2000). These interferometric patterns contain information regarding the film thickness, i.e. the film thickness difference between two neighbouring fringes is $\unicode[STIX]{x1D706}/(2n)$, where $n=1.33$ is the refractive index of water, and thus can be processed to reconstruct the climbing front position as well as the film thickness profile. Note that the interferometric patterns show the optical path difference in the water film, and the wavelength of the laser light in water should be divided by the refractive index $n$. In the interferometric experiments, there is also reflective light from the water–glass interface, which is between the air–water and the glass–air interfaces, and the intensity of this reflective light is much smaller (the fraction of the incident intensity that is reflected from the interface is $R=0.02$, $0.004$ and 0.041 for air–water, water–glass and glass–air interfaces, respectively). Therefore, information about the thickness of the glass substrate is also collected in the interferometric images, but the variation of the thickness of the glass substrate is much smaller than that of the liquid film, and thus is negligible in the measurements.
3 Results and discussion
3.1 Particle tracking velocimetry

Figure 2. Particle tracking velocimetry to obtain the mean velocity of the tracked particles  $v$ at the centre of the film as a function of time $\unicode[STIX]{x1D70F}$ ( $v$ is positive when along gravity). The three images show the tracked particles, while the fields of view are at the centre of the pre-wetted film and are cropped for display. The mean velocity $v$ is calculated by averaging the tracked particle velocities across the field of view, which is $30~\text{mm}$ below the top of the film. Water with $6~\unicode[STIX]{x03BC}\text{m}$ diameter PMMA particles is injected onto the glass slide to form a pre-wetted film. The fluid injection stops at $\unicode[STIX]{x1D70F}=0$. The pre-wetted film then drains by gravity ( $\unicode[STIX]{x1D70F}\lesssim 11.5~\text{s}$), and the particles move downwards following the drainage, so that $v>0$ but decreases with time as the film thins. The mean velocity decreases dramatically while the climbing front passes the field of view ( $11.5~\text{s}\lesssim \unicode[STIX]{x1D70F}\lesssim 13~\text{s}$), and the particles near the air–water interface reverse direction and move upwards against gravity, following the climbing film (the SDS concentration in the bath $c_{0}=1\times 10^{-3}~\text{M}$). The mean velocity then becomes negative, indicating that the mean fluid velocity along the film reverses and turns upwards, against the direction of gravity. After encountering the climbing front ( $\unicode[STIX]{x1D70F}\gtrsim 13~\text{s}$), the particles near the interface continuously rise.
To quantify the flow details in both the pre-wetted film and the climbing film, PTV was performed, where the processed data are shown in figure 2. Spherical poly(methyl methacrylate) (PMMA) particles (from Microbeads AS), diameter  $d=6~\unicode[STIX]{x03BC}\text{m}$, were added to deionized water. Note that the diameter of the PMMA particles, which were used to track the fluid velocity in thick films, is usually much smaller than the film thickness (up to around 20 times smaller). For the situation that the film thickness is of the same order of magnitude as the particle diameter, the particles would cease to trace the local flow and may even adhere to the substrate and remain stationary. Also, the sedimentation velocity of the PMMA particles in water, as estimated by $\unicode[STIX]{x0394}\unicode[STIX]{x1D70C}gd^{2}/18\unicode[STIX]{x1D707}$, where $\unicode[STIX]{x0394}\unicode[STIX]{x1D70C}\approx 2\times 10^{2}~\text{kg}~\text{m}^{-3}$ is the density difference between PMMA particles and water, $g$ is gravitational acceleration and $\unicode[STIX]{x1D707}$ is the dynamic viscosity of water, is approximately $4~\unicode[STIX]{x03BC}\text{m}~\text{s}^{-1}$ and thus is negligible relative to the draining and climbing speeds, which are of the order of a millimetre per second. The water with PMMA particles was injected onto a glass slide to form a pre-wetted film, and the top of the film was set $60~\text{mm}$ above the bottom of the glass slide, as sketched in figure 1(b). The glass slide with the film was placed between a high-speed camera and a light-emitting diode light panel. The centre of the pre-wetted film, which was $30~\text{mm}$ below the top of the film, was recorded at 100 frames per second with a field of view of $2.3~\text{mm}\times 2.3~\text{mm}$ (see the PTV movie in supplementary movie 2).
The PMMA particles in the field of view are tracked and velocities are thus measured, using a modified code, which was originally developed by Blair & Dufresne (Reference Blair and Dufresne2008). Note that the tracked particles in the film may be either near the air–liquid interface or near the glass substrate; thus the tracked particle velocity depends on the position in the film. Whether the particles are near the air–liquid interface or the substrate can be determined qualitatively by the degree to which they are in focus or out of focus in the image. Typically, hundreds of particles across all of the entire thickness of the film are tracked in the field of view, and the mean velocity of the particles,  $v$, is calculated by averaging the velocities of the tracked particles. Hence, assuming that averaging the velocity of the particles is equivalent to the average of the velocity across the full thickness of the film, $v$ represents the mean flow in the film and changes with $\unicode[STIX]{x1D70F}$ during the film climbing (figure 2, $v$ is positive along the direction of gravity). In figure 2, the drainage time interval is $\unicode[STIX]{x1D70F}_{0}\approx 10~\text{s}$, which is the time interval from the end of the water injection ( $\unicode[STIX]{x1D70F}=0$) to the contact of the glass slide with the bath ( $t=0$).
Before the bath contacts the glass slide, the pre-wetted film on the glass slide drains freely. The particles move downwards following the gravitational film drainage (figure 2,  $\unicode[STIX]{x1D70F}\lesssim 11.5~\text{s}$); $v$ decreases with $\unicode[STIX]{x1D70F}$, on account of the pre-wetted film thickness decreasing due to drainage. As the bath, which contains $1\times 10^{-3}~\text{M}$ SDS solution, contacts the glass slide, a liquid film rises upwards along the pre-wetted film. The climbing front then passes through the field of view (centre of the pre-wetted film) where the velocities of the particles are significantly decreased (figure 2, $11.5~\text{s}\lesssim \unicode[STIX]{x1D70F}\lesssim 13~\text{s}$). The particles near the air–liquid interface move upwards, following the climbing film, while the particles near the glass substrate move downwards, following the gravitational drainage. As more particles follow the climbing film, the mean velocity of the particles decreases and becomes negative, indicating that the mean fluid velocity reverses and opposes gravity. After encountering the climbing front and even after the climbing front reaches the top of the pre-wetted film, the particles near the air–liquid interface rise continuously, with a higher magnitude of velocity than the particles near the substrate, which move downwards following the drainage (figure 2, $\unicode[STIX]{x1D70F}\gtrsim 13~\text{s}$), since at this time the Marangoni stress is stronger than the gravitational drainage. The details of the rising and falling flows depend on parameters such as the film thickness and the surface tension difference between the pre-wetted film and the bath. The effects of the surfactant and the pre-wetted film on the climbing film will be the focus of the next sections.
3.2 Interferometry: drainage

Figure 3. The pre-wetted film on the vertical substrate during the drainage. (a) A schematic of the pre-wetted film during drainage. The glass slide is fixed vertically as a substrate, and approximately  $3~\text{ml}$ deionized water is injected onto the glass slide ( $60~\text{mm}$ above the bottom of the slide) to form a pre-wetted film. The film thickness at the centre ( $L_{0}=30~\text{mm}$) of the film is measured by interferometry. (b) The film thickness at the centre of the pre-wetted film $h_{0}$ during the drainage, as a function of the drainage time $\unicode[STIX]{x1D70F}$. The black solid line denotes our experimental measurements and the blue dashed line denotes Jeffreys’ similarity solution $h_{0}(\unicode[STIX]{x1D70F})=(\unicode[STIX]{x1D707}L_{0}/\unicode[STIX]{x1D70C}g\unicode[STIX]{x1D70F})^{1/2}$, equation (3.1). The value $\unicode[STIX]{x1D70F}=0$ denotes the time that the injection ends. The error bars correspond to standard deviations at $\unicode[STIX]{x1D70F}=5,~10,~20$ and $40~\text{s}$ (experiments repeated four times), which are typical values of drainage time interval $\unicode[STIX]{x1D70F}_{0}$ for the later controlled experiments. The inset shows a plot of $h_{0}(\unicode[STIX]{x1D70F})$ with logarithmic axes.
The shape of the pre-wetted film that contacts the bath is set by gravitational drainage. The draining of a thin liquid film on a vertical plate was first systematically analysed by Jeffreys (Reference Jeffreys1930), who considered a fixed contact line. Applying the lubrication approximation, and balancing the gravitational force on the liquid and the viscous force, a similarity solution for the wetted film thickness was found as
 $$\begin{eqnarray}h=(\unicode[STIX]{x1D707}\ell /\unicode[STIX]{x1D70C}g\unicode[STIX]{x1D70F})^{1/2},\end{eqnarray}$$
 where  $h$ denotes the wetted film thickness, $\ell$ the vertical distance to the top (i.e. to the pinned contact line) of the film (figure 3a) and $\unicode[STIX]{x1D70C}$ the density of the fluid.
In our experiments, interferometry is performed to measure the film thickness  $h_{0}$ at the centre of the pre-wetted film; see figure 3(b). The injection terminates at $\unicode[STIX]{x1D70F}=0$, and then the interferometric pattern at the centre of the draining film is recorded by a high-speed camera (150 frames per second in this set of experiments). The thickness $h_{0}$ is then estimated by measuring the number of fringes that pass the centre, as a function of the drainage time $\unicode[STIX]{x1D70F}$, marked as the black solid line in figure 3(b). The inset in figure 3(b) shows a comparison (using a log–log plot) between Jeffreys’ similarity solution and our experimental measurements of $h_{0}$. The blue dashed line in figure 3(b) refers to $h_{0}=(\unicode[STIX]{x1D707}L_{0}/\unicode[STIX]{x1D70C}g\unicode[STIX]{x1D70F})^{1/2}$ predicted by (3.1), where we have used $\unicode[STIX]{x1D707}=1\times 10^{-3}~\text{Pa}~\text{s}$, $\unicode[STIX]{x1D70C}=1\times 10^{3}~\text{kg}~\text{m}^{-3}$, $g=9.8~\text{m}~\text{s}^{-2}$ and the distance from the centre to the top of the film $L_{0}=30~\text{mm}$.
For the drainage time  $\unicode[STIX]{x1D70F}\lesssim 20~\text{s}$ in figure 3, our experiments agree with Jeffreys’ (Reference Jeffreys1930) similarity solution, indicating $h_{0}\propto \unicode[STIX]{x1D70F}^{-1/2}$ during early drainage. However, at later times ( $\unicode[STIX]{x1D70F}\gtrsim 40~\text{s}$), our results deviate from the Jeffreys’ solution and we attribute this difference to the observed contact line depinning on the top of the film: the contact line on the top of the film slips downwards slowly with a speed of approximately $0.3~\text{mm}~\text{s}^{-1}$ (it takes around 100 s for the contact line to slip from the initial injection position ( $\ell =0~\text{mm}$) to the field of view at the middle of the substrate ( $\ell =30~\text{mm}$)). The effect of the dewetting appears when the drainage time $\unicode[STIX]{x1D70F}$ is comparable to the dewetting time (100 s). At later times ( $\unicode[STIX]{x1D70F}\gtrsim 40~\text{s}$), the decrease of the measured film thickness is affected by both gravitational drainage as well as film dewetting, and therefore the experimental values for $h_{0}$ decrease faster than the prediction of Jeffreys’ solution. Note that most of the experiments throughout this article are in the regime in which the dewetting effect is less significant ( $\unicode[STIX]{x1D70F}\lesssim 20~\text{s}$), and the film climbing speed is typically much faster than this downward dewetting speed.
One implication from our interferometric measurements is that the thickness of the pre-wetted film can be tuned by the drainage time  $\unicode[STIX]{x1D70F}$. In our subsequent experiments, in order to study the effect of the pre-wetted film thickness on the climbing film, four thicknesses are formed by controlling the drainage time interval $\unicode[STIX]{x1D70F}_{0}=5,~10,~20$ and $40~\text{s}$, respectively, i.e. we tune the drainage time interval $\unicode[STIX]{x1D70F}_{0}$, the time interval from the termination of water injection to the contact of the pre-wetted film with the bath, to achieve different initial pre-wetted film profiles. The resulting centre film thicknesses are $h_{0}=26.2\pm 0.8,~18.2\pm 0.9,~11.9\pm 0.5$ and $6.4\pm 0.3~\unicode[STIX]{x03BC}\text{m}$, respectively (experiments are repeated four times). For results presented below, $h_{0}$ represents the initial pre-wetted film thickness.
3.3 Interferometry: climbing front position

Figure 4. Interferometric measurements of the position of the climbing front with high SDS concentrations ( $c_{0}\geqslant 1\times 10^{-3}~\text{M}$) in the bath. (a–d) A time series of the interferometric patterns (images on the right) and the processed image signal (plots on the left), as the climbing film front rises from a bath with $3\times 10^{-3}~\text{M}$ SDS. The intensity change $I^{\prime \prime }$ ( $1/\text{pixel}^{2}$) is calculated by vertically taking the second forward difference of the normalized grey value (averaged horizontally) of the interferometric image, and is plotted as a function of vertical position $z$, which is the distance to the liquid level of the bath. The red dashed line denotes the climbing front position, labelled as the position that maximizes $I^{\prime \prime }$. (e) A schematic of a film climbing on the pre-wetted layer; $z_{f}$ denotes the distance from the climbing film front to the level of the bath. (f) The climbing front position $z_{f}$ as a function of time $t$, for baths of $1\times 10^{-2}$ (black circles), $3\times 10^{-3}$ (blue squares) and $1\times 10^{-3}~\text{M}$ (red triangles) SDS solution; $t=0$ denotes the contact of the bath with the pre-wetted film. The data points that refer to the interferometric patterns in (a–d) are marked. The error bars correspond to averaged standard deviations (the average values of the standard deviations among experiments with the same SDS concentration) from three experiments.
Typical results from the interferometric measurements for the climbing front position, in experiments with high SDS concentrations ( $c_{0}\geqslant 1\times 10^{-3}~\text{M}$) in the bath, are shown in figure 4. At $t=0$, the bath contacts the pre-wetted film and a film front starts to rise. The appearance of the climbing film changes the total film thickness, and thus the interferometric pattern changes, as recorded by a high-speed camera. Figure 4(a–d) shows a characteristic interferometric image sequence of the climbing front (see the interferometric movie of the climbing front in supplementary movie 3). A schematic of the climbing film on the pre-wetted layer is displayed in figure 4(e). Above the climbing front (the area far above the red dashed lines in figure 4a–d) is the draining pre-wetted film, undisturbed by the climbing film. The fringes on the pre-wetted film are relatively wide, indicating that the slope of the film thickness is low, and is consistent with our measurements on the draining film thickness as well as the Jeffreys’ solution. Near the climbing front (close to the red dashed lines in figure 4a–d), the fringes become much narrower, indicating a more rapid change of film thickness. The climbing film induces a sharp gradient on the overall film thickness so that the narrow fringes exceed the resolution of the images in figure 4. Below the climbing front (below the red dashed lines in figure 4a–d), the film thickness still changes rapidly, while the fringes are much narrower than those in the freely draining film. The shape of the climbing film is flat at some points, indicating that the film thickness reaches a local maximum or minimum. Detailed measurements of the film thickness with higher resolution will be reported in § 3.4.
There is a meniscus that connects the thin film on the substrate and the liquid in the bath; see the dark region on the bottom of the glass slide in figures 1(a) and 10(b) in appendix A. The height and thickness of the meniscus are typically of the order of the capillary length  $\ell _{c}=\sqrt{\unicode[STIX]{x1D6FE}/\unicode[STIX]{x1D70C}g}\approx 3~\text{mm}$. Hence, the thickness of the meniscus is much larger than the thin film (order of $100~\unicode[STIX]{x03BC}\text{m}$) on the substrate and thus the meniscus contains much more fluid. Also, according to the experiments, the shape and the position of the meniscus remain approximately unchanged. Therefore, the meniscus can be considered as a part of the liquid in the bath, and we hereby denote the top of the meniscus as the bottom of the thin film, i.e. $z=0$ (figure 4e). Note that the schematic in figure 4(e) amplifies the film thickness on the substrate and in reality the thin-film thickness is much smaller than the meniscus thickness.
In order to robustly mark the climbing fronts in the interferometric images, the following image processing is performed. We first extract the image signal in an interferometric image by cropping a vertical stripe ( $5~\text{pixel}\times 686~\text{pixel}$, where $1~\text{pixel}\approx 19~\unicode[STIX]{x03BC}\text{m}$) in the middle of the image. The normalized grey value $I$ (as a function of $z$, the distance to the level of the bath) is calculated by taking the average of the grey values horizontally along the strip (i.e. the mean value across the five horizontal pixels) and then normalizing (dividing by 255). The light intensity along the glass slide is indicated by $I(z)$, so that high light intensity $I$ refers to bright fringes and low intensity refers to dark fringes. Then $I^{\prime }\approx \text{d}I/\text{d}z$ ( $1/\text{pixel}$) is calculated by taking the first forward difference of $I(z)$. The peaks in $I^{\prime }$ refer to the boundaries of the fringes on the image.
In order to estimate the position of the climbing front where the film thickness changes sharply and the fringes become narrower,  $I^{\prime \prime }\approx \text{d}^{2}I/\text{d}z^{2}$ ( $1/\text{pixel}^{2}$) is calculated by taking the second forward difference of $I(z)$; see the plots on the left in figure 4(a–d). The $I^{\prime \prime }$ value increases as the fringes get narrower, and we find that the peak of $I^{\prime \prime }$ robustly marks the front of the climbing film. The red dashed lines in figure 4(a–d) mark the peaks of $I^{\prime \prime }$, and also capture the position in the image where the fringes narrow rapidly, indicating that the film thickness increases sharply due to the climbing film.
In addition to the climbing film front (marked with red dashed lines in figure 4a–d), large values and local peaks of  $I^{\prime \prime }$ are observed below the climbing film front, which indicate that, in addition to the front of the climbing film, there are other sharp slopes of the film thickness on the climbing film. Moreover, wide fringes and circles are also observed in the interferometric images (for example, in figure 4d), which indicate that the film thickness reaches a local maximum (peak) or minimum (valley). Local peaks of $I^{\prime \prime }$ are found near the wide fringes and circles, which means the film thickness increases or decreases sharply behind and after the local peak or valley of the film. The detailed thickness profile of the climbing film is complex (see the schematic in figure 4e) and is an interesting problem for further investigation. In this article, we focus on the position of the climbing film front rather than the detailed thickness profile during the Marangoni climbing.
At  $t=0~\text{s}$, the bath with SDS solution ( $c_{0}=3\times 10^{-3}~\text{M}$ in figure 4a–d) contacts the pre-wetted film and the liquid from the bath starts to rise. The film rises rapidly and the front position of the climbing film $z_{f}(t)$ approaches $9.6~\text{mm}$ within $40~\text{ms}$ (figure 4f). The data in figure 4(f) also indicate that the velocity of the climbing front continuously decreases. The climbing front reaches the top of the field of view ( $z_{f}\approx 20~\text{mm}$) at $t=250~\text{ms}$.
To study the effect of the SDS concentration in the bath  $c_{0}$, interferometry experiments are performed with different $c_{0}$ and the climbing front positions $z_{f}$ are measured. The drainage time interval is controlled uniformly as $\unicode[STIX]{x1D70F}_{0}=10~\text{s}$, so that the pre-wetted films in this set of experiments are approximately the same. The climbing front position $z_{f}$ as a function of time $t$ is shown in figure 4(f) for bath SDS concentrations $c_{0}=1\times 10^{-2}$ (black circles), $3\times 10^{-3}$ (blue squares) and $1\times 10^{-3}~\text{M}$ (red triangles), respectively. The data for $c_{0}=1\times 10^{-2}~\text{M}$ show a similar trend as $c_{0}=3\times 10^{-3}~\text{M}$, while the rise speed continuously decreases during the ascent. It is intuitive that the front rises faster with higher SDS concentration $c_{0}$ (the climbing front reaches the top of the field of view ( $z_{f}\approx 20~\text{mm}$) by $0.1~\text{s}$ with $c_{0}=1\times 10^{-2}~\text{M}$ and by $0.25~\text{s}$ with $c_{0}=3\times 10^{-3}~\text{M}$, figure 4f), since the surface tension in the bath decreases more with higher surfactant concentration. As for $c_{0}=1\times 10^{-3}~\text{M}$, the climbing front rises more than 10 times slower than that with $c_{0}=3\times 10^{-3}~\text{M}$, taking $3~\text{s}$ to reach the top of the field of view. This slow rate (approximately $5~\text{mm}~\text{s}^{-1}$) of rise is due to the effect of gravitational drainage as the Marangoni stress weakens.

Figure 5. Interferometric measurements of the position of the climbing front with low SDS concentrations ( $c_{0}\leqslant 1\times 10^{-3}~\text{M}$) in the bath. (a–d) A time series of the interferometric patterns (images on the right) and the processed image signal (plots on the left), as the climbing film front rises from a bath with $3\times 10^{-4}~\text{M}$ SDS. The intensity change $I^{\prime \prime }$ ( $1/\text{pixel}^{2}$) is calculated by vertically taking the second forward difference of the normalized grey value (averaged horizontally) of the interferometric image, and is plotted as a function of vertical position $z$, which is the distance to the liquid level of the bath. The red dashed line denotes the climbing front position, labelled as the position that maximizes $I^{\prime \prime }$. (e) The climbing front position $z_{f}$ as a function of time $t$, for baths of $1\times 10^{-3}$ (black circles), $3\times 10^{-4}$ (blue squares), $1\times 10^{-4}$ (red upward-pointing triangles) and $3\times 10^{-5}~\text{M}$ (magenta downward-pointing triangles) SDS solution; $t=0$ denotes the contact of the bath with the pre-wetted film. The data points that refer to the interferometric patterns in (a–d) are marked. The error bars correspond to averaged standard deviations (the average values of the standard deviations among experiments with the same SDS concentration) from three experiments.
The trend of the climbing front position  $z_{f}(t)$ differs when the SDS concentration in the bath is low, e.g. less than $1\times 10^{-3}~\text{M}$. Figure 5 shows the interferometric measurements on the front position $z_{f}$ with low SDS concentrations in the bath, for $c_{0}=1\times 10^{-3}$ (black circles), $3\times 10^{-4}$ (blue squares), $1\times 10^{-4}$ (red upward-pointing triangles) and $3\times 10^{-5}~\text{M}$ (magenta downward-pointing triangles), respectively. The speed of the climbing film is much slower with low SDS concentrations in the bath (compare the data in figures 4 and 5). For example, the climbing front with $c_{0}=3\times 10^{-4}~\text{M}$ rises more than 10 times slower than that of $c_{0}=1\times 10^{-3}~\text{M}$, while the surface tension difference is only approximately three times smaller. Also, after early times ( $t\gtrsim 2~\text{s}$ for $c_{0}=3\times 10^{-4},~1\times 10^{-4}$ and $3\times 10^{-5}~\text{M}$), the rise speed remains approximately constant, i.e. the climbing front position $z_{f}$ is linear with time $t$ for almost the entire experiment. It is also worth noting that for $c_{0}=3\times 10^{-4}~\text{M}$, the film front rises much faster at early times ( $t\lesssim 2~\text{s}$, figure 5a,b) than at late times ( $t\gtrsim 2~\text{s}$, figure 5c,d) (see the interferometric movie of the climbing front from the bath with $3\times 10^{-4}~\text{M}$ SDS solution (figure 5a–d) in supplementary movie 4). Gravitational drainage of the climbing film is also observed in figure 5(c,d), which indicates that, for low bath SDS concentration $c_{0}$, the climbing film is affected by gravitational drainage at late times ( $t\gtrsim 2~\text{s}$). In general, the climbing film front at lower concentration ( $c_{0}\leqslant 1\times 10^{-3}~\text{M}$) rises much slower due to the low surface tension difference and enhanced gravitational drainage. The effect of both the surface tension difference and the gravitational drainage will be discussed in more detail in the discussion, § 3.5. Note that the temperature variation (e.g. from evaporation) or random contamination (e.g. from dust in the ambient air) in the liquid may affect the dynamics of the film climbing in the experiments for low SDS concentration $c_{0}\lesssim 1\times 10^{-4}~\text{M}$. The surface tension of water decreases approximately $0.1~\text{mN}~\text{m}^{-1}$ by increasing the temperature by $1\,^{\circ }\text{C}$, but adding SDS surfactant with concentration $c_{0}=3\times 10^{-4}~\text{M}$ into water leads to a decrease of surface tension of $2.4~\text{mN}~\text{m}^{-1}\gg 0.1~\text{mN}~\text{m}^{-1}$. Therefore, the effect of the temperature variation is negligible for the majority of our experiments ( $c_{0}\gtrsim 3\times 10^{-4}~\text{M}$).

Figure 6. The effect of the pre-wetted film thickness  $h_{0}$ on the film climbing front position $z_{f}(t)$, with (a) high ( $c_{0}=3\times 10^{-3}~\text{M}$) and (b) low ( $c_{0}=3\times 10^{-4}~\text{M}$) SDS concentrations in the bath. The pre-wetted film thicknesses are tuned by setting the drainage time interval $\unicode[STIX]{x1D70F}_{0}=5$, $10$,
$10$,  $20$ and $40~\text{s}$, and the resulting pre-wetted film centre thicknesses $h_{0}=26$ (black circles), $18$ (blue squares), $12$ (red upward-pointing triangles) and $6~\unicode[STIX]{x03BC}\text{m}$ (magenta downward-pointing triangles), respectively. The error bars correspond to averaged standard deviations (the average value of the standard deviations of experiments with the same $h_{0}$) with three experiments.
We postulate that the pre-wetted film thickness may affect the climbing film. To study this effect, we tune the drainage time and the resulting pre-wetted film centre thicknesses (the film thickness  $30~\text{mm}$ below the top of the pre-wetted film) $h_{0}=26$, $18$,
$18$,  $12$ and $6~\unicode[STIX]{x03BC}\text{m}$, respectively. The effect of the pre-wetted film thickness on the film climbing front position $z_{f}(t)$ with high ( $c_{0}=3\times 10^{-3}~\text{M}$) and low ( $c_{0}=3\times 10^{-4}~\text{M}$) bath SDS concentrations is shown in figure 6(a) and (b), respectively.
For high concentration in the bath ( $c_{0}=3\times 10^{-3}~\text{M}$, figure 6a), the film front position $z_{f}$ for different $h_{0}$ shows a similar trend, and the speed of the climbing front increases as $h_{0}$ increases. For example, the speed approximately doubles as a result of increasing $h_{0}$ from $6~\unicode[STIX]{x03BC}\text{m}$ to $26~\unicode[STIX]{x03BC}\text{m}$. On the other hand, for low concentration in the bath ( $c_{0}=3\times 10^{-4}~\text{M}$, figure 6b), the speed of the climbing front decreases as $h_{0}$ increases, which is opposite to the trend for films with high surfactant concentration (figure 6a). In this case, as $h_{0}$ increases from $6~\unicode[STIX]{x03BC}\text{m}$ to $26~\unicode[STIX]{x03BC}\text{m}$, the rise speed is approximately halved. Also, the trend of the film front position $z_{f}$ as a function of time $t$ also differs for different film thickness (figure 6b): for example, for a thin-film thickness $h_{0}=6~\unicode[STIX]{x03BC}\text{m}$, at early times ( $t\lesssim 5~\text{s}$), the front first rises rapidly and the rise speed decreases continuously until the velocity remains approximately constant at $t\gtrsim 5~\text{s}$; for a larger film thickness $h_{0}=26~\unicode[STIX]{x03BC}\text{m}$, the climbing front rises with an approximately constant velocity throughout the measurement, and no ‘early-time’ speed decrease is observed.
For high surfactant concentration in the bath, the climbing speed decreases as the pre-wetted film thickness decreases. In contrast, at low surfactant concentration in the bath, the climbing speed increases as the pre-wetted film thickness decreases. We rationalize this effect as a consequence of the competition among the surface tension difference (Marangoni driving stress), viscous resistance and gravitational drainage. For high SDS concentration, Marangoni stress is strong and gravitational drainage is negligible. Then the Marangoni stress balances the viscous resistance, and hence a thicker pre-wetted film thickness results in less viscous resistance and therefore a higher rise speed. In contrast, for low SDS concentration, Marangoni stress is weak and balances gravitational drainage. As a result, a thicker pre-wetted film thickness results in more drainage, and therefore a slower rise speed. A detailed discussion and modeling will be presented in the discussion in § 3.5.
3.4 Interferometry: film thickness

Figure 7. Interferometric measurements on the film thickness profile while the film climbs, for SDS concentrations (a)  $c_{0}=3\times 10^{-4}~\text{M}$, (b) $1\times 10^{-3}~\text{M}$, (c) $3\times 10^{-3}~\text{M}$ and (d) $1\times 10^{-2}~\text{M}$. The interferometric pattern at the centre of the film is recorded and $\unicode[STIX]{x0394}t$ denotes the time interval from when the climbing front reaches the centre of the field of view (images on the left) to the top of the field of view (images on the right). The pre-wetted film profiles are expected to be approximately the same by setting the same drainage time interval $\unicode[STIX]{x1D70F}_{0}=10~\text{s}$; $h_{0}=18~\unicode[STIX]{x03BC}\text{m}$. (e) Schematic of the climbing film thickness profile. Here $z^{\ast }$ denotes the vertical distance (positive downwards) to the climbing front and $\unicode[STIX]{x0394}h$ the film thickness difference to the climbing front. (f) The film thickness difference $\unicode[STIX]{x0394}h$ as a function of $z^{\ast }$ when the climbing front reaches the top of the field of view (images on the right of (a–d)). (g) The film thickness difference $\unicode[STIX]{x0394}h$ at the fixed centre point of the film during the climbing of the film, as a function of time $t^{\ast }$. Here $t^{\ast }=0$ denotes the time when the climbing front passes the fixed point. The inset shows a zoomed-in view of early times $t^{\ast }\leqslant 0.2~\text{s}$. The SDS concentration in the bath is (a) $c_{0}=3\times 10^{-4}$ (magenta downward-pointing triangles), (b) $1\times 10^{-3}$ (red upward-pointing triangles), (c) $3\times 10^{-3}$ (blue squares) and (d) $1\times 10^{-2}~\text{M}$ (black circles), respectively.
In this section, we focus on measuring the local film thickness profile (near the climbing front) with increased resolution (smaller pixel size) in the interferometric set-up. Figure 7 shows the film thickness profile deduced using the interferometric technique for different SDS concentrations  $c_{0}=3\times 10^{-4}$, $1\times 10^{-3}$, $3\times 10^{-3}$ and $1\times 10^{-2}~\text{M}$ (figure 7a–d, respectively). Note that for $c\lesssim 1\times 10^{-4}~\text{M}$, the climbing film is slow and fails to rise into the field of view of this set-up. The interferometric images at the centre of the film ( $30~\text{mm}$ below the top and also $30~\text{mm}$ above the bottom of the pre-wetted film) are recorded by a high-speed camera. The frame rate is 1000 frames per second and the exposure time is $250~\unicode[STIX]{x03BC}\text{s}$. The field of view is $96~\text{pixel}\times 1200~\text{pixel}$ where $1~\text{pixel}\approx 1.7~\unicode[STIX]{x03BC}\text{m}$.
The interferometric images when the climbing front reaches the centre and the top of the field of view are displayed in figure 7(a–d), on the left and the right, respectively. Similar to the interferometric images measuring the climbing front position in § 3.3, the film above the climbing front is the draining pre-wetted film and the fringes are wide while the change of film thickness is slow. The fringes that are near and below the climbing front are narrower, since the film thickness changes sharply as the film rises. When the SDS concentration in the bath  $c_{0}$ increases, the Marangoni stress increases and the change of film thickness becomes more rapid. The film thickness difference $\unicode[STIX]{x0394}h$ along the film is estimated by measuring the number of fringes in the interferometric images, and is plotted as a function of vertical position $z^{\ast }$ (the distance to the climbing front) (figure 7e). The fringes become narrower and the number of fringes in the field of view increases at higher $c_{0}$ (figure 7a–d). Also, as $c_{0}$ increases, the climbing front velocity increases, while $\unicode[STIX]{x0394}t$, which denotes the time interval for the climbing front to reach from the centre to the top of the field of view, decreases (figure 7a–d), and is consistent with our observations measuring the climbing front position in § 3.3 (see the movies showing the climbing film rising for figure 7a–d in supplementary movies 5–8).
We also measure the film thickness change locally at a fixed position corresponding to the centre point of the film, during the film ascent, by analysing the fringes that pass this fixed point; see figure 7(g). Encountering the climbing film, the film thickness at this fixed point first slightly decreases ( ${\sim}1~\unicode[STIX]{x03BC}\text{m}$) and then increases (inset in figure 7g). A later secondary increase of the film thickness is also observed at high surfactant concentration (for example, see figure 7g, $c=1\times 10^{-2}~\text{M}$ (black line and circles), $t^{\ast }>1~\text{s}$). As a result, increasing the SDS concentration in the bath, $c_{0}$, leads to a more rapid change in film thickness and also a larger film thickness, which is a consequence of the enhanced Marangoni stress.
Using interferometry, the effect of the pre-wetted film thickness on the climbing film thickness is also studied. In figure 8 we show the results of the film thickness profile, with different pre-wetted film centre thicknesses  $h_{0}=26$ (black circles), $18$ (blue squares), $12$ (red upward-pointing triangles) and $6~\unicode[STIX]{x03BC}\text{m}$ (magenta downward-pointing triangles), respectively. The SDS concentration $c_{0}=3\times 10^{-3}~\text{M}$ is in the high-surfactant-concentration region where we have shown that the resistance from drainage can be neglected. As a result, a thicker pre-wetted film leads to thicker films near the climbing fronts (figure 8a), but a thinner pre-wetted film also leads to thicker secondary films; for example, a strong secondary climbing film is observed at $t^{\ast }>2~\text{s}$ with $h_{0}=6~\unicode[STIX]{x03BC}\text{m}$ (figure 8b). We also note that the film thickness differences $\unicode[STIX]{x0394}h(t^{\ast })$, for different $h_{0}$, coincide at early times (inset in figure 8b) after encountering the climbing front, which is to say, for this experimental set-up, that the film thickness variation with time is unaffected by the pre-wetted film thickness.

Figure 8. The effect of the pre-wetted film thickness on the shape of the climbing film, as measured by interferometry. The SDS concentration in the bath  $c_{0}=3\times 10^{-3}~\text{M}$. (a) The film thickness difference $\unicode[STIX]{x0394}h$ as a function of $z^{\ast }$, when the climbing front reaches the top of the field of view. (b) The film thickness difference $\unicode[STIX]{x0394}h$ at the centre point of the film as the film rises, as a function of time $t^{\ast }$. Here $t^{\ast }=0$ denotes the time that the climbing front passes the fixed point. The inset shows a zoomed-in view of the early rising $t^{\ast }\leqslant 0.2~\text{s}$. The pre-wetted film centre thickness is $h_{0}=26$ (black circles), $18$ (blue squares), $12$ (red upward-pointing triangles) and $6~\unicode[STIX]{x03BC}\text{m}$ (magenta downward-pointing triangles), respectively.
3.5 Discussion
While the Marangoni stress drives the bath liquid to climb upwards along the pre-wetted film, two components act opposite to the Marangoni flow: the viscous resistance and the gravitational drainage. Rather than applying the thin-film equation to obtain the film thickness profile (detailed derivations can be found, for example, in Jensen & Grotberg (Reference Jensen and Grotberg1992, Reference Jensen and Grotberg1993) and Heidari et al. (Reference Heidari, Braun, Hirsa, Snow and Naire2002)), we apply classical scaling arguments for the magnitudes of the Marangoni driving, viscous resistance and gravitational drainage to better understand the time dependence of the film fronts in the experiments reported above.
In our experimental set-up, given that the length of the pre-wetted film along the glass slide  $L\approx 60~\text{mm}$ and the average thickness of the pre-wetted film $\bar{h}\approx 20~\unicode[STIX]{x03BC}\text{m}$, the slope of the pre-wetted film $\bar{h}/L=O(10^{-3})\ll 1$. Also, the ratio of the capillary pressure to gravitational pressure $(\unicode[STIX]{x1D6FE}\bar{h}/L^{2})/(\unicode[STIX]{x1D70C}gL)=O(10^{-6})\ll 1$. Therefore, the curvature of the film (and thus the Laplace pressure generated) is negligible. The lubrication approximation is then applied to the film, which implies that the fluid velocity $u$ is vertical and the inertia effects are negligible. The lubrication equation characterizing the flow $u(x,z,t)$ in the thin film simplifies to
 $$\begin{eqnarray}-\unicode[STIX]{x1D70C}g+\unicode[STIX]{x1D707}\frac{\unicode[STIX]{x2202}^{2}u}{\unicode[STIX]{x2202}x^{2}}=0,\end{eqnarray}$$
 where  $x$ is the horizontal coordinate orthogonal to the substrate ( $x=0$ denotes the substrate) and $z$ is the vertical coordinate along the substrate ( $z=0$ denotes the level of the bath, i.e. the top of the meniscus). The boundary conditions are
 $$\begin{eqnarray}\displaystyle & \displaystyle u=0,\quad \text{at}~x=0, & \displaystyle\end{eqnarray}$$
 $$\begin{eqnarray}\displaystyle & \displaystyle \unicode[STIX]{x1D707}\frac{\unicode[STIX]{x2202}u}{\unicode[STIX]{x2202}x}=\frac{\text{d}\unicode[STIX]{x1D6FE}}{\text{d}c}\frac{\unicode[STIX]{x2202}c}{\unicode[STIX]{x2202}z},\quad \text{at}~x=h(z,t), & \displaystyle\end{eqnarray}$$ $h$ is the thickness of the film, $\unicode[STIX]{x1D6FE}$ is the surface tension and $c$ is the surfactant concentration on the interface, where $(\text{d}\unicode[STIX]{x1D6FE}/\text{d}c)(\unicode[STIX]{x2202}c/\unicode[STIX]{x2202}z)$ represents the Marangoni stress on the interface, with $\text{d}\unicode[STIX]{x1D6FE}/\text{d}c$ the surface tension change with concentration. For the low-SDS-concentration limit, $\text{d}\unicode[STIX]{x1D6FE}/\text{d}c\approx -8~\text{N}~\text{m}^{-1}~\text{M}^{-1}$ and is a constant (Al-Soufi, Piñeiro & Novo Reference Al-Soufi, Piñeiro and Novo2012; Zhang & Meng Reference Zhang and Meng2014). Solving (3.2), the velocity $u$ on the interface ( $x=h$) is
  $$\begin{eqnarray}u(x=h)=\frac{h}{\unicode[STIX]{x1D707}}\frac{\text{d}\unicode[STIX]{x1D6FE}}{\text{d}c}\frac{\unicode[STIX]{x2202}c}{\unicode[STIX]{x2202}z}-\frac{\unicode[STIX]{x1D70C}gh^{2}}{2\unicode[STIX]{x1D707}}.\end{eqnarray}$$
 Note that positive  $u$ means moving upwards against gravity. This result shows two contributions to the interface velocity $u(x=h)$: the first is the Marangoni term $(h/\unicode[STIX]{x1D707})(\text{d}\unicode[STIX]{x1D6FE}/\text{d}c)(\unicode[STIX]{x2202}c/\unicode[STIX]{x2202}z)$, which, since $\unicode[STIX]{x2202}c/\unicode[STIX]{x2202}z<0$, is upwards; and the second is the gravitational drainage term $\unicode[STIX]{x1D70C}gh^{2}/(2\unicode[STIX]{x1D707})$, which is downwards. The ratio of these two velocity terms yields
 $$\begin{eqnarray}\unicode[STIX]{x1D6EC}=\frac{\text{d}\unicode[STIX]{x1D6FE}}{\text{d}c}\frac{\unicode[STIX]{x2202}c}{\unicode[STIX]{x2202}z}\frac{2}{\unicode[STIX]{x1D70C}gh},\end{eqnarray}$$
 which characterizes the ratio of the Marangoni driving to the gravitational drainage. For  $\unicode[STIX]{x1D6EC}\gg 1$, Marangoni driving dominates and the gravitational drainage is negligible. Where $\unicode[STIX]{x1D6EC}=O(1)$, the Marangoni velocity is of the same order of magnitude as the drainage flow velocity.
To analyse the velocity ratio  $\unicode[STIX]{x1D6EC}$ at the climbing front $\unicode[STIX]{x1D6EC}(z=z_{f})$ (denoted $\unicode[STIX]{x1D6EC}_{f}$), we assume that the surfactant concentration varies linearly from the level of the bath (the top of the meniscus, $z=0$) to the climbing front ( $z=z_{f}$). The surfactant concentration at the climbing front $c(z=z_{f})=0$, since the surfactant is transported by the climbing film and there is no surfactant above the climbing front. Thus, we estimate the surfactant concentration gradient on the interface $\unicode[STIX]{x2202}c/\unicode[STIX]{x2202}z\approx -c_{0}/z_{f}$. Note that this assumption of a linear concentration profile is also used by He & Ketterson (Reference He and Ketterson1995), for estimating the spreading of a liquid on a vertical surface. Moreover, this assumption is also consistent with the asymptotic solution of the Marangoni spreading on a horizontal strip (Jensen & Grotberg Reference Jensen and Grotberg1992, Reference Jensen and Grotberg1993), which yields a linear profile.
The velocity ratio at the climbing front  $\unicode[STIX]{x1D6EC}_{f}$ can therefore be estimated as
 $$\begin{eqnarray}\unicode[STIX]{x1D6EC}_{f}=-\frac{\text{d}\unicode[STIX]{x1D6FE}}{\text{d}c}\frac{2c_{0}}{\unicode[STIX]{x1D70C}ghz_{f}},\end{eqnarray}$$
 where  $h$ is the pre-wetted film thickness set by drainage.
3.5.1 Marangoni driving dominates gravitational drainage
The climbing front starts to rise from the bath ( $z_{f}=0$) when the bath contacts the pre-wetted film ( $t=0$). At the early times, $z_{f}$ is small such that $\unicode[STIX]{x1D6EC}_{f}=-2c_{0}(\text{d}\unicode[STIX]{x1D6FE}/\text{d}c)/(\unicode[STIX]{x1D70C}ghz_{f})\gg 1$. Also, for the high SDS concentrations, substituting $z_{f}=20~\text{mm}$ (the top of the field of view in the experiments) and $h=h_{0}$ ( $h_{0}=18~\unicode[STIX]{x03BC}\text{m}$ for drainage time interval $\unicode[STIX]{x1D70F}_{0}=10~\text{s}$), $\unicode[STIX]{x1D6EC}_{f}\approx 45$ for $c_{0}=1\times 10^{-2}~\text{M}$ and $\unicode[STIX]{x1D6EC}_{f}\approx 13$ for $c_{0}=3\times 10^{-3}~\text{M}$. Hence, $\unicode[STIX]{x1D6EC}_{f}\gg 1$ for both $c_{0}=3\times 10^{-3}$ and $1\times 10^{-2}~\text{M}$ throughout the measurements. In these regions, Marangoni stress dominates and gravitational drainage is negligible. The climbing front position $z_{f}$ as a function of time $t$ can be estimated by relating the climbing front velocity to the interface velocity, using (3.4):
 $$\begin{eqnarray}\frac{\text{d}z_{f}}{\text{d}t}=u(x=h)=-\frac{\text{d}\unicode[STIX]{x1D6FE}}{\text{d}c}\frac{hc_{0}}{\unicode[STIX]{x1D707}z_{f}}.\end{eqnarray}$$
 Taking the film thickness  $h$ as constant would result in $z_{f}\propto t^{1/2}$ (He & Ketterson Reference He and Ketterson1995). In our experiments, however, the film thickness $h$ is not a constant and is set by gravitational drainage. Jeffreys’ similarity solution (3.1) is used to estimate the pre-wetted film shape at the climbing front:
 $$\begin{eqnarray}h=\left[\frac{\unicode[STIX]{x1D707}(L-z_{f})}{\unicode[STIX]{x1D70C}g\unicode[STIX]{x1D70F}}\right]^{1/2},\end{eqnarray}$$
 where  $L$ is the height of the film (from the top of the pre-wetted film to the bath liquid level) and $\unicode[STIX]{x1D70F}$ the drainage time. While Marangoni driving dominates and the climbing film is fast, we consider the drainage time $\unicode[STIX]{x1D70F}$ as a constant and is equal to the drainage time interval $\unicode[STIX]{x1D70F}_{0}$. Substituting the expression of $h$ into (3.7), the differential equation for $z_{f}$ becomes
 $$\begin{eqnarray}\frac{\text{d}z_{f}}{\text{d}t}=-\frac{\text{d}\unicode[STIX]{x1D6FE}}{\text{d}c}\frac{c_{0}}{\unicode[STIX]{x1D707}z_{f}}\left[\frac{\unicode[STIX]{x1D707}(L-z_{f})}{\unicode[STIX]{x1D70C}g\unicode[STIX]{x1D70F}_{0}}\right]^{1/2},\end{eqnarray}$$
and the non-dimensional form of this equation is
 $$\begin{eqnarray}\frac{\text{d}\hat{z}}{\text{d}\hat{t}}=\frac{(1-\hat{z})^{1/2}}{\hat{z}},\end{eqnarray}$$
 with initial condition  $\hat{z}(\hat{t}=0)=0$, where the normalized front position $\hat{z}=z_{f}/L$ and the normalized time $\hat{t}=t/t_{m}$, with
 $$\begin{eqnarray}t_{m}=\frac{(\unicode[STIX]{x1D707}\unicode[STIX]{x1D70C}g\unicode[STIX]{x1D70F}_{0}L^{3})^{1/2}}{-{\displaystyle \frac{\text{d}\unicode[STIX]{x1D6FE}}{\text{d}c}}c_{0}}.\end{eqnarray}$$
 With typical values for water, and  $L=60~\text{mm}$ and $-\text{d}\unicode[STIX]{x1D6FE}/\text{d}c=8~\text{N}~\text{m}^{-1}~\text{M}^{-1}$, a drainage time interval $\unicode[STIX]{x1D70F}_{0}=10~\text{s}$ and $c_{0}=1\times 10^{-2}~\text{M}$, the time scale $t_{m}=O(1)~\text{s}$, which is also the typical time scale for the climbing film to reach the top of the film on the glass slides observed in the experiments (figure 4f).
The solution of (3.10) is
 $$\begin{eqnarray}-{\textstyle \frac{2}{3}}\sqrt{1-\hat{z}}\,(2+\hat{z})=\hat{t}-{\textstyle \frac{4}{3}}.\end{eqnarray}$$
Figure 9. The normalized climbing front position  $\hat{z}$ as a function of the normalized time, when (a) Marangoni driving dominates, $\unicode[STIX]{x1D6EC}_{f}\gg 1$, and (b) Marangoni driving balances gravitational drainage, $\unicode[STIX]{x1D6EC}_{f}=\unicode[STIX]{x1D6EC}_{fc}=3$. The dots denote the processed experimental data points ( $\hat{z}$ is translated during the fitting) displayed in figure 6, with (a) high ( $c_{0}=3\times 10^{-3}~\text{M}$) and (b) low ( $c_{0}=3\times 10^{-4}~\text{M}$) SDS concentrations in the bath. The pre-wetted film centre thickness is $h_{0}=26$ (black circles), $18$ (blue squares), $12$ (red upward-pointing triangles) and $6~\unicode[STIX]{x03BC}\text{m}$ (magenta downward-pointing triangles), respectively. The black line denotes our model prediction by (3.12) and (3.15), respectively. The inset shows $\hat{z}(\hat{t})$ with $0\leqslant \hat{t}\leqslant 1$. Note that the experimental results are processed with $\hat{z}=z_{f}/L-\hat{z}_{0}$, where $\hat{z}_{0}$ is a fitting parameter in our model.
The black line in figure 9(a) shows the solutions of (3.12) for the normalized front position  $\hat{z}$ as a function of the normalized time $\hat{t}$. For comparison, the experimental results in figure 6(a) with high SDS concentrations $c_{0}=3\times 10^{-3}~\text{M}$ for four different pre-wetted film thicknesses $h_{0}$ are processed (normalized by the length scale $L$ and time scale $t_{m}$) and displayed. We note that the level of the bath (the top of the meniscus, where $z=0$) varies in experiments and thus the uncertainties on the bath positions generate errors when measuring $z$ in the experiments; setting the top level of the meniscus as $z=0$ might also introduce a systematic error. A translation of $\hat{z}$ is therefore applied to allow for the uncertainties of the bath positions, i.e. the experimental results are processed with $\hat{z}=z_{f}/L-\hat{z}_{0}$, where $\hat{z}_{0}$ is a fitting parameter to our model in figure 9 (typically $\hat{z}_{0}\approx 0.07$ in this set of experiments, and no other fitting parameter is applied). As a result, this model matches our interferometric measurements with high SDS concentrations, where Marangoni driving dominates, i.e. gravitational drainage is negligible and Marangoni driving is balanced by viscous resistance. Also, the expression for the time scale in the Marangoni-driven climbing (3.11) suggests that the front rise velocity increases as $c_{0}$ increases and/or $h_{0}$ increases, and agrees with our experiential observation (figures 4f and 6a).
3.5.2 Marangoni driving balances gravitational drainage
On the other hand, the effect of gravitational drainage is significant for low SDS concentration. For  $c_{0}=1\times 10^{-3}~\text{M}$, $\unicode[STIX]{x1D6EC}_{f}\approx 4$ at the top of the field of view in the experiments, and the rise speed is much slower than that for $c_{0}=3\times 10^{-3}~\text{M}$ (figure 4f), due to the resistance from gravitational drainage. For lower SDS concentration $c_{0}=3\times 10^{-4}~\text{M}$, a different trend is observed. When the bath contacts the pre-wetted film at $t=0$, the film rises rapidly in the Marangoni-dominated region (the blue line in figure 5e, $t\lesssim 2~\text{s}$), until $\unicode[STIX]{x1D6EC}_{f}=O(1)$ is reached. At $\unicode[STIX]{x1D6EC}_{f}=O(1)$, the driving flux and the drainage flux are balanced and thus the climbing front ceases to rise rapidly. During the late times, the film drains continuously and thus the gravitational drainage weakens, and therefore the film front rises to maintain the balance between the driving and drainage flux as $\unicode[STIX]{x1D6EC}_{f}=O(1)$. As a consequence, decreasing the initial pre-wetted film thickness will lead to a higher $z_{f}$, which balances the rising and draining flows as $\unicode[STIX]{x1D6EC}_{f}=O(1)$ (figure 6b). For even lower SDS concentrations $c_{0}=1\times 10^{-4}$ and $3\times 10^{-5}~\text{M}$, only the late-time climbing (balancing driving and draining) is observed in the interferometric set-ups (figure 5e). Note that for low SDS concentrations such as $c_{0}=1\times 10^{-4}$ and $3\times 10^{-5}~\text{M}$, the surfactant concentrations are so low that the surface tension gradient generated by the contamination from the ambient air or the temperature gradient induced by water evaporation may also come into play, and might affect the measurements.
During the late times (after the early rise times when Marangoni driving dominates), Marangoni driving balances gravitational drainage. To analyse the film climbing during the late times, we assume that  $\unicode[STIX]{x1D6EC}_{f}$, the ratio of Marangoni driving to gravitational drainage at the film front, is constant, i.e.
 $$\begin{eqnarray}\unicode[STIX]{x1D6EC}_{f}=\unicode[STIX]{x1D6EC}_{fc}=O(1).\end{eqnarray}$$
 Substituting (3.13) into (3.6) and using Jeffreys’ solution (3.8) for film thickness  $h$, we obtain
 $$\begin{eqnarray}\unicode[STIX]{x1D6EC}_{fc}=-\frac{\text{d}\unicode[STIX]{x1D6FE}}{\text{d}c}\frac{2c_{0}}{\unicode[STIX]{x1D70C}gz_{f}\left[{\displaystyle \frac{\unicode[STIX]{x1D707}(L-z_{f})}{\unicode[STIX]{x1D70C}g\unicode[STIX]{x1D70F}}}\right]^{1/2}},\end{eqnarray}$$
 where  $\unicode[STIX]{x1D70F}$ denotes the total time that the film drains. We note again that $\unicode[STIX]{x1D70F}$ and $t$ are two different notations for time, where $\unicode[STIX]{x1D70F}=0$ denotes the end of the injection of the water on the pre-wetted film, and $t=0$ denotes the time that the bath contacts the pre-wetted film. Also, $\unicode[STIX]{x1D70F}=t+\unicode[STIX]{x1D70F}_{0}$. The non-dimensional form for (3.14) is
 $$\begin{eqnarray}\hat{z}^{2}(1-\hat{z})=\hat{\unicode[STIX]{x1D70F}},\end{eqnarray}$$
 where the normalized climbing front position  $\hat{z}=z_{f}/L$ and the normalized time $\hat{\unicode[STIX]{x1D70F}}=\unicode[STIX]{x1D70F}/\unicode[STIX]{x1D70F}_{d}=(t+\unicode[STIX]{x1D70F}_{0})/\unicode[STIX]{x1D70F}_{d}$. Here $\unicode[STIX]{x1D70F}_{d}$ is the time scale for film climbing while Marangoni driving balances gravitational drainage, and
 $$\begin{eqnarray}\unicode[STIX]{x1D70F}_{d}=\frac{\unicode[STIX]{x1D6EC}_{fc}^{2}\unicode[STIX]{x1D707}\unicode[STIX]{x1D70C}gL^{3}}{4\left({\displaystyle \frac{\text{d}\unicode[STIX]{x1D6FE}}{\text{d}c}}c_{0}\right)^{2}}.\end{eqnarray}$$
 Taking  $\unicode[STIX]{x1D6EC}_{fc}=3$ and $c_{0}=3\times 10^{-4}~\text{M}$, the film climbing time scale $\unicode[STIX]{x1D70F}_{d}=O(10^{3})~\text{s}\gg t_{m}$, and is much longer than the period of our observation in the experiments. Comparing the expression of $t_{m}$ (3.11) and $\unicode[STIX]{x1D70F}_{d}$ (3.16) also yields $\unicode[STIX]{x1D70F}_{d}=\unicode[STIX]{x1D6EC}_{fc}^{2}t_{m}^{2}/(4\unicode[STIX]{x1D70F}_{0})$.
The relationship of the normalized film front position  $\hat{z}$ with the normalized time $\hat{\unicode[STIX]{x1D70F}}$, where Marangoni driving balances gravitational drainage, is shown in figure 9(b). The black line shows the solutions of (3.15). The experimental results in figure 6(b) with low SDS concentration $c_{0}=3\times 10^{-4}~\text{M}$ for four different $h_{0}$ are processed (normalized by the length scale $L$ and time scale $\unicode[STIX]{x1D70F}_{d}$, taking $\unicode[STIX]{x1D6EC}_{fc}=3$ in (3.16)) and displayed for comparison. A vertical translation of the experimental results $\hat{z}$ is applied when fitting the model, i.e. the experimental results are processed with $\hat{z}=z_{f}/L-\hat{z}_{0}$, where $\hat{z}_{0}$ is a fitting parameter (typically $|\hat{z}_{0}|\approx 0.02$ in this set of experiments, and no other fitting parameter is applied). As a result, our model matches the late-time dynamics of our interferometric measurements with low $c_{0}$. Our interferometric measurements at the early times deviate from the model since the Marangoni driving is still stronger than gravitational drainage while $\unicode[STIX]{x1D6EC}_{f}>\unicode[STIX]{x1D6EC}_{fc}$. Also, the experimental results with $h_{0}=6~\unicode[STIX]{x03BC}\text{m}$ deviate from the model since the film drainage does not match Jeffreys’ solution at long drainage times $\unicode[STIX]{x1D70F}\gtrsim 40~\text{s}$, as shown in figure 3(b). As a conclusion, at low SDS concentration, while Marangoni driving balances gravitational drainage, decreasing the pre-wetted film thickness implies longer drainage times, and the climbing film rises higher due to the reduced gravitational drainage, which agrees with the observations in figure 6(b).
Our model describes the position of the film front as a function of time, in both the regions where Marangoni driving dominates and the regions where Marangoni driving balances gravitational drainage. As for the film thickness profile, the analysis of a detailed film thickness profile as a function of time requires numerical calculations of partial differential equations (PDEs), solving for the distribution of the film thickness as well as the surfactant concentration. The meniscus shape (thus the Laplace pressure by the curvature) also needs to be considered. A similar framework regarding the PDEs needed can be found in Heidari et al. (Reference Heidari, Braun, Hirsa, Snow and Naire2002), and this remains as a topic for further investigations of this problem.
4 Summary
In this article, we studied the Marangoni film climbing on a vertical pre-wetted film whose thickness changes with time. We first visualized the climbing film by adding dye. Particle tracking velocimetry was used to find the mean flow velocity in the film during the motion of the climbing film. The thin film uniformly drained downwards before encountering the climbing front, upon which the flow near the air–water interface reversed directions. In addition, the thickness profile of the pre-wetted film was measured by high-speed interferometry and was found to agree with Jeffreys’ similarity solution. The thickness of the pre-wetted film could then be tuned by controlling the drainage time interval  $\unicode[STIX]{x1D70F}_{0}$. The climbing front position $z_{f}$ as a function of time $t$ was measured by processing the interferometric images, and the effects of the bath SDS concentration, $c_{0}$, and the pre-wetted thickness at the centre of the film, $h_{0}$, were studied. As a result, the front speed of the climbing film increased with higher surfactant concentration in the bath. For high concentrations ( $c_{0}\gtrsim 1\times 10^{-3}~\text{M}$), the rise velocity of the film’s front increased as the film thickness increased, while in contrast, for low concentrations ( $c_{0}\lesssim 1\times 10^{-3}~\text{M}$), the rise velocity of the film’s front decreased as the film thickness increased. Interferometric measurements of the film thicknesses delineated the effect of $c_{0}$ as well as $h_{0}$ on the film thickness.
We then highlighted the influence of  $c_{0}$ and $h_{0}$ on the climbing film behavior due to the underlying competition among the Marangoni stress, gravitational drainage and viscous resistance. By taking the ratio of the two velocity terms (Marangoni driving velocity relative to gravitational drainage velocity) at the interface of the front of the climbing film, a dimensionless ratio, $\unicode[STIX]{x1D6EC}_{f}$, was identified, which represented the significance of the gravitational drainage in the climbing film. A value $\unicode[STIX]{x1D6EC}_{f}\gg 1$ implied that the Marangoni stress dominated, while $\unicode[STIX]{x1D6EC}_{f}=O(1)$ implied that the Marangoni stress balanced gravitational drainage. By establishing a model that described the climbing film position and taking into account the pre-wetted film draining, the trends reported in the interferometric measurements on the climbing film front position were explained. As a result, by setting the drainage time interval for the pre-wetted film, $\unicode[STIX]{x1D70F}_{0}$, and/or the $c_{0}$, the climbing film may be tuned.
Acknowledgements
The authors thank J. Feng, J. Hong, J. Nunes and L. Zhu for valuable discussions and suggestions, and also the anonymous referees for their valuable suggestions and recommendations for improvement of our original manuscript. The authors acknowledge support from the National Science Foundation Center for Chemomechanical Assembly (grant no. NSF-CCI-1740630).
Declaration of interests
The authors report no conflict of interest.
Supplementary movies
Supplementary movies are available at https://doi.org/10.1017/jfm.2019.1071.
Appendix A. Three-dimensional film thickness profile

Figure 10. The interferometric images for the three-dimensional thickness profile of the thin film. Interferometric images with a larger field of view ( $16.5~\text{mm}\times 22.9~\text{mm}$) are displayed for (a) the draining film at $t=-0.15~\text{s}$, before contacting the bath with surfactant, and (b) the climbing film after the substrate contacts a bath with high SDS concentration ( $c_{0}=3\times 10^{-3}~\text{M}$, $t=0.15~\text{s}$)
In both Jeffreys’ (Reference Jeffreys1930) similarity solution and our model, the film thickness profile is considered as two-dimensional, i.e. the film thickness is a function only of  $z$, the vertical position on the substrate. In reality, the existence of the sides of the substrate might affect the film thickness profile, and therefore the film thickness profile may deviate from the two-dimensional model. In this appendix we discuss the possible effect of the three-dimensional film thickness profile on the substrate.
The non-uniformity of the (horizontal) film profile is observed in the experiments. For example, in figure 1(a), the liquid near the two sides of the glass is darker, indicating that the film thickness on the sides is thicker than that in the middle of the substrate. To identify the two-dimensional film thickness profile, the interferometric images with a larger field of view ( $864~\text{pixel}\times 1200~\text{pixel}$, i.e. $16.5~\text{mm}\times 22.9~\text{mm}$) is displayed in figure 10. Note that the interferometric images in figure 10 are actually a larger-field-of-view version of the experiments in figure 4(a–d). Figure 10(a) shows the interferometric images of the draining film before the substrate contacts the liquid bath (which is translating upwards with the motorized stage). The interferometric pattern is approximately left–right symmetric about the centreline, and vertical fringes are observed in figure 10(a), which implies that the film thickness changes in the horizontal direction. Though the film thickness near the sides of the glass slide (near the left and right sides in figure 10a) is thicker than the middle and varies horizontally, the fringes in the middle of the glass substrate (in the marked red box in figure 10a) remain horizontal, which means that the film thickness profile is uniform horizontally in the middle of the substrate. Also, the climbing film front (red dashed line in figure 10b) is also approximately horizontal, which shows that the sides of the substrate have little influence (see the movies showing the climbing film for figure 10 in supplementary movie 9). In the experiments reported in this article, the measurements are made in the middle of the glass slide (red box in figure 10a), where the horizontal film thickness difference is relatively small: the horizontal film thickness difference in the middle of the substrate is of the order of $1~\unicode[STIX]{x03BC}\text{m}$ (and is usually less), and thus is much smaller compared to the thickness of the draining film. Therefore, our experimental measurements should not be subject to the influence of the sides of the substrate. Nevertheless, the film thickness profile near the side of the substrate is an interesting topic for future investigations.


