


1. Introduction
In detonation engines, a detonation may propagate in inhomogeneous gaseous mixtures since fuel and oxidizer are usually injected separately into the combustion chamber and it is difficult for them to be perfectly mixed (Lu & Braun Reference Lu and Braun2014; Fujii et al. Reference Fujii, Kumazawa, Matsuo, Nakagami, Matsuoka and Kasahara2017). In accidental explosions, detonation initiation and quenching also occur in non-uniform mixtures (Boulal, Vidal & Zitoun Reference Boulal, Vidal and Zitoun2016). Therefore, there is increasing interest in studying detonation propagation in inhomogeneous gaseous mixtures.
Generally, six typical distributions of inhomogeneous mixtures, as depicted in figure 1, have been considered so far. Figures 1(a) and 1(b) show reactants with fuel concentration gradient normal (Ishii & Kojima Reference Ishii and Kojima2007; Lieberman & Shepherd Reference Lieberman and Shepherd2007a,Reference Lieberman and Shepherdb; Kessler, Gamezo & Oran Reference Kessler, Gamezo and Oran2012; Ettner, Vollmer & Sattelmayer Reference Ettner, Vollmer and Sattelmayer2013; Boeck et al. Reference Boeck, Berger, Hasslberger and Sattelmayer2015; Grune et al. Reference Grune, Sempert, Friedrich, Kuznetsov and Jordan2017; Khodadadi Azadboni et al. Reference Khodadadi Azadboni, Heidari, Boeck and Wen2019; Zheng et al. Reference Zheng, Kaplan, Houim and Oran2019) and parallel (Thomas, Sutton & Edwards Reference Thomas, Sutton and Edwards1991; Kuznetsov et al. Reference Kuznetsov, Alekseev, Dorofeev, Matsukov and Boccio1998; Boulal et al. Reference Boulal, Vidal and Zitoun2016, Reference Boulal, Vidal, Zitoun, Matsumoto and Matsuo2018; Ma, Wang & Han Reference Ma, Wang and Han2020) to the detonation propagation direction, respectively. Figures 1(c) and 1(d) depict reactants with inert layers parallel (Houim & Fievisohn Reference Houim and Fievisohn2017; Reynaud, Virot & Chinnayya Reference Reynaud, Virot and Chinnayya2017; Maxwell & Melguizo-Gavilanes Reference Maxwell and Melguizo-Gavilanes2019; Taileb, Melguizo-Gavilanes & Chinnayya Reference Taileb, Melguizo-Gavilanes and Chinnayya2019) and normal (Gavrilenko, Krasnov & Nikolaev Reference Gavrilenko, Krasnov and Nikolaev1982; Bjerketvedt, Sonju & Moen Reference Bjerketvedt, Sonju and Moen1986; Teodorczyk & Benoan Reference Teodorczyk and Benoan1996; Kuznetsov et al. Reference Kuznetsov, Dorofeev, Efimenko, Alekseev and Breitung1997; Li et al. Reference Li, Lai, Chung and Lu2008; Fujii et al. Reference Fujii, Kumazawa, Matsuo, Nakagami, Matsuoka and Kasahara2017; Ishii & Seki Reference Ishii and Seki2017; Peace & Lu Reference Peace and Lu2017; Tang et al. Reference Tang, Mi, Lee, Teng and Ng2017; Peace & Lu Reference Peace and Lu2018; Tang et al. Reference Tang, Mi, Lee and Ng2018; Chen, Liu & Wang Reference Chen, Liu and Wang2019; Tang et al. Reference Tang, Lee, Ng and Mi2019a,Reference Tang, Lee, Ng and Mib) to the detonation propagation direction, respectively. Similar to the case in figure 1(d), several studies (Kuznetsov et al. Reference Kuznetsov, Dorofeev, Efimenko, Alekseev and Breitung1997; Li et al. Reference Li, Lai, Chung and Lu2008; Peace & Lu Reference Peace and Lu2017; Tang et al. Reference Tang, Mi, Lee, Teng and Ng2017; Peace & Lu Reference Peace and Lu2018; Tang et al. Reference Tang, Mi, Lee and Ng2018; Tang et al. Reference Tang, Lee, Ng and Mi2019a,Reference Tang, Lee, Ng and Mib) have investigated the detonation transmission across the interface for density, temperature or mixture composition. Besides, detonation propagation in mixtures with uniformly or randomly distributed inert regions or in a porous medium (see figure 1e) has also been investigated previously (Lieberman & Shepherd Reference Lieberman and Shepherd2007a,Reference Lieberman and Shepherdb; Radulescu & Maxwell Reference Radulescu and Maxwell2011; Li, Mi & Higgins Reference Li, Mi and Higgins2015; Gaathaug, Vaagsaether & Bjerketvedt Reference Gaathaug, Vaagsaether and Bjerketvedt2017; Mi et al. Reference Mi, Higgins, Ng, Kiyanda and Nikiforakis2017a; Mi, Timofeev & Higgins Reference Mi, Timofeev and Higgins2017b; Mi et al. Reference Mi, Michael, Nikiforakis and Higgins2019; Prakash & Raman Reference Prakash and Raman2019).

Figure 1. Schematic of detonation propagating in different inhomogeneous mixtures. The white and grey regions represent reactants and inert, respectively. The light green colour represents higher reactant concentration.
In this study we consider the detonation propagation in inhomogeneous mixtures with periodic fuel concentration gradient parallel to the detonation propagation direction, as depicted in figure 1(f). In rotating detonation engines, the unburned reactants are injected into the combustion chamber through injection ports and burned gas might exist at the injection-port intervals (Fujii et al. Reference Fujii, Kumazawa, Matsuo, Nakagami, Matsuoka and Kasahara2017). In accidental explosions, the injection of water and inert gas is used to disperse the continuous distribution of combustible gas (Teodorczyk & Benoan Reference Teodorczyk and Benoan1996). Therefore, in both rotating detonation engines and accidental explosions, a detonation might propagate in inhomogeneous mixtures as depicted in figure 1(f). However, in the literature there are only a few studies on detonation propagation in this type of inhomogeneous mixture. Thomas et al. (Reference Thomas, Sutton and Edwards1991) experimentally investigated the detonation propagation in mixtures with concentration gradient and found that the transmitted detonation adjusts its speed and cell size rapidly to the local gas composition. Kuznetsov et al. (Reference Kuznetsov, Alekseev, Dorofeev, Matsukov and Boccio1998) conducted experiments on detonation transmission in non-uniform mixtures and found that the detonation propagation is significantly affected by the magnitude of the concentration gradient. Boulal et al. (Reference Boulal, Vidal and Zitoun2016, Reference Boulal, Vidal, Zitoun, Matsumoto and Matsuo2018) experimentally investigated detonation quenching and reinitiation in non-uniform compositions and proposed a criterion to quantify shock–reaction zone decoupling. Due to the difficulty in preparing non-uniform reactants and measuring composition distribution in experiments, simulations were conducted in previous studies. In their one-dimensional (1-D) simulations, Ma et al. (Reference Ma, Wang and Han2020) found that a periodic gradient in reactant concentration affects detonation propagation modes and that composition inhomogeneity helps to stabilize a pulsating detonation under certain conditions. Mi et al. (Reference Mi, Higgins, Ng, Kiyanda and Nikiforakis2017a) studied gaseous detonation propagation in non-uniform mixtures and found that the averaged detonation propagation speed in an inhomogeneous mixture is higher than that in a homogeneous mixture. Radulescu & Maxwell (Reference Radulescu and Maxwell2011) experimentally and numerically investigated the detonation propagating through a porous medium and found that wave diffraction and reflection are critical mechanisms for detonation attenuation and reinitiation.
However, most of the previous studies considered detonation propagation in mixtures with a single concentration gradient. Detonation propagation in inhomogeneous mixtures with a periodic gradient in reactant concentration has received little attention. Besides, although 1-D simulation results were reported by Ma et al. (Reference Ma, Wang and Han2020), the evolution of cellular detonation structure was not studied before.
Based on the above considerations, here we consider detonation propagation in inhomogeneous H2/O2/N2 mixtures with a periodic gradient in reactant concentration. Both 1-D and two-dimensional (2-D) simulations considering detailed chemistry have been conducted. The objective of this study is to assess the effects of a periodic gradient in reactant concentration on detonation propagation properties, including detonation quenching and reinitiation, cellular structure, cell size and detonation speed deficit. This paper is structured as follows. Section 2 presents the numerical model and methods. Then, the evolution of 1-D and 2-D detonation propagation in inhomogeneous mixtures is investigated and the effects of the inhomogeneous mixture on detonation quenching and reinitiation and cellular structure are assessed in § 3. Finally, the conclusions are presented in § 4.
2. Numerical model and methods
We consider 1-D and 2-D detonation propagation in a stoichiometric H2/O2/N2 mixture initially at T 0 = 300 K and P 0 = 1 atm. The numerical model is depicted in figures 1(f) and 2.

Figure 2. Schematic of the initial pressure and hydrogen mass fraction distributions.
First, the detonation propagates through the static homogeneous H2/O2/N2 mixture, whose molar ratio is H2 : O2 : N2 = 2 : 1 : s. Table 1 lists the two types of mixtures for stoichiometric H2/air without (s = 3.76) and with (s = 7) nitrogen dilution, respectively. Nitrogen dilution was introduced to mixture 2 to change the reactivity and the detonation properties including detonation speed and cell size. The induction length, li, and cell size, λ, for these two mixtures are listed in table 1. The cellular structure becomes steady and the cell size gradually increases as the detonation propagates forward. Considering the computational cost, the length of the homogeneous mixture is x 0 = 421li for 1-D cases and 315li for 2-D cases, which was chosen to ensure quasi-steady detonation with constant cellular structure for the 2-D case. As shown in figure 2, the static inhomogeneous mixture has a sinusoidal distribution of mixture composition and the molar fraction of each species is
 \begin{align}\left.
{\begin{aligned} {{x_{{\textrm{H}_\textrm{2}}}} =
\{ 2 - 2 \times a \times \sin [2{\rm \pi} (x -
{x_0})/L]\} /(2 + 1 + s),}\\ {{x_{{\textrm{O}_\textrm{2}}}}
= \{ 1 - 1 \times a \times \sin [2{\rm \pi} (x -
{x_0})/L]\} /(2 + 1 + s),}\\ {{x_{{\textrm{N}_\textrm{2}}}}
= \{ s + 3 \times a \times \sin [2{\rm \pi} (x -
{x_0})/L]\} /(2 + 1 + s),} \end{aligned}}
\right\}\end{align}
\begin{align}\left.
{\begin{aligned} {{x_{{\textrm{H}_\textrm{2}}}} =
\{ 2 - 2 \times a \times \sin [2{\rm \pi} (x -
{x_0})/L]\} /(2 + 1 + s),}\\ {{x_{{\textrm{O}_\textrm{2}}}}
= \{ 1 - 1 \times a \times \sin [2{\rm \pi} (x -
{x_0})/L]\} /(2 + 1 + s),}\\ {{x_{{\textrm{N}_\textrm{2}}}}
= \{ s + 3 \times a \times \sin [2{\rm \pi} (x -
{x_0})/L]\} /(2 + 1 + s),} \end{aligned}}
\right\}\end{align}
where L is the wavelength and a is the amplitude of the sinusoidal distribution as depicted in figure 2. Equation (2.1) indicates that the molar ratio between hydrogen and oxygen is 2 everywhere and that the averaged fuel molar concentration in the inhomogeneous mixture is the same as that in the homogeneous mixture. Different values for L in the range of 1–16 mm and for a in the range of 0–1 were considered. The homogeneous mixture is recovered for a = 0. Note that in the homogeneous and inhomogeneous unburned mixtures, the temperature and pressure are respectively 300 K and 1 atm everywhere. The density depends on the mixture composition and has sinusoidal distribution in the inhomogeneous mixture.
Table 1. Two types of mixtures initially at T 0 = 300 K and P 0 = 1 atm.

The in-house code A-SURF (Chen Reference Chen2010; Dai & Chen Reference Dai and Chen2015) and the parallel block-structured mesh refinement framework AMROC (Deiterding Reference Deiterding2009) were respectively used to simulate the 1-D and 2-D detonation propagation in the inhomogeneous H2/O2/N2 mixtures. The conservation equations for unsteady, multicomponent, compressible, reactive flows were solved in both A-SURF and AMROC using the finite-volume approach. Diffusion terms were kept in the conservation equations. The temporal integration, convective fluxes and diffusive fluxes were calculated, respectively, using the Runge–Kutta, MUSCL-Hancock and central difference schemes in A-SURF (Chen Reference Chen2010; Dai & Chen Reference Dai and Chen2015). For AMROC, a hybrid Roe-HLL Riemann solver for mixtures of thermally perfect gases was used to calculate the convective fluxes. The central difference scheme was used for the diffusion terms (Deiterding Reference Deiterding2009). The detailed chemistry for hydrogen developed by Li et al. (Reference Li, Zhao, Kazakov and Dryer2004) was used. When a detailed chemistry rather than one-step chemistry is considered, there exists a so-called crossover temperature, below which the intermediate/radical is removed from the system by chain-termination reactions too quickly for a chain-branching process to occur. The CHEMKIN packages were incorporated into A-SURF and AMROC to evaluate the temperature- and component-dependent thermodynamic and transport properties as well as the reaction rates. The mixture-averaged model was used for diffusion, and the Soret and Dufour effects were not included in this study. Details on diffusion terms and related discussion can be found in § 3 of the supplementary material available at https://doi.org/10.1017/jfm.2022.1074. The VODE solver (Brown, Byrne & Hindmarsh Reference Brown, Byrne and Hindmarsh1989) and the semi-implicit Runge–Kutta method GRK4A were adopted to integrate stiff reaction terms in A-SURF and AMROC, respectively. The Godunov splitting method was used to decouple hydrodynamic transport and the stiff chemical reaction source terms numerically. A-SURF and AMROC have successfully been used in previous studies to simulate detonation initiation and propagation (Deiterding Reference Deiterding2009; Deiterding Reference Deiterding2011; Dai & Chen Reference Dai and Chen2015; Qi & Chen Reference Qi and Chen2017; Wang et al. Reference Wang, Han, Deiterding and Chen2018; Dai & Chen Reference Dai and Chen2019; Huang, Qi & Chen Reference Huang, Qi and Chen2019). The details of the governing equations and numerical schemes of A-SURF and AMROC can be found in Chen (Reference Chen2010), Dai & Chen (Reference Dai and Chen2015) and Wang et al. (Reference Wang, Han, Deiterding and Chen2018) and therefore are not repeated here.
The computational domains are 0 ≤ x ≤ 60 cm in 1-D simulations and 0 ≤ x ≤ 60 cm and 0 ≤ y ≤ 4 cm in 2-D simulations. The length of 60 cm was chosen to ensure that in the inhomogeneous region the quasi-steady-state propagation can be reached and the detonation structure can fully develop. The chosen domain width of 4 cm is large enough to guarantee the independence of cell size with domain width in 2-D simulations. On the left- and right-hand sides of the computational domain in both 1-D and 2-D simulations, adiabatic, reflective, no-slip wall boundary conditions were used. For the top and bottom sides in 2-D simulations, periodic boundary conditions were enforced and thereby boundary layer effects on detonation propagation were circumvented (Han, Gao & Law Reference Han, Gao and Law2017). The ideal strong blast wave was used as the initial condition for 1-D simulations (Qi & Chen Reference Qi and Chen2017). For 2-D simulations, the ZND detonation structure was used and the position of peak pressure is x = 1 cm and thus the expansion wave does not affect the leading shock propagation due to the backwall condition. To accurately and efficiently resolve the detonation propagation, dynamically adaptive mesh refinement was used in both A-SURF and AMROC. Mesh refinement or coarsening was determined by the local gradients of temperature, pressure and density. The base mesh size was 250 μm. After six level mesh refinement, the finest mesh size was around 3.9 μm. Since the detonation induction length is 0.19 mm, there were around 50 grid points within an induction length. The detonation propagation was adequately resolved and grid convergence was ensured, which was demonstrated through comparing results predicted by different finest mesh sizes (see figure A1 in the supplementary material).
3. Results and discussion
3.1. One-dimensional detonation propagation
First, we consider 1-D detonation propagation in a stoichiometric H2/air mixture (i.e. mixture 1 with s = 3.76) with the periodic sinusoidal wave distribution of reactant concentration. Different values of wavelength L and amplitude a were considered, and the effects of periodic mixture composition distribution on 1-D detonation propagation were examined. It is noted that the 1-D Chapman–Jouguet (CJ) detonation in a stoichiometric H2/air mixture is unstable and exhibits pulsating instabilities (Daimon & Matsuo Reference Daimon and Matsuo2007). The stability depends on the ratio between the imposed detonation velocity and the CJ velocity (i.e. the degree of overdrive). It also depends sensitively on the activation energy, as well as on the heat release and specific heat ratio. At higher overdrive (velocity larger than the CJ value), the detonation becomes stable. In this work, the detonation initiation is an overdriven state due to the employment of an ideal strong blast wave. After initiation, oscillation-free detonation propagation occurs around 5 < x < 25 cm. Moreover, as the overdriven detonation propagates forward, the speed of the leading shock wave decreases rapidly and recovers to CJ speed at x > 8 cm. In order to exclude the effects of aforementioned pulsating instabilities and overdriven state of detonation on detonation propagation through inhomogeneous mixtures, the lengths of homogeneous and inhomogeneous regions were set to be 8 and 18 cm, respectively.
We first fix the wavelength to be L = 16 mm. Figure 3 shows the evolution of pressure after the shock and the lead shock speed for three amplitudes of a = 0.2, 0.5 and 0.8. The dashed black lines correspond to the results calculated based on initial local reactant concentration given by (2.1). Specifically, we calculated a 1-D steady detonation by Cantera (Goodwin, Moffat & Speth Reference Goodwin, Moffat and Speth2016) and obtained the variations of the pressure after the shock (i.e. von Neumann spike pressure) in figure 3(a) and CJ speed in figure 3(b) with the initial local reactant concentration given by (2.1). The number, n, from 1 to 7, represents the nth period of sinusoidal distribution of mixture composition. The minus and plus represent, respectively, lower and higher chemical reactivity than the homogeneous mixture (see figure 2).
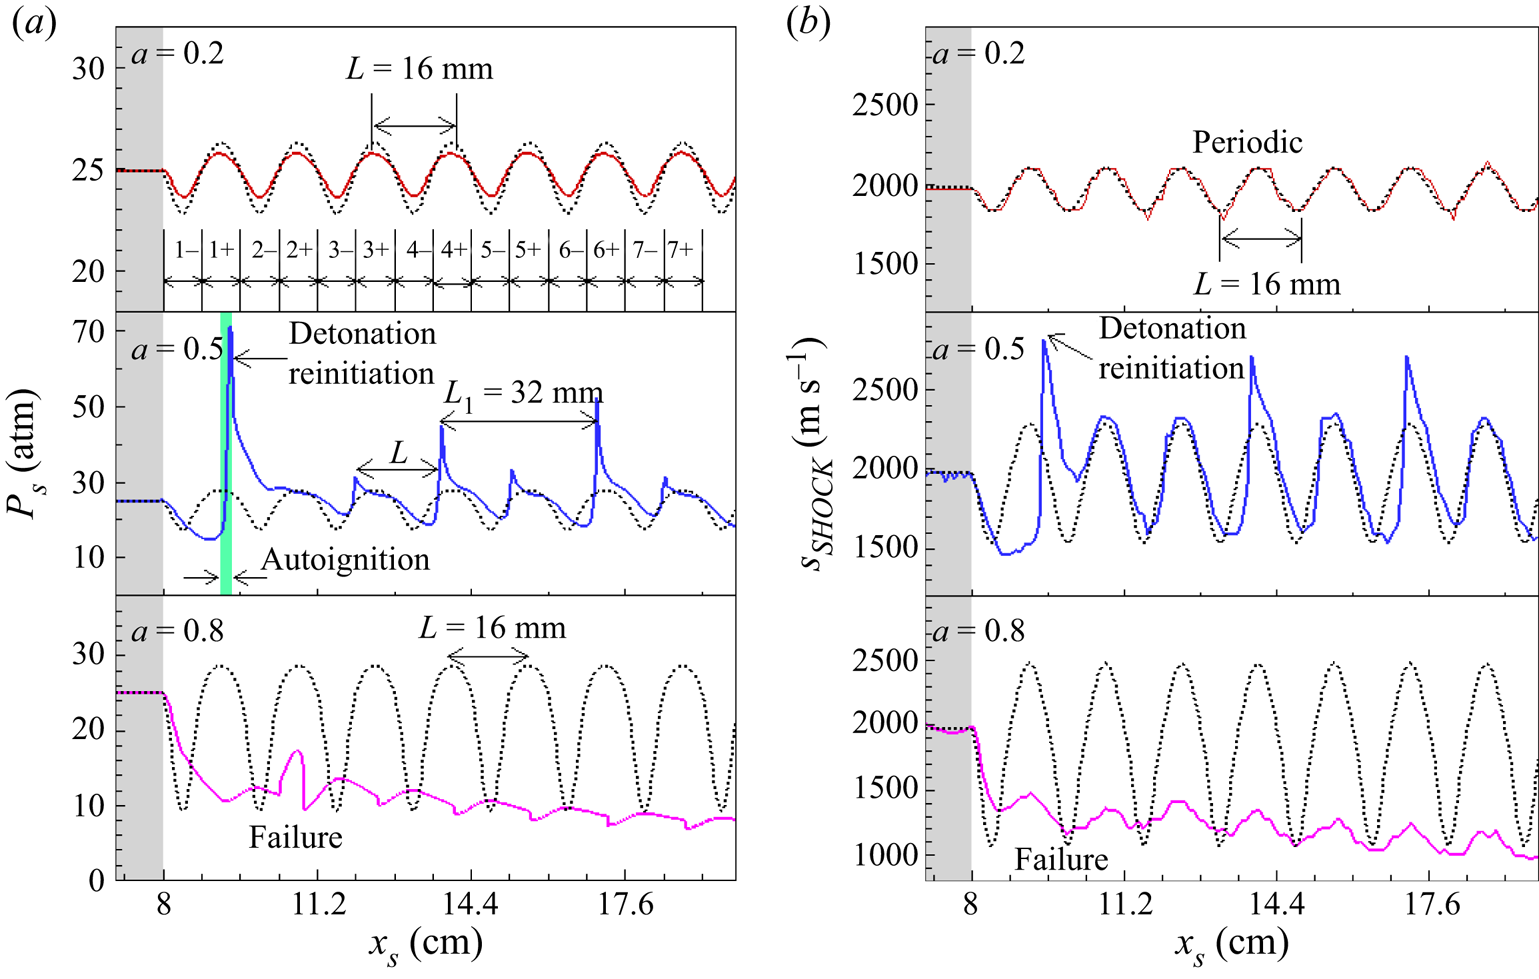
Figure 3. Change of (a) the pressure after the shock, PS, and (b) leading shock speed, SSHOCK, with the shock position, XS, for a fixed wavelength of L = 16 mm but different amplitudes of a = 0.2, 0.5 and 0.8 in mixture 1. The dashed black lines correspond to (a) the pressure at the von Neumann state and (b) the CJ speed calculated based on the initial local reactant concentration given by (2.1).
In the homogeneous region at x < xs = 8 cm, the detonation propagates at CJ speed of SSHOCK = VCJ = 1975 m s−1, and the leading shock pressure is equal to that of the von Neumann state, i.e. PS = PVN = 24.9 atm. In the inhomogeneous mixture with amplitude of a = 0.2, the detonation propagates with periodic fluctuations of pressure after the shock. The leading shock pressure changes from PS = 23.5 atm at x = 8.4 cm with the lowest fuel concentration to PS = 25.7 atm at x = 9.2 cm with the highest fuel concentration. The detonation propagates successfully in the inhomogeneous mixture, and its speed agrees well with the local CJ speed. Therefore, as expected, a low-amplitude disturbance in reactant concentration has little effect on detonation propagation.
When the amplitude is increased to a = 0.5, detonation quenching and reinitiation occur. The shock pressure decreases from PS = PVN = 24.9 atm at x = 8.0 cm to PS = 15.2 atm at x = 8.8 cm due to the relatively low concentration of H2/O2 in the first inhomogeneous region 1− (8.0 < x < 8.8 cm). The leading shock decouples from the reaction front and thereby the detonation quenches. When the leading shock propagates into region 1+ (8.8 < x < 9.6 cm) with relatively high concentration of H2/O2, local autoignition occurs around x = 9.2 cm. Consequently, the reaction front accelerates and catches up and couples with the leading shock, resulting in an overdriven detonation with PS = 70 atm and SSHOCK = 2766 m s−1. The detailed origins of this detonation quenching and reinitiation process are interpreted in figure 4. From region 2 to region 7, the shock pressure and shock speed are shown to change periodically with the sinusoidal distribution in reactant concentration at a wavelength of L = 16 mm. Moreover, after the detonation reinitiation is achieved, the variations of shock pressure and shock speed become regular and consecutive peaks appear at a constant distance of L 1 = 2L = 32 mm.

Figure 4. Temporal evolution of the pressure, temperature and heat release rate distributions during the first sinusoidal period for L = 16 mm and a = 0.5 in mixture 1.
When the amplitude is further increased to a = 0.8, figure 3(b) shows that the shock speed attenuates from SSHOCK = VCJ = 1975 m s−1 for x < 8.0 cm to SSHOCK = 1366 m s−1 at x = 8.6 cm in region 1−. The shock is too weak to trigger local autoignition/explosion in region 1+ with relatively high concentration of H2/O2. Consequently, the detonation quenches without reinitiation. Therefore, for each wavelength there is a critical amplitude, denoted as ac, below which the detonation can propagate successfully in the inhomogeneous mixture.
To interpret the detonation quenching and reinitiation observed in the inhomogeneous mixture, the temporal evolutions of pressure, temperature and heat release rate distributions for a = 0.5 are shown in figure 4(a). In region 1− with 8.0 < x < 8.8 cm (i.e. 38.7 < t < 43.7 μs), the pressure peak behind the leading shock immediately decreases from PS = PVN = 24.9 atm to PS = 15.2 atm due to the relatively low H2/O2 concentration. Both the temperature and heat release rate behind the leading shock gradually decrease. At t = 43.7 μs, the distance between the leading shock and reaction front is around 0.9 mm, which is much larger than the induction length of li = 0.19 mm. The decoupling between the leading shock and reaction zone indicates that the detonation quenches. When the leading shock propagates into region 1+ with 8.8 < x < 9.6 cm (i.e. 43.7 < t < 48.3 μs) with relatively high H2/O2 concentration, local autoignition occurs around t = 46.3 μs after the reactants are compressed by the leading shock. The pressure wave generated by heat release from this local autoignition accelerates the propagation of the reaction front. At the end of region 1+ (t = 48.3 μs and x = 9.6 cm), the reaction front couples with the leading shock, resulting in an overdriven detonation with peak pressure around 40 atm.
Figure 4(b) further shows the details of the processes of autoignition and detonation reinitiation in region 1+. During 43.7 < t < 45.8 μs, the leading shock pressure, temperature and heat release rate around the reaction front remain nearly constant. At t = 45.8 μs, due to the relatively high concentration of H2/O2 after the leading shock, local autoignition starts to occur, as indicated by the local pressure rise around x = 9.2 cm. The coherent enhancement between pressure wave and chemical reaction further increases the local heat release rate and pressure rise. On the other hand, in the region 9.2 < x < 9.4 cm, the reactant concentration decreases from  $({Y_{{\textrm{H}_2}}} = 0.41,{Y_{{\textrm{O}_2}}} = 0.051)$ to $({Y_{{\textrm{H}_2}}} = 0.34,{Y_{{\textrm{O}_2}}} = 0.043)$, which results in the spatial distribution of ignition delay time. According to the gradient theory by Zeldovich (Reference Zeldovich1980), detonation development can occur during the reaction front propagation in this region. Consequently, a strong local autoignition/explosion occurs around t = 47.2 μs, after which an overdriven detonation is developed around t = 47.6 μs. A similar phenomenon was observed by Qi et al. (Reference Qi, Dai, Yu and Chen2017) for detonation development caused by concentration non-uniformity.
For the above results, the wavelength for the periodic sinusoidal mixture composition distribution were fixed to be L = 16 mm while the amplitude changes. We also considered a fixed amplitude of a = 0.8 but different wavelengths of L = 2, 4, 8 and 16 mm. The results are shown in figure 5. For L = 2, 4 and 8 mm, successful detonation reinitiation is achieved at the end of region l+. However, detonation failure is observed for L = 16 mm. Therefore, for a given amplitude, detonation reinitiation can occur only for relatively small wavelengths. This is reasonable since longer shock decay occurs for longer wavelengths. Moreover, the double period propagation of the leading shock pressure is observed in figure 5 for all the cases that exhibit detonation reinitiation. A similar phenomenon is also found in the 2-D simulations presented later.

Figure 5. Change of the pressure after the shock, PS, with the shock position, xS, for a fixed amplitude of a = 0.8 but different wavelengths of L = 2, 4, 8 and 16 mm in mixture 1. The dashed black lines correspond to the pressure at the von Neumann state calculated based on the homogeneous mixture.
For successful detonation propagation in the inhomogeneous mixture, the detonation speed changes periodically as shown in figure 3. Here we assess how the sinusoidal mixture distribution affects the averaged detonation speed. Note that the mixture composition given by (2.1) ensures that the averaged fuel concentration in the inhomogeneous mixture is the same as that in the homogeneous mixture, for which the CJ speed is VCJ = 1975 m s−1. Figure 6 shows the averaged detonation propagation speed for different values of wavelength and amplitude of sinusoidal mixture distribution. It is observed that the periodic sinusoidal distribution of mixture composition has little influence (within 3 %) on the averaged detonation propagation speed once the successful detonation reinitiation is achieved in the inhomogeneous mixture. The averaged detonation speed deficit is shown to be smaller for shorter wavelength and smaller amplitude. Such a small detonation speed deficit is due to the incomplete consumption of the fuel and oxidizer during the detonation propagation in the inhomogeneous mixture, which also occurs in 2-D simulations (see figures 16 and 17 and related discussion). A similar detonation speed deficit was also reported by Calhoon & Sinha (Reference Calhoon and Sinha2005), Kessler et al. (Reference Kessler, Gamezo and Oran2012), Boeck et al. (Reference Boeck, Berger, Hasslberger and Sattelmayer2015) and Han, Wang & Law (Reference Han, Wang and Law2019).

Figure 6. Change of the normalized averaged detonation propagation speed, VAVG/VCJ, with the wavelength, L, for different amplitudes of a = 0.2, 0.3, 0.5, 0.8 and 1.0 in mixture 1.
3.2. Two-dimensional detonation propagation
In this subsection, we consider 2-D detonation propagation in inhomogeneous mixtures with periodic reactant concentration gradient. First, detonation reinitiation and double cellular structure in an inhomogeneous stoichiometric H2/air mixture are considered. Then, the effects of mixture composition and concentration distribution are assessed. Finally, the large cell size, quenching condition and detonation speed deficit are discussed.
3.2.1. Detonation reinitiation and double cellular structure
Figure 7 shows the numerical soot foils for a fixed wavelength of L = 2 mm but different amplitudes in the range of a = 0–0.7. The inhomogeneous region starts at xs = 6 cm, which corresponds to the vertical dashed black line in figure 7. The numerical soot foil is plotted by recording the maximum pressure reached at each grid point of the numerical domain. In the numerical soot foil, the pressure record is plotted on a linear grey scale with black/white colour corresponding to minimum/maximum pressure.

Figure 7. Numerical soot foils for a fixed wavelength of L = 2 mm and different amplitudes of a = 0, 0.1, 0.2, 0.3, 0.5 and 0.7 in mixture 1.
It is noted that the cell size gradually increases as the detonation propagates forward (see figure 7), even at x = 12 cm (see A2 in the supplementary material). This is because the initiated detonation is in an overdriven state and it first undergoes a decaying process and then gradually approaches the self-sustained propagation process. Due to the limit of computational cost, the length of the homogeneous and inhomogeneous regions cannot be very large. Consequently, this study was performed in a region where the detonation is still undergoing decay from its initially overdriven state, and thereby the corresponding results and conclusions were based on this consideration.
For the homogeneous mixture with a = 0, the detonation propagates at the CJ speed, and regular cellular structure develops. The cell size (height in the vertical direction) is λ 0 = 0.833 mm and the cell length (width in the horizontal direction) is w 0 = 1.66 mm at x = 6 cm. For the inhomogeneous mixture with a = 0.1, the cellular structure is nearly the same as that for a = 0. This indicates that a small perturbation in the reactant concentration has little effect on the detonation propagation. For a = 0.2, 0.3 and 0.5, a much larger cellular structure appears in the inhomogeneous region. The size of the large cellular structure does not change with the amplitude and it remains around λ = 2.5 mm. Before the appearance of the quasi-steady large-scale cellular structure, there is a transition region starting from xs = 6 cm. Figure 7 shows that the transition distance is around lt = 1.0 cm for a = 0.3. The transition distance is shown to decrease with amplitude and is discussed later in figure 15. When the amplitude is further increased to a = 0.7, the detonation quenches in the inhomogeneous region and the cellular structure gradually disappears. Therefore, similar to the 1-D case, there is also a critical amplitude, ac, above which the 2-D detonation quenches in the inhomogeneous mixture. It is noted that the results only for x < 9.3 cm are shown in figure 7. The cellular structure does not change for x > 9 cm and a = 0.3 (see figure A3 in the supplementary material).
Figure 8 compares the numerical soot foils for a fixed amplitude of a = 0.3 but different wavelengths of L = 1, 2 and 4 cm. It is observed that the size of large-scale cells in the inhomogeneous region (i.e. x > 6 cm) increases with the wavelength. For L = 4 mm, the large cell size is around λ = 5 mm, which is one order of magnitude larger than λ 0 = 0.833 mm for the homogeneous mixture. A further increase of the wavelength to L = 16 cm leads to detonation quenching in the inhomogeneous mixture for a = 0.3 (not shown here). Therefore, for each amplitude there is a critical wavelength, denoted as Lc, above which the detonation quenches in the inhomogeneous mixture. In addition, the influence of the periodic boundary conditions used in the present 2-D simulations was also investigated. To exclude the effect of periodic boundary conditions on the cellular structure, we calculated the case for a wavelength of L = 4 and amplitude of a = 0.3 at the same condition except using slip wall boundary conditions for the top and bottom sides instead of periodic boundary conditions. The results show that the large cell size is slightly smaller than for the results obtained when using periodic boundary conditions, but the transition processes are consistent, including the double cellular structure stage. This indicates that the use of periodic boundary condition is suitable.

Figure 8. Numerical soot foils for a fixed amplitude of a = 0.3 and different wavelengths of L = 1, 2 and 4 mm in mixture 1. The results for the homogenous mixture (i.e. a = 0) are shown together for comparison.
Furthermore, figure 8 shows that substructures appear within the large cellular structure in the range of 6.5 < x < 8 cm for L = 4 mm. A similar phenomenon has been found in 1-D simulations with double periodic propagation of the leading shock pressure (see figures 3 and 5 with L 1 = 2L). This is also similar to the double cellular structure appearing in a gaseous nitromethane/air mixture due to two-stage heat release rather than mixture composition non-uniformity (Presles et al. Reference Presles, Desbordes, Guirard and Guerraud1996).
In order to interpret the double cellular structure, the numerical soot foils and leading shock pressure for L = 8 mm and a = 0.3 are plotted in figure 9. As described for the 1-D simulations, the number, n, from 1 to 7, represents the nth period of sinusoidal distribution of mixture composition, and the minus and plus represent respectively lower and higher chemical reactivity than the homogeneous mixture (see figure 2).

Figure 9. (a) Numerical soot foils and (b) change of the pressure immediately after the leading shock, PS, with the shock position, xS, along the line at y = 0.6 cm for L = 8 mm and a = 0.3 in mixture 1.
In the homogeneous mixture (i.e. x < 6 cm), the original cellular structure with height of λ 0 = 0.833 mm and length of w 0 = 1.66 mm is observed. Figure 9(b) shows that in the homogenous mixture the distance between the two peak shock pressure positions is equal to the cell length of w 0 = 1.66 mm. When the detonation propagates into the first inhomogeneous region 1− with relatively low concentration of H2/O2, the shock pressure decreases and the original cellular structure gradually disappears. In region 1+, two local explosions occur around (x, y) = (6.6, 0.8 cm) and (6.7, 0.3 cm), as shown in figure 9(a). Furthermore, the peak shock pressure is recovered as shown in figure 9(b). Along the line y = 0.6 cm, figure 9(b) shows that the first local explosion occurs around x = 7.25 cm, where the local peak shock pressure appears. From region 1+ to 2+, detonation reinitiation happens. In region 3−, the shock pressure decreases again and the cellular structure tends to disappear, which is similar to the observation in region 1−. As the detonation propagates into region 3+, a much stronger second local explosion occurs, resulting in an overdriven detonation whose peak pressure is above 50 atm. Then, the large cellular structure with λ 1 ≈ 9.6 mm and w 1 ≈ 15.8 mm is formed due to the regular movement of secondary triple points. Within the large-scale cellular structure are substructures with λ 0 ≈ 0.833 mm and w 0 ≈ 1.66 mm, which are due to the movement of the original triple points as in the homogeneous mixture. Figure 9(a) shows that the strong collision between secondary triple points occurs in regions 3+, 5+, 7+, etc. Therefore, quasi-steady double cellular structures appear in the inhomogeneous mixture after a transition region. Such interesting cellular structure was also obtained by Radulescu & Maxwell (Reference Radulescu and Maxwell2011) in their study on detonation propagation across staggered cylinders and also in our previous study (Wang et al. Reference Wang, Huang, Deiterding, Chen and Chen2021) on detonation propagation across inert layers.
To further visualize and interpret the detonation reinitiation and the formation of double cellular structure in the inhomogeneous mixture, in figure 10 we plot the evolution of pressure, temperature and density distributions for the same case of L = 8 mm and a = 0.3. At t = 29.1 μs, the detonation is still in the homogenous region with x ≤ 6 cm and the original triple points are observed. At t = 31.1 μs, the transmitted shock is in region 1− (6.0 ≤ x ≤ 6.4 cm) and it decouples from the reaction zone. At t = 33.1 μs, the mixture in region 1+ (6.4 ≤ x ≤ 6.8 cm) with relatively high reactivity is compressed by the transmitted shock and consequently local explosions are induced. Meanwhile, as the transmitted shock propagates into the inhomogeneous mixture, it interacts with the density gradient, which generates Richtmyer–Meshkov instabilities and results in the interaction of the transverse shock waves (Radulescu, Sharpe & Law Reference Radulescu, Sharpe and Law2007; Ng et al. Reference Ng, Kiyanda, Morgan and Nikiforakis2015). The collisions between the transverse shock waves also induce local explosions. As the local explosions propagate outwards, a global explosion forms at t = 34.1 μs and then detonation reinitiation is successfully achieved with an irregular cellular structure, as shown in figure 9(a). As the detonation propagates forward, decoupling and coupling between the leading shock and reaction zone occur alternately in regions with lower and higher chemical reactivity.

Figure 10. Evolution of pressure P (top), temperature T (middle) and density ρ (bottom) contours for L = 8 mm and a = 0.3 in mixture 1.
Figure 10 shows that shock–reaction coupling occurs in region 2+ at t = 36.9 μs, while decoupling occurs in region 3− at t = 39.1 μs. This corresponds to the transition process. After the transition, the secondary explosions are shown to occur in region 3+ at t = 41.1 μs. The original and secondary triple points coexist at t = 50.1 μs, which generates the double cellular structures. Eventually, a quasi-steady detonation with double cellular structure propagates in the inhomogeneous mixture. The length of the large-scale cell is equal to the wavelength of the sinusoidal distribution of reactant concentration.
3.2.2. Effects of mixture composition and concentration distribution
The above results are for a stoichiometric H2/air mixture without nitrogen dilution (i.e. s = 3.76 in (2.1)). As mentioned previously, the induction length increases from li = 0.19 mm to li = 1.25 mm for the nitrogen-diluted mixture (i.e. s = 7 in (2.1)). Therefore, the cell size increases greatly for the nitrogen-diluted mixture (see table 1).
Figure 11 shows the numerical soot foils for detonation propagation in a nitrogen-diluted mixture with a fixed amplitude of a = 0.3 but different wavelengths of L = 1, 2 and 4 mm. The inhomogeneous region starts at x 0 = 30 cm (i.e. x 0 = 240li, where li is the induction length for the nitrogen-diluted mixture). For the homogeneous mixture, the cell size is λ 0 = 2.5 mm, which is much larger than λ 0 = 0.833 mm for H2/air without nitrogen dilution. For the inhomogeneous mixture, the cell size is shown to increase gradually with the wavelength. For L = 4 mm, the cell size is about λ = 5 mm, which is two times λ 0. Such change is similar to that for a stoichiometric H2/air mixture without nitrogen dilution (see figure 8). The comparison in cell sizes for mixtures without and with nitrogen dilution is shown in figure 13.

Figure 11. Numerical soot foils for a fixed amplitude of a = 0.3 and different wavelengths of L = 1, 2 and 4 mm in stoichiometric nitrogen-diluted mixture (i.e. mixture 2) with sinusoidal distribution. The results for the homogenous mixture (i.e. a = 0) are displayed together for comparison.
Besides the sine wave distribution of the mixture composition shown in figure 2, we also consider the square wave distribution, which is depicted in figure 12(a). The corresponding results are shown in figure 12(b) for a stoichiometric H2/air mixture without nitrogen dilution (i.e. s = 3.76 in (2.1)). The comparison among results shown in figures 12(b) and 7 indicates that sine wave and square wave distributions of the mixture composition have qualitatively similar effects. Specifically, for a = 0.3 a quasi-steady large cellular structure is observed after a transition region; while for a = 0.5, detonation quenching occurs in the inhomogeneous mixture. Quantitatively, the critical amplitude for the square wave distribution is smaller than that for the sine wave distribution of reactant concentration. This is consistent with previous results in Kuznetsov et al. (Reference Kuznetsov, Alekseev, Dorofeev, Matsukov and Boccio1998) and Boulal et al. (Reference Boulal, Vidal and Zitoun2016) that a smaller concentration gradient (corresponding to the sine wave distribution) is more favourable to detonation propagation, while a larger concentration gradient (corresponding to the square wave distribution) is more likely to induce detonation quenching.

Figure 12. (a) Schematic of the initial pressure and hydrogen mass fraction distributions for the case with square wave distribution of the mixture composition. (b) Numerical soot foils for a fixed period of L = 2 mm and different amplitudes of a = 0, 0.1, 0.3 and 0.5 in a stoichiometric H2/air mixture (i.e. in mixture 1) with square wave distribution of the mixture composition.
3.2.3. Large cell size, quenching condition and detonation speed deficit
The above results show that for mixtures both without and with nitrogen dilution and for both sinusoidal and square wave distributions, there exists a quasi-steady large cellular structure after a transition region; otherwise, the detonation quenches in the inhomogeneous mixture. To quantify the properties of detonation propagation in inhomogeneous mixtures, here we study the change of large-scale cell size, critical amplitude, transition distance and detonation speed deficit.
Figure 13 displays the change of the normalized large cell size, λ/λ 0, versus the normalized wavelength, L/λ 0. Here, λ 0 is the cell size for the corresponding homogeneous H2/O2/N2 mixture. For the H2/air mixture without nitrogen dilution, λ/λ 0 is shown to linearly increase with L/λ 0, and nearly identical results are observed for the distributions of sine wave (figure 2), square wave (figure 12a) and inert layer (figure 1d) (Wang et al. Reference Wang, Huang, Deiterding, Chen and Chen2021) distributions. This indicates that the large cell size is proportional to the wavelength of the mixture composition distribution. This is reasonable since the large cellular structure is mainly induced by periodic detonation reinitiation, as interpreted by figures 9 and 10. For the nitrogen-diluted mixture, the normalized large cell size is also linearly proportional to the normalized wavelength. Therefore, the change of the large cell size is independent of mixture composition and profile of the periodic gradient in reactant concentration.

Figure 13. Change of the normalized large cell size, λ/λ 0, with the normalized wavelength, L/λ 0, for different mixture compositions and concentration distributions (for inert layers, L is the spacing between two consecutive inert layers).
It is shown in figures 7 and 12(b) that successful detonation propagation in the inhomogeneous mixture is achieved only for an amplitude below some critical value. The critical amplitudes for different mixture compositions and concentration distributions are compared in figure 14. The critical amplitude is shown to decrease monotonically with the increase of the normalized wavelength. This is because a larger wavelength corresponds to a broader region with high nitrogen concentration and thus the detonation can be quenched more easily. It is also observed that the square wave distribution of reactant concentration always has a lower critical amplitude than the sine wave distribution. This was explained in the previous subsection and is due to the relatively large concentration gradient of the square wave distribution.

Figure 14. Change of the critical amplitude, ac, with the normalized wavelength, L/λ 0, for different mixture compositions and concentration distributions. Detonation quenching occurs for a > ac.
Figure 15 summarizes the change of normalized transition distance versus amplitude. With an increase of the amplitude, the normalized transition distance decreases monotonically. At lower amplitude, the detonation will not be quenched in the region with relatively lower reactant concentration, and thereby a smooth transition to the quasi-steady large cellular structure requires a relatively longer transition distance. On the contrary, at higher amplitude, the detonation can be quenched in the regions with low reactivity and reinitiation can occur afterwards, as shown in figures 9 and 10. An abrupt transition to the quasi-steady large cellular structure then requires relatively shorter transition distance. For a fixed amplitude, the normalized transition distance is shown to increase with the wavelength. This is because for a longer wavelength the large-scale cell size increases (see figures 8, 11 and 13) and the adjacent triple points of the original cells need more collisions to transform into secondary triple points. Moreover, the solid line in figure 15 indicates that the normalized transition distance becomes smaller when nitrogen dilution is introduced. The latter is due to the fact that λ 0 = 2.5 mm for the nitrogen-diluted mixture is much larger than λ 0 = 0.833 mm for the mixture without nitrogen dilution and detonation transition in an inhomogeneous mixture is therefore achieved more easily with nitrogen dilution.
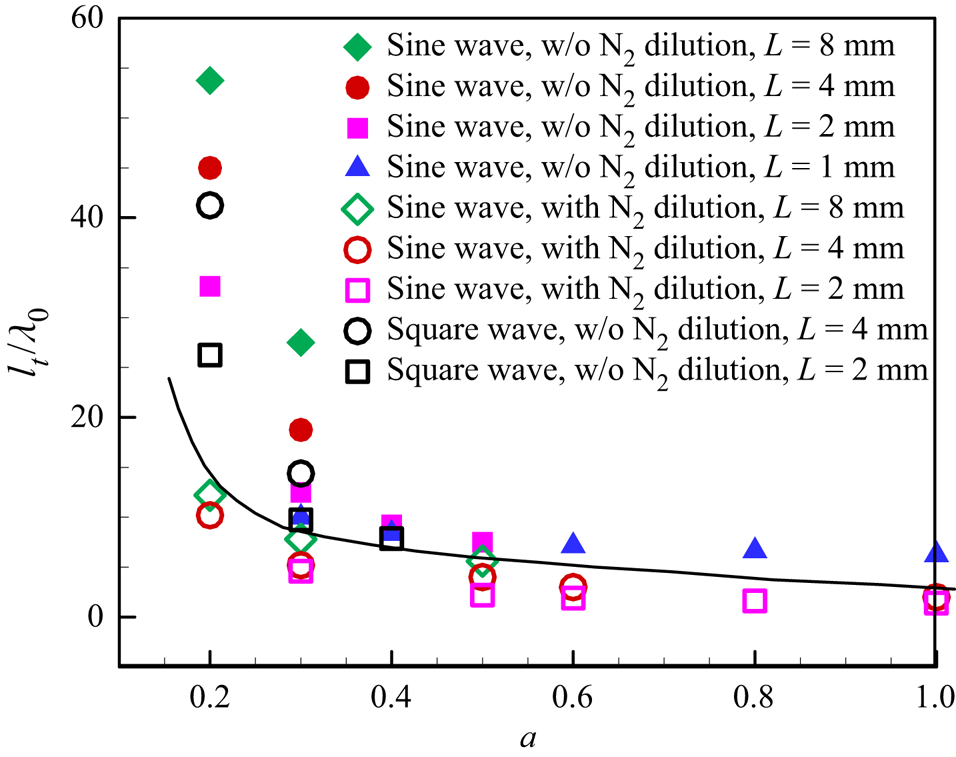
Figure 15. Change of the normalized transition distance, lt/λ 0, with the amplitude, a, for different mixture compositions and concentration distributions. The line separates results for mixtures without and with nitrogen dilution.
The effects of the mixture composition and concentration distribution on the averaged detonation propagation speed in inhomogeneous mixtures were also examined. The results are summarized in figure 16, in which VCJ is the CJ detonation speed of the homogeneous mixture and VAVG is the averaged detonation speed in the quasi-steady region (i.e. after the transition region) of the inhomogeneous mixture. Since averaged fuel concentration in the inhomogeneous mixture is the same as in the homogeneous mixture (see (2.1)), VAVG is close to VCJ. Nevertheless, the non-uniform distribution of the mixture composition results in a minor detonation speed deficit, which is within 3 % of the CJ value. Figure 16 shows that the deficit increases with the wavelength L and amplitude a. For a fixed normalized wavelength of L/λ 0 = 20, the value of VAVG/VCJ decreases from 98.6 % for a = 0.2 to 97.3 % for a = 0.3. For a fixed amplitude of a = 0.3, the value of VAVG/VCJ decreases from 99.5 % for L/λ 0 = 1.25 to 97.3 % for L/λ 0 = 20 in the H2/air mixture with sinusoidal distribution. Moreover, the square wave distribution and nitrogen dilution further decrease the averaged detonation propagation speed. This is because the detonation quenches more easily in inhomogeneous mixtures with square wave distribution of reactants and the detonation intensity becomes weaker after nitrogen dilution. Furthermore, the results for 2-D simulations are in agreement with those of the 1-D simulations as shown in figure 6.

Figure 16. Change of the normalized averaged detonation propagation speed, VAVG/VCJ, with the normalized wavelength, L/λ 0, for different mixture compositions and concentration distributions.
The above detonation speed deficit can be interpreted through comparing the amount of unburned hydrogen left behind the detonation,  ${Y_{{\textrm{H}_2},Left}}$, in the inhomogeneous mixture with that in the homogenous mixture, ${Y_{{\textrm{H}_2},Left,Hom}}$. Here ${Y_{{\textrm{H}_2},Left}}$ is calculated in the zone from x 0 to detonation front, in which the condition ${Y_{{\textrm{H}_2}}} > 0.002$ was satisfied. It is found that more unburned hydrogen is left behind the detonation in the inhomogeneous than in the homogenous mixture case, which is the cause of the detonation speed deficit shown in figure 16. Figure 17 plots the change of the normalized averaged detonation propagation speed versus the normalized unburned hydrogen mass fraction for different mixture compositions and concentration distributions. The solid line represents the theoretical CJ detonation speed calculated based on reactant concentration. Good agreement between theoretical and simulation results can be observed. This demonstrates that the detonation speed deficit in the inhomogeneous mixture is due to the amount of unburned fuel left behind the detonation with cellular structure.

Figure 17. Change of the normalized averaged detonation propagation speed, VAVG/VCJ, with the normalized unburned hydrogen mass fraction,  ${Y_{{\textrm{H}_2},Left}}/{Y_{{\textrm{H}_2},Left,Hom}}$, for different mixture compositions and concentration distributions.
Figures 13–17 quantitatively analyse the change of cell size, critical amplitude, transition distance and detonation speed deficit and good agreement is achieved for both mixture 1 without nitrogen dilution and mixture 2 with nitrogen dilution and for both sinusoidal and square wave distributions. This indicates that detonation propagating through inhomogeneous mixtures can be accurately simulated in the present study.
3.3. Comparison of 1-D and 2-D detonation propagation
The interaction of transverse waves is critical for detonation reinitiation in 2-D cases since the transverse waves combine with the leading compression shock in triple points, which induce autoignition/local explosion, as demonstrated in figure 10. However, in 1-D cases the autoignition is induced only by the leading shock compression (see figure 4). The absence of transverse waves in the 1-D cases results in a much longer duration and thereby distance for detonation reinitiation. In this respect, the multidimensional effect (which allows the existence of transverse waves) can greatly promote detonation reinitiation. Figure 10 shows that there are several unreacted pockets when the detonation propagates in the inhomogeneous mixture with periodic gradient in reactant concentration. These unreacted pockets reduce the total heat release and increase the unburned reactant concentration in the burned products. Though a similar phenomenon is also observed for 1-D simulations, the amount of unburned reactant in the 1-D cases is much less than that in the 2-D cases. In this respect, the multidimensional effect (which results in an increased amount of unburned reactant) prevents the detonation reinitiation. The inhibiting effects due to unburned reactants are stronger than the promoting effects due to transverse waves. Consequently, the 2-D cases exhibit smaller critical amplitude and wavelength for the periodic mixture composition distribution than the 1-D cases. Moreover, the averaged detonation propagation speed deficit in the 2-D cases is slightly larger than that in the 1-D cases due to a larger amount of unburned reactant in the multidimensional detonation structure.
In 1-D cases, a double periodic fluctuation of the peak pressure after the shock is observed (see figures 3 and 5). Similarly, a double cellular structure, consisting of substructures and a large-scale structure, is observed in 2-D cases (see figures 8 and 9). Therefore, the 1-D and 2-D cases exhibit similarity in the change of the original mode of detonation propagation in inhomogeneous mixtures with periodic gradient in reactant concentration. In inhomogeneous mixtures, the detonation speed, the number of triple points and the cellular structure adjust to the local mixture composition. Therefore, the quasi-steady detonation propagation with double periodic fluctuations of peak shock pressure and double cellular structure is observed after a transition distance in both 1-D and 2-D cases.
4. Conclusions
Detonation propagation in inhomogeneous H2/O2/N2 mixtures with a periodic gradient in reactant concentration were studied through 1-D and 2-D simulations considering detailed chemistry and transport. Two types of mixtures, hydrogen/air without and with nitrogen dilution, and two types of non-uniform mixture composition distribution, periodic sine wave and square wave, were considered. It was observed that a detonation can be completely quenched in the inhomogeneous mixture when the amplitude or wavelength of the periodic mixture composition distribution is above certain critical threshold values. The critical amplitude decreases monotonically with the increase of wavelength. Further, the square wave distribution of reactant concentration always has a lower critical amplitude than the sine wave distribution. For certain amplitude and wavelength values below their critical thresholds, detonation quenching and reinitiation were found to occur alternately in the inhomogeneous mixtures. Successful reinitiation can be triggered by local autoignition and explosion due to collision of transverse shock waves. There exists a double period of the leading shock pressure propagation for 1-D simulations and a double cellular structure consisting of a large-scale structure and smaller substructures, respectively due to the movement of the original and secondary triple points for 2-D simulations. The normalized large-scale cell size was found to be linearly proportional to the normalized wavelength but independent of the amplitude of non-uniform mixture composition distribution. Furthermore, a small detonation speed deficit in the inhomogeneous mixture was found and could be attributed to the amount of unburned fuel left behind the detonation with cellular structure.
This work reported two new physical phenomena for detonation propagation in inhomogeneous mixtures with periodic reactant concentration gradient: the alternately occurring detonation quenching and reinitiation and the double cellular structure consisting of a large-scale structure and smaller substructures. These two phenomena were interpreted in detail in this work. Although no experimental validation or general theory can yet be provided, this work is a first step towards a better understanding of these two phenomena. While only hydrogen has been considered, it is expected that similar phenomena would be observed for other fuels such as ethylene and n-decane. The influence of fuels and thermal conditions will be investigated in future works.
Supplementary material
Supplementary material is available at https://doi.org/10.1017/jfm.2022.1074.
Acknowledgements
We thank the anonymous reviewers for their comments/suggestions which helped to improve this paper. Y.W. and Z.C. thank Professor Xiaocheng Mi at Eindhoven University of Technology and Dr Pengfei Yang and Mr Jie Sun at Peking University for helpful discussions. The simulations were conducted on the High Performance Computing Platform of the Center for Life Science at PKU and on the Tianhe-2A supercomputer in Guangzhou, China.
Funding
This work was supported by the National Natural Science Foundation of China (no. 52176096).
Declaration of interests
The authors report no conflict of interest.


