


1. Introduction
Hypersonic turbulent boundary layers have become a topic of great interest amongst researchers in the fluid dynamics community due to their significant engineering applications (Gatski & Bonnet Reference Gatski and Bonnet2013; Theofilis, Pirozzoli & Martin Reference Theofilis, Pirozzoli and Martin2022). With the aid of advanced experimental equipment and apparatus, and powerful computational resources, abundant databases have been established for the purpose of accurate predictions of the aerodynamic performance of high-speed vehicles (Roy & Blottner Reference Roy and Blottner2006; Tichenor, Humble & Bowersox Reference Tichenor, Humble and Bowersox2013; Williams et al. Reference Williams, Sahoo, Baumgartner and Smits2018; Ceci et al. Reference Ceci, Palumbo, Larsson and Pirozzoli2022; Huang, Duan & Choudhari Reference Huang, Duan and Choudhari2022). Compared with incompressible flows, a crucial aspect that complicates the modelling and prediction of hypersonic turbulence is the compressibility effects (Smits & Dussauge Reference Smits and Dussauge2006; Duan, Beekman & Martin Reference Duan, Beekman and Martin2010, Reference Duan, Beekman and Martin2011), encompassing the influences caused by the variation of mean fluid properties (density and viscosity, for instance) due to aerodynamic heating, and the fluctuations of density and velocity divergence related to compression and expansion of the fluid elements (Gatski & Bonnet Reference Gatski and Bonnet2013). It has been pointed out by the well-known Morkorvin hypothesis (Morkovin Reference Morkovin1962) that the statistics in turbulent boundary layers without strong pressure gradients at free-stream Mach number lower than  $5$ manifest no evident deviation from those of the incompressible flows to the extent that the effects of mean density and viscosity variations are incorporated appropriately (Griffin, Fu & Moin Reference Griffin, Fu and Moin2021). This has been validated by previous studies (Duan et al. Reference Duan, Beekman and Martin2011; Cogo et al. Reference Cogo, Salvadore, Picano and Bernardini2022), in that the van Driest transformed mean velocity (Bernardini & Pirozzoli Reference Bernardini and Pirozzoli2011; Pirozzoli & Bernardini Reference Pirozzoli and Bernardini2011) and the density-weighted Reynolds stress are consistent with those of incompressible flows, even when the free-stream Mach numbers are as high as $12$ (Duan et al. Reference Duan, Beekman and Martin2011) and $20$ (Lagha et al. Reference Lagha, Kim, Eldredge and Zhong2011).
The genuine compressibility effects associated with the dilatational motions, on the other hand, were not commonly regarded as a subject of any great importance. It was not until the utilization of the Helmholtz decomposition in hypersonic turbulent boundary layers at Mach numbers higher than  $6$ that the contributions of the dilatational motions to the mean skin friction and the Reynolds shear stress were evaluated quantitatively to be finite levels of approximately $5\,\%$ and $10\,\%$, respectively (Yu, Xu & Pirozzoli Reference Yu, Xu and Pirozzoli2019; Yu & Xu Reference Yu and Xu2021). The pressure fluctuations, in comparison, are significantly enhanced and proportional to the square of the Mach number (Yu, Xu & Pirozzoli Reference Yu, Xu and Pirozzoli2020) in turbulence over adiabatic walls, with further increases in the presence of cooling walls (Zhang et al. Reference Zhang, Wan, Liu, Sun and Lu2022). Xu et al. (Reference Xu, Wang, Wan, Yu, Li and Chen2021b) found that the dilatational motions are responsible for the inter-scale energy transfer in the near-wall region, with the compressive and expansive motions contributing markedly to the direct and reverse energy transfer, respectively. Recent studies by Yu et al. (Reference Yu, Liu, Fu, Tang and Yuan2022a,Reference Yu, Liu, Fu, Tang and Yuanb) have systematically investigated the statistics and flow structures of the wall shear stress and heat flux fluctuations at different Mach numbers and wall temperatures, revealing that the root-mean-square of these two flow quantities increases monotonically with increasing friction Mach numbers, and that the spectra intensities at the mid-frequency range are gradually increasing and manifesting as secondary peaks. These findings highlight the importance of incorporating compressibility effects in the modelling and prediction of hypersonic turbulence.
The above-mentioned phenomena pertain to the emergence and predominance of dilatational structures, which are organized in the form of streamwise alternating positive and negative patterns within the viscous sublayer (Zhang et al. Reference Zhang, Wan, Liu, Sun and Lu2022), known as the ‘travelling wave packets’ (TWPs) (Yu et al. Reference Yu, Xu and Pirozzoli2019). These structures are spatially associated with low-speed streaks and strong vortical clusters (Yu & Xu Reference Yu and Xu2021; Yu et al. Reference Yu, Liu, Fu, Tang and Yuan2022b). Despite their crucial role, the origin of the dilatational motions in the form of TWPs remains unclear, as do their dynamical correlations with the vortical motions that populate the near-wall turbulence. This serves as the motivation for the present study. In this paper, we investigate the generation mechanisms of the dilatational TWP structures by exploiting direct numerical simulations (DNS) databases, conducting numerical experiments in minimal flow units (Schoppa & Hussain Reference Schoppa and Hussain2002; Deng & Xu Reference Deng and Xu2012), and analysing theoretically the governing equation of the velocity divergence. Considering that the dilatational TWP structures lie primarily close to the wall, we scrutinize each stage of the most crucial dynamic processes in the near-wall region, namely the regeneration cycle between the velocity streaks and streamwise vortices, to trace the generation of the dilatational motions and their interaction with the solenoidal vortical ones.
The rest of the paper is organized as follows. Section 2 presents the morphology and kinetic depictions of the dilatational motions via the instantaneous and conditionally averaged fields surrounding them. Section 3 discusses the transient growth of the velocity streaks and the primary flow dynamics therein, and the necessary condition of the sustainment of the dilatational TWP structures. Concluding remarks are given in § 4.
2. Kinematic depictions
2.1. Numerical settings and flow parameters
We consider a turbulent boundary layer at the free-stream Mach number  $M_\infty = U_\infty / a_\infty = 5.84$ and the Reynolds number $Re_\infty = \rho _\infty U_\infty \delta _{in}/\mu _\infty = 32\,300$ over a flat plate with temperature $T_w = 1.77 T_\infty = 0.25 T_r$. Here, $U_\infty$ and $a_\infty$ are the free-stream velocity and sound speed, $\rho _\infty$, $T_\infty$ and $\mu _\infty$ are the free-stream density, temperature and viscosity, and $\delta _{in}$ is the nominal boundary layer thickness at the turbulent inlet. The recovery temperature $T_r$ is the wall temperature with the adiabatic thermal boundary condition. The turbulence is governed by the Navier–Stokes equations of the compressible Newtonian perfect gas, written as
 $$\begin{gather} \frac{\partial \rho}{\partial t} + \frac{\partial \rho u_j}{\partial x_j}=0, \end{gather}$$
 $$\begin{gather}\frac{\partial \rho u_i}{\partial t} + \frac{\partial \rho u_i u_j}{\partial x_j}=-\frac{\partial p}{\partial x_i} + \frac{\partial \tau_{ij}}{\partial x_j}, \end{gather}$$
 $$\begin{gather}\frac{\partial \rho E}{\partial t} + \frac{\partial \rho E u_j}{\partial x_j}=-\frac{\partial p u_j}{\partial x_j} + \frac{\partial \tau_{ij} u_i}{\partial x_j} -\frac{\partial q_j}{\partial x_j}, \end{gather}$$
with the following constitutive equation and Fourier's law of Newtonian flows to determine the viscous stress  $\tau _{ij}$ and molecular heat conduction $q_j$ as
 \begin{equation} \tau_{ij} = \mu \left(\frac{\partial u_i}{\partial x_j} + \frac{\partial u_i}{\partial x_j} \right) - \frac{2}{3}\,\mu\,\frac{\partial u_k}{\partial x_k}\,\delta_{ij},\quad q_j =- \kappa\,\frac{\partial T}{\partial x_j}, \end{equation}
and the state equation of the perfect gas as
 \begin{equation} p=\rho R T, \quad E=C_V T+\tfrac{1}{2} u_i u_i. \end{equation}
The velocity component in the  $x_i$ direction ( $i=1, 2, 3$, also referred to as streamwise ( $x$), wall-normal ( $\kern0.7pt y$) and spanwise ( $z$)) is denoted by $u_i$ (or $u$,
$u$,  $v$ and $w$). The density, pressure, temperature and total energy are represented by $\rho$, $p$,
$p$,  $T$ and $E$, respectively. The dynamic viscosity $\mu$ is determined by Sutherland's law, and the heat conductivity as $\kappa = C_p \mu /Pr$, with $R$ denoting the gas constant, $C_p$ the specific heat per constant pressure, $C_V$ the specific heat per constant volume, $\gamma$ the ratio of specific heat, and $Pr$ the molecular Prandtl number. The turbulent inlet is generated by the digital filtering technique proposed by Klein, Sadiki & Janicka (Reference Klein, Sadiki and Janicka2003). At the wall, no-slip and no-penetration conditions and an isothermal condition for temperature are adopted. A periodic condition is utilized in the spanwise direction. No reflection conditions are enforced at the inlet, upper and outflow boundaries so as to diminish the influences of numerical errors on the flow within the computational domain (Pirozzoli & Colonius Reference Pirozzoli and Colonius2013).
Other notations used in this paper are introduced as follows. The flow quantities normalized by the wall shear stress  $\tau _w$, density $\rho _w$ and viscosity $\mu _w$ are marked by the superscript $+$. The friction Reynolds number $Re_\tau = \rho _w u_\tau \delta /\mu _w$ is approximately 450, with $u_\tau = \sqrt {\tau _w/\rho _w}$ the friction velocity. The ensemble average of a flow quantity is denoted by a bar, and the corresponding fluctuations by a prime. The density average is represented by a tilde, and the fluctuations by a double prime.
The DNS are carried out with OPENCFD-SC developed by Liang & Li (Reference Liang and Li2013). A ninth-order upwind scheme and an eighth-order central scheme are adopted to approximate the convective and viscous terms, and the third-order TVD (total variation diminishing) Runge–Kutta scheme is utilized for time advancement.
The sizes of the computational domain in the three directions  $(L_x, L_y, L_z)$ are $(106, 9, 10)\delta _{in}$, discretized by $(3000, 330, 320)$ grids, respectively. The grids are distributed uniformly in the streamwise and spanwise directions with intervals $\Delta x^+ = 6.5$ and $\Delta z^+ = 5.7$, and stretched by a hyperbolic sine function in the wall-normal direction, with the first grid off the wall $\Delta y^+_w = 0.7$ and the grid interval in the free-stream $\Delta y^+_\infty \approx 9.6$. The simulation has been run for a time period of approximately $500 \delta _{in}/U_\infty$ before the turbulence reaches a fully developed and statistically equilibrium state, and for another $500 \delta _{in}/U_\infty$ to obtain the converged flow statistics. The results reported here are averaged in the spanwise and time directions, and also in the streamwise direction within the subdomain of $(70\unicode{x2013}90) \delta _{in}$.
In figure 1, we provide the wall-normal distribution of some basic flow statistics, compared with those reported by Zhang et al. (Reference Zhang, Duan and Choudhari2018) with the same Mach number but a higher Reynolds number as a validation. Herein, the van Driest transformed mean velocity is calculated by the integration
 \begin{equation} u^+_{VD} = \frac{1}{u_\tau} \int^{\tilde u}_0 \sqrt{\frac{\bar \rho}{\bar \rho_w}} \,{\rm d} \tilde u. \end{equation}
The Reynolds stresses normalized by the mean wall shear stress  $\tau _w$ is defined as
 \begin{equation} R^+_{ij} =\frac{\overline{\rho u''_i u''_j}}{\tau_w}. \end{equation}
The van Driest transformed mean velocity and mean temperature are shown in figures 1(a,b), along with the reference data. The Reynolds stresses shown in figure 1(c) conform reasonably well with those reported by Zhang et al. (Reference Zhang, Duan and Choudhari2018) in the outer region (above  $y \approx 0.4 \delta$) but manifest consistent abatement in magnitudes for all components below $y \approx 0.3\delta$, which should probably be ascribed to the slightly lower Reynolds number in the present study. The root-mean-square (marked by the subscript ‘ $rms$’) of the vorticities $\omega '_i$ also show their consistency with the reference data, further validating the present DNS results. The velocity divergence ( $\theta ' = \partial u'_i /\partial x_i$), a direct indicator of compressibility effects, attains a maximum with magnitude of the same order as the vorticity at the wall, away from which it gradually decays to an insignificant level. This has been observed by some previous studies (Yu & Xu Reference Yu and Xu2021; Baranwal, Donzis & Bowersox Reference Baranwal, Donzis and Bowersox2022), further consolidating the significance of compressibility effects in hypersonic turbulence over cold walls in the viscous sublayer.

Figure 1. Wall-normal distributions of (a)  $u^+_{VD}$, (b) $\bar T/T_\infty$, (c) $R^+_{ij}$, and (d) $\omega '^+_{x_i,rms}$ and $\theta '^+_{rms}$. Lines indicate present DNS; symbols indicate results by Zhang, Duan & Choudhari (Reference Zhang, Duan and Choudhari2018).
2.2. Instantaneous and averaged flow structures
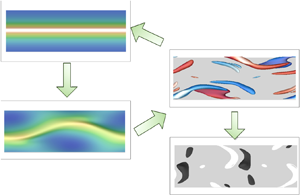
We first present the instantaneous distributions of the flow structures in hypersonic boundary layers over a cold wall as a direct impression of their organizations. Figure 2 displays the instantaneous distribution of dilatational and vortical structures. The former are visualized by the isosurfaces of positive and negative velocity divergence  $\theta '=\partial u'_i/\partial x_i$, and the latter by those of the second invariant of the velocity gradient tensor $Q$. The morphology of these structures resembles those reported in the previous studies. The vortical motions align mainly in the streamwise direction in the near-wall region, as is observed commonly in canonical wall-bounded turbulence (Jiménez Reference Jiménez2013). There also manifest vortices aligned in the spanwise direction close to the wall, corresponding to the stronger internal shear layer with the decreasing wall temperature (Yu & Xu Reference Yu and Xu2021). The dilatational motions are organized as streamwise positive and negative alternating structures close to the wall, namely the TWP structures, as discovered by Yu et al. (Reference Yu, Xu and Pirozzoli2019) and Xu et al. (Reference Xu, Wang, Wan, Yu, Li and Chen2021a) in hypersonic turbulent channels and boundary layers. These structures appear mostly beneath the comparatively strong vortical clusters, as highlighted by some boxes in figure 2. We can infer from their spatial association that the generation of the TWPs should probably be related to strong bursting events that are, in a sense, related to the clusters of vortices (Kim, Kline & Reynolds Reference Kim, Kline and Reynolds1971; Robinson Reference Robinson1991; Tardu Reference Tardu1995; Adrian Reference Adrian2007; Hack & Schmidt Reference Hack and Schmidt2021) incorporating sweeping and ejections.

Figure 2. Top view of instantaneous fields  $Q=10$ (green), $\theta ' = \pm 0.9$ (red positive, black negative).
A direct and intuitive inference of the generation of dilatational TWP structures is probably that ejections bring the fluid upwards, leading to the expansion of fluid elements, while sweeping events cause compression. This process is similar to the ‘lift-up’ process that forms low- and high-speed streaks. To verify this postulation, we present the averaged velocity and vortical structures surrounding the strong compressive and expansive events at  $y^+=10$ in figures 3(a,b), denoted by $\langle \varphi \rangle$. They are obtained by performing ensemble averaging of boxes whose centres satisfy the conditions $\theta ' > \theta '_{rms}$ and $\theta ' < -\theta '_{rms}$, respectively. As shown in figure 3(a,b), the vortical structures of the averaged flow field in the vicinity of the strong expansive events ( $\theta '(y^+=10) > \theta '_{rms}$) close to the wall are organized as a reversed hairpin vortex with its head located close to the wall, whereas those under the condition of strong compressive events ( $\theta '(y^+=10) < -\theta '_{rms}$) are organized as a hairpin vortex whose head is located at $y^+\approx 50$. The legs of these vortices are connected with the quasi-streamwise vortices downstream (if the criteria are lowered) with the same rotational directions, bringing the low-speed fluid upwards. These hairpin vortices are usually representative of strong bursting events encompassing strong sweeps and ejections (Kim & Moin Reference Kim and Moin1986; Adrian Reference Adrian2007).

Figure 3. Averaged flow fields conditioned by (a,c,e)  $\theta '(y^+=10) > \theta '_{rms}$ and (b,d,f) $\theta '(y^+=10) < -\theta '_{rms}$. (a,b) Isosurfaces of $\langle \lambda _{ci} \rangle = 0.4 U_\infty /\delta _{in}$ (green) and $\langle \theta ' \rangle = \pm 1.0 U_\infty /\delta _{in}$ (red positive, black negative). (c–f) The $\Delta z=0$ plane, flooded with $\theta '$, lines: (c,d) $\langle u' \rangle$ ( $-0.1 \sim + 0.01 \sim 0.1$) (the contour levels are set from $-0.1$ to $+0.1$ with the interval of $0.01$), (e,f) $\langle v' \rangle$, ( $-0.02 \sim + 0.002 \sim 0.02$), solid positive, dashed negative.
The averaged streamwise and wall-normal velocities  $\langle u' \rangle$ and $\langle v' \rangle$ at the centre plane $\Delta z^+ =0$ are shown in figures 3(c–f). Surprisingly, whichever the event is, the strong dilatational motions are located beneath the streamwise elongated low-speed region, corresponding to the low-speed streaks in the instantaneous flow fields. The wall-normal velocity $\langle v' \rangle$ also shows some intriguing features. Expectedly, the expansive and compressive motions are related to the upward and downward vertical motions close to the wall, respectively. As it approaches further away from the wall ( $\kern0.7pt y^+ \gtrsim 30$), the values of $\langle v' \rangle$ are positive for both cases, corresponding to ejections. This is in stark contrast to the intuitive depictions that expansive and compressive events are caused by ejections and sweeps, but consistent with the previous observations by Yu et al. (Reference Yu, Xu and Pirozzoli2019, Reference Yu, Liu, Fu, Tang and Yuan2022b), disproving that the sweeping and ejections, or equivalently the ‘lift-up’ processes, are responsible for the generation of dilatational TWP structures. Indeed, simple reasoning without reference to the governing equations often leads to paradoxical conclusions. Therefore, it is necessary to conduct detailed investigations in terms of flow dynamics.
3. Numerical experiments and flow dynamics
The proximity of dilatational TWP structures to the wall suggests that it is probably straightforward to investigate their dynamical association with the near-wall turbulent motions. It is well recognized that the near-wall turbulence can be regarded as the regeneration cycles between the velocity streaks and quasi-streamwise vortices (Hamilton, Kim & Waleffe Reference Hamilton, Kim and Waleffe1995; Jiménez & Pinelli Reference Jiménez and Pinelli1999; Schoppa & Hussain Reference Schoppa and Hussain2002; Jiménez Reference Jiménez2013; Hwang & Bengana Reference Hwang and Bengana2016). Such cycles can be summarized as (i) the amplification of the velocity streaks through the ‘lift-up’ effects of the streamwise vortices, (ii) the transient growth and/or the instability of the perturbations on the streaks, and (iii) the breakdown of streaks accompanied by the regeneration of the streamwise vortices. It seems that the velocity streaks are crucial in all the processes, and probably also in the generation of dilatational TWP structures. This is supported by the conditional averaged results in figures 3(a,b), which is consistent with the discovery of Yu et al. (Reference Yu, Xu and Pirozzoli2019) and Xu et al. (Reference Xu, Wang, Wan, Yu, Li and Chen2021a) that dilatational motions tend to congregate beneath the low-speed streaks. This does not contradict the observations herein, for the bursting events that induce vortical clusters are usually related to the streak breakdown (Bogard & Tiederman Reference Bogard and Tiederman1986; Tardu Reference Tardu1995; Jiménez & Pinelli Reference Jiménez and Pinelli1999), a fundamental process in the near-wall regeneration cycle.
3.1. Transient growth on a steady streak
Section 2 demonstrates that the formation of the dilatational TWP structures should be attributed, at least directly, not to the ‘lift-up’ effects, but probably to the streak breakdown. Such a process is initiated by the instability or transient growth of the streaks and will be the main focus of this subsection.
We consider the transient growth of two specific types of perturbations on temporally steady velocity streaks, namely those inducing the streak meandering and the dilatational TWP structures. For that purpose, we consider the two-dimensional base flow  $u_b$ as the superposition of the mean profiles and a streamwise and temporally invariant velocity streak $u_b(y,z) = \bar u(y) + u_s (y,z)$, where $u_s$ is determined according to the morphology of the velocity streaks (Schoppa & Hussain Reference Schoppa and Hussain2002; Deng & Xu Reference Deng and Xu2012)
 \begin{equation} u_s = A_s\,f(y) \cos(2 {\rm \pi}z/l_z),\quad f(y)=y/y_p \exp((1-y^2/y^2_p)/2), \end{equation}
with amplitude  $A_s = 6.4 u_\tau$. The peak location and the spanwise width are set as $y^+_p = 15$ and $l^+_z \approx 180$ according to the peak of the premultiplied spanwise spectra of $u'$ (Yu & Xu Reference Yu and Xu2021) that represent the most intense location and the characteristic length scale of the velocity streaks, which are wider than those in incompressible turbulence. The density and temperature are set as their mean values $\bar \rho$ and $\bar T$ without incorporating initial perturbations. The perturbations inducing the streak meandering are initiated by the spanwise velocity
 \begin{equation} v'(t=0)=0,\quad w'(t=0)=A_w\,f(y) \sin(2 {\rm \pi}k_x x/l_x), \end{equation}
referred to as case LW (abbreviation for ‘linear  $w'$ perturbation’), and those inducing the dilatational TWPs by the wall-normal velocity
 \begin{equation} v'(t=0)=A_v\,f(2y) \sin(2 {\rm \pi}k_x x / l_x),\quad w'(t=0)=0, \end{equation}
referred to as case LV (abbreviation for ‘linear  $v'$ perturbation’). Transient growth simulations with the fixed base flow are performed with the streamwise and spanwise periodic conditions to obtain the temporal evolution of these two types of perturbations. The streamwise and spanwise sizes of the computational domain are set to be $l^+_x = 2000$ and $l^+_z \approx 180$, respectively. A series of streamwise wavenumbers with $k_x=1 \sim 8$ for case LW and $k_x=7 \sim 14$ for case LV are considered, covering the streamwise length scales of the quasi-streamwise vortices and the dilatational TWP structures (Yu & Xu Reference Yu and Xu2021; Huang et al. Reference Huang, Duan and Choudhari2022). The initial amplitude of the perturbation is set as $A_w=A_v \approx 0.25 u_\tau \approx 0.01 U_\infty$.
The amplification rates of the volume-averaged turbulent kinetic energy  $E_k$ of the perturbations, defined as $G(t) = E_k(t)/E_k(0)$, are shown in figure 4(a). For case LW with $k_x=4$, the $w'$ perturbations are amplified monotonically and reach such high levels that the nonlinear effects cannot be disregarded. After the initial transient growth, $G(t)$ increases exponentially, suggesting that the instability of the low-speed streak at this strength when perturbed by the streamwise alternating $w'$ leads to its meandering. The instantaneous flow field at $t^+=250$ in figure 4(c) shows that the streaks are ‘pushed over’ and the quasi-streamwise vortices are generated, consistent with the phenomena in incompressible flows (Schoppa & Hussain Reference Schoppa and Hussain2002; Xu et al. Reference Xu, Deng, Huang and Cui2013; Wang, Huang & Xu Reference Wang, Huang and Xu2015; Jiménez Reference Jiménez2018). The dilatational structures in this case are much weaker and follow the patterns of the vortices, but no feature of the TWPs can be observed. Similar conclusions can be obtained for other streamwise wavenumber cases with $k_x = 1\unicode{x2013} 8$ (grey lines in figure 4a), amongst which the perturbations with $k_x=4$ are the most unstable or the least stable.

Figure 4. (a,b) Linear transient growth of perturbations  $G(t)$ (black and grey, cases LW; red and light red, cases LV) (a) with and (b) without the density and temperature streaky structures as the base flow. (c,d) Flow structures at $t^+ = 200$, isosurfaces of $Q$ (green), $u^+=6$ (translucent blue) and $\theta '$ (red positive, black negative) for (c) case LW, $Q=2$, $\theta ' = \pm 0.25$, and (d) case LV, $Q=0.2$, $\theta ' = \pm 0.4$.
Regarding case LV, the  $v'$ perturbations with $k_x=10$ are capable of triggering the dilatational TWP structures (figure 4d). However, the amplification rate $G(t)$ keeps decreasing, despite its resemblance to the Mack mode (second mode) that is the least stable and triggers the transition of hypersonic laminar boundary layers (Fedorov Reference Fedorov2011; Sharma & Girimaji Reference Sharma and Girimaji2023), thereby excluding the emergence of dilatational TWPs being its inherent instability or the transient growth of the acoustic modes (Zhang et al. Reference Zhang, Wan, Liu, Sun and Lu2022). The results are qualitatively the same if the streamwise wavenumber $k_x$ is set within the range $k_x = 7\unicode{x2013}14$ (light red dashed lines in figure 4a). Based on the observations above, we conclude that the transient growth of linear perturbations – either the spanwise or the wall-normal velocity – on the velocity streaks is not responsible for the generation of the dilatational TWP structures.
The discussions above did not incorporate the thermodynamic flow quantities in the two-dimensional base flows. It is well known that the streamwise velocity fluctuations are highly correlated with the density and temperature fluctuations (Zhang et al. Reference Zhang, Bi, Hussain and She2014), both organized as the streamwise elongated streaks in the near-wall region (Pirozzoli & Bernardini Reference Pirozzoli and Bernardini2011). It is possible that these flow quantities influence the processes of the perturbation amplification. Henceforth, we consider the streaks of the temperature and the density streaks in the two-dimensional base flow as
 \begin{equation} T_s = \frac{\partial \bar T}{\partial \bar u}\,u_s,\quad \rho_s = - \frac{\bar \rho}{\bar T} T_s. \end{equation}
The temporal evolutions of  $G(t)$ under such base flows are shown in figure 4(b). Compared with figure 4(a), it appears that the perturbation amplifications are less intense when the temperature and density streaks are involved, suggesting that the velocity streaks accompanied by the density and viscosity stratifications are more stable. Nevertheless, the conclusions are qualitatively the same as those obtained previously, that the $w'$ perturbations are capable of intensifying via the transient growth, while the $v'$ perturbations can only decay monotonically, showing no evidence of triggering higher magnitudes of perturbations.
We note that the TWPs and the Mack modes in hypersonic turbulent boundary layer transition share many similar features. For example, (i) they share the same morphology, behaving as the travelling waves with a certain wavenumber, (ii) they are both located close to the wall, (iii) the TWPs are intensified by the rising Mach number and the cooling wall (Yu et al. Reference Yu, Xu and Pirozzoli2019; Unnikrishnan & Gaitonde Reference Unnikrishnan and Gaitonde2021; Yu & Xu Reference Yu and Xu2021), and the second mode is destabilized by these factors (Mack Reference Mack1984; Stetson & Kimmel Reference Stetson and Kimmel1992), and (iv) they can both enhance the wall pressure fluctuations (Casper, Beresh & Schneider Reference Casper, Beresh and Schneider2014; Yu et al. Reference Yu, Xu and Pirozzoli2020; Unnikrishnan & Gaitonde Reference Unnikrishnan and Gaitonde2021). It is probably the different base flows that lead to the disparity in the growth of these perturbations. Rigorous proof is needed to conclude that the Mack modes and the TWPs are the same type of coherent structures, which is beyond the scope of the present study.
3.2. Flow dynamics in a regeneration cycle
We further discuss the evolution and breakdown of the velocity streaks. We perform numerical simulations (named as case NW, short for ‘nonlinear  $w'$ perturbation’) similar to case LW in § 3.1, with the exception that the base flow is set as the mean profiles $\bar u$, $\bar \rho$ and $\bar T$, and enforced to be steady, thereby allowing the meandering and breakdown of the velocity streaks. The initial perturbations are the superposition of the velocity streaks and the streamwise alternating spanwise velocity
 \begin{equation} \left.\begin{array}{c@{}} u'(t=0) = A_s\,f(y) \cos(2{\rm \pi} k_z z/l_z),\\[3pt] v'(t=0) =0, \\[3pt] w'(t=0) =A_w\,f(y)\sin(2 {\rm \pi}k_x x/l_x), \end{array}\right\} \end{equation}
with  $k_z$ being the spanwise wavenumber. The streamwise length of the domain is set as $l^+_x=2000$, the streamwise wavenumber of the perturbation as $k_x = 4$, the spanwise width as $l^+_z = 360$, and the spanwise wavenumber as $k_z = 2$, containing two velocity streaks in the spanwise direction (Yu & Xu Reference Yu and Xu2021). The amplitudes of the streaks and the spanwise velocity are $A_s= 6.4 u_\tau$ and $A_w = 1.2 u_\tau$ so that the intensities of the perturbations are the same as the DNS results at $y^+=15$. Such an initial perturbation field is divergence-free, so the dilatational motions shown later are generated by flow dynamics instead of being initially introduced artificially. The reason for using a wider domain will be explained later.
Figure 5(a) shows the temporal evolution of  $E_k$ below $y^+=60$, which is split as two portions $E_{ks}$ and $E_{kw}$. The former is defined as
 \begin{equation} E_{ks}(t) = \frac{1}{l_x l_z \delta} \int^{l_z}_0 \int^{y^+=50}_0 \int^{l_x}_0 \frac{1}{2}\,\langle \rho \rangle_x \langle u'' \rangle^2_x \,{\rm d}\kern0.06em x\, {\rm d} y \,{\rm d} z, \end{equation}
with  $\langle \cdot \rangle _x$ being the streamwise average, representing the energy of the streamwise elongated straight streaks; the latter is $E_{kw}(t) = E_k(t) - E_{ks} (t)$, the energy of wavy structures (Doohan, Willis & Hwang Reference Doohan, Willis and Hwang2021). Figure 5(b) displays the temporal evolution of vortical enstrophy $\epsilon ^+_\omega$ (the volume-averaged intensity of turbulent vorticity vector $|\omega _i|^2$) and the dilatational enstrophy $\epsilon ^+_\theta$ (the volume-averaged intensity of velocity divergence $\theta '^2$). The initially introduced velocity streaks gradually decay while the wavy structures amplify, with $E_{ks}$ attaining local minimum and $E_{kw}$ local maximum at $t^+_1$. At this time instant, the meandering of the streaks and the quasi-streamwise vortices are the most intense, as shown in figure 5(c). As the perturbations continue to evolve, $E_{ks}$ increases and $E_{kw}$ decreases, reminiscent of the regeneration/reamplification of the streamwise elongated streaks rolled up by the quasi-streamwise vortices (Xu et al. Reference Xu, Deng, Huang and Cui2013; Hwang & Bengana Reference Hwang and Bengana2016). At $t^+_2$, the former reaches a local maximum and the latter a local minimum, and they retain nearly constant value for a time period of approximately $10 \delta _\nu /u_\tau$. During this time, the vortical enstrophy $\epsilon ^+_\omega$ continues to increase while the dilatational enstrophy $\epsilon ^+_\theta$ starts to decrease. The instantaneous field at $t^+_2$ in figure 5(d) shows that the velocity streaks are less meandering, the vortices are more streamwise-aligned, and the dilatational structures are weakened, compared to those at $t^+_1$.

Figure 5. Temporal evolution of (a)  $E_{ks}$ and $E_{kw}$, (b) $\epsilon ^+_\omega$ and $\epsilon ^+_\theta$ in case NW. (c,d) Instantaneous flow fields at $t_1$ and $t_2$, with the isosurfaces $u^+=13$, $Q=1.4$ and (c) $\theta '=\pm 0.7$, (d) $\theta '= \pm 0.35$.
Notably, it can be observed that a pair of dilatational structures is manifested below each streamwise vortex in this case, manifesting a shape similar to that of the TWPs. This is in stark contrast to the flow organizations in case LW, where the velocity streak is enforced as the steady base flow and the perturbations are weak. The only reasonable explanation for this phenomenon is the comparatively strong nonlinearity in the process of streak meandering and breakdown, which triggers the generation of dilatational TWP structures. This inference is supported by the fact that there are eight pairs of dilatational structures but only four pairs of streamwise vortices, the latter of which is consistent with the  $k_x$ of the initial perturbation. These dilatational structures should be triggered by the second harmonic via nonlinear effects, the triad-wave interactions being the most probable mechanism.
Significant physical insights can be gained upon an inspection of the governing equations for velocity divergence and its approximation in the viscous sublayer. By taking the divergence of the momentum equation in its non-conservative form
 \begin{equation} \frac{\partial u_i}{\partial t} + u_j\,\frac{\partial u_i}{\partial x_j}=-\frac{1}{\rho}\, \frac{\partial p}{\partial x_i} + \frac{1}{\rho}\,\frac{\partial \tau_{ij}}{\partial x_j}, \end{equation}
we obtain the following transport equation of the velocity divergence  $\theta$, or $\theta '$ due to the lack of mean flow dilatation herein:
 \begin{equation} \frac{{\rm D} \theta}{{\rm D} t} =-\frac{\partial u_i}{\partial x_j}\,\frac{\partial u_j}{\partial x_i} -\frac{1}{\rho}\,\frac{\partial^2 p}{\partial x_j\,\partial x_j} +\frac{1}{\rho^2}\,\frac{\partial \rho}{\partial x_j}\,\frac{\partial p}{\partial x_j} +\frac{\partial }{\partial x_i} \left( \frac{1}{\rho}\,\frac{\partial \tau_{ij}}{\partial x_j}\right)\!. \end{equation}
By applying the zeroth-order near-wall approximations of the no-slip and isothermal conditions  $u_i \approx O(y)$ and $T\approx T_w(1+ O(y))$ to the continuity equation and the state equation, we have $\theta \approx -(1/\rho )\,{\partial \rho /\partial t}$ and $p=\rho R T_w$, and the following correlation between the temporal derivative of $\theta$ and pressure $p$:
$p$:
 \begin{equation} \frac{\partial \theta}{\partial t} \approx \frac{1}{\rho^2} \left( \frac{\partial \rho}{\partial t}\right)^2 -\frac{1}{\rho}\,\frac{\partial^2 \rho}{\partial t^2} \approx \theta^2 -\frac{1}{\rho}\,\frac{\partial^2 \rho}{\partial t^2} \approx \theta^2 -\frac{1}{p}\,\frac{\partial^2 p}{\partial t^2}. \end{equation}
The third term on the right-hand side of (3.8) can be simplified as
 \begin{equation} \frac{1}{\rho^2}\,\frac{\partial \rho}{\partial x_j}\,\frac{\partial p}{\partial x_j} \approx \frac{1}{\rho^2}\,\frac{\partial \rho'}{\partial x_j}\,\frac{\partial p'}{\partial x_j} \approx \frac{1}{R T_w} \left(\frac{1}{\rho}\,\frac{\partial p'}{\partial x_j} \right) \left(\frac{1}{\rho}\,\frac{\partial p'}{\partial x_j} \right)\!, \end{equation}
by presuming the insignificance of the wall-normal derivative  $\partial p'/\partial x_2 \approx 0$. Equation (3.8) can thus be rewritten in the form of wave propagation
 \begin{equation} {-}\frac{\gamma}{a^2}\,\frac{\partial^2 p}{\partial t^2} + \frac{\partial^2 p}{\partial x_j\, \partial x_j} \approx-2 \rho Q + \frac{1}{\rho R T_w}\,\frac{\partial p'}{\partial x_j}\, \frac{\partial p'}{\partial x_j} +\rho\,\frac{\partial}{\partial x_i} \left( \frac{1}{\rho}\,\frac{\partial \tau_{ij}}{\partial x_j}\right)\!, \end{equation}
where  $a$ is the sound speed. Note that this reformulation of the governing equation does not indicate that the wall pressure propagates as a sound wave within the wall-parallel plane. Rather, it suggests that the pressure Laplacian term balances, at least partially, the temporal derivative.
We still focus on (3.8) and will give reference to (3.11) when necessary. The right-hand-side terms of (3.8) at  $t^+_1$ are shown in figure 6. The first term on the right-hand side of (3.8) (referred to as $S_{VG}$, figure 6a) represents the contribution of the velocity gradient. This term is strong off the wall from the buffer layer and is related to the second invariant of the velocity gradient $Q$ (
$Q$ ( $S_{VG}=\theta ^2 - 2 Q$) and the self-induced nonlinear generation term $\theta ^2$, the latter of which cannot be excited by itself if no initial velocity divergence is introduced. Since the velocity divergence $\theta$ is much weaker than vorticity and shear above the viscous sublayer (Yu & Xu Reference Yu and Xu2021), $S_{VG}$ is approximately equal to $Q$. Given its different spatial distributions from those of the dilatational structures, and the fact that this term also exists in incompressible turbulence, the generation of the dilatational structures cannot be attributed to this term. The last term on the right-hand side of (3.8) ( $S_{VD}$, figure 6b) originates from the viscous term, interpreted as viscous dissipation. Like the $S_{VG}$ term, it also exists in incompressible flows and is unrelated to the Mach number. Henceforth, it cannot be related directly to the effects of compressibility and thereby the formation of dilatational TWP structures, despite their resemblance.

Figure 6. Instantaneous distributions of the right-hand side of (3.8) at  $t^+_1$: (a) $S_{VG}$, (b) $S_{VD}$, (c) $S_{PL}$, and (d) $S_{PB}$.
The two remaining terms on the right-hand side of (3.8) are related to pressure, a flow quantity that is linked to both dynamic and thermodynamic flow quantities. These two terms arise from the pressure Laplacian ( $S_{PL}$, figure 6c) and the barotropic effects ( $S_{PB}$, figure 6d), respectively, the latter of which is caused by the parallel density and pressure gradient. Although the $S_{PL}$ term is strong, it functions primarily as the propagation effects and balances the temporal derivative, as demonstrated by (3.11). The $S_{PB}$ term is worth exploring. When normalized by $\rho _\infty$, $U_\infty$ and the free-stream temperature $T_\infty$, the coefficient $1/(R T_w)$ in the $S_{PB}$ term (see (3.10)) can be non-dimensionalized to be $\gamma M^2_\infty /T_w$. This suggests that the $S_{PB}$ term will be enhanced by the increasing Mach number and the decreasing wall temperature, which is consistent with the evidence given by previous studies (Yu et al. Reference Yu, Xu and Pirozzoli2019, Reference Yu, Xu and Pirozzoli2020; Yu & Xu Reference Yu and Xu2021; Zhang et al. Reference Zhang, Wan, Liu, Sun and Lu2022). We should point out that one of the important postulations of $p' \propto \rho '$, or equivalently $C_{\rho ' p'} \approx 1$, can be satisfied only within the viscous sublayer due to the isothermal condition (see figure 7). It fails rapidly off the wall, where the gradients of density and pressure fluctuations $\boldsymbol {\nabla } \rho '$ and $\boldsymbol {\nabla } p'$ are no longer parallel to each other, resulting in the trivial contribution from the $S_{PB}$ term. This also explains why the dilatational motions are significant only in the viscous sublayer. Furthermore, the $S_{PB}$ term is a nonlinear expression that is capable of triggering higher harmonics. Specifically, for the pressure fluctuations with a certain streamwise wavenumber $k_x$ and angular frequency $\omega$ in the form of a travelling wave, say $p_{k_x,\omega } = \hat p ( -k_x x + \omega t)$, the $S_{PB}$ term is capable of triggering the fluctuations at the streamwise wavenumber at $2 k_x$, then at $4 k_x$, $8 k_x$, and so on, to the extent that the nonlinearity is strong enough, until the very small scales where the viscous dissipation overwhelms the other mechanisms of their generation, with the most evident structures manifested at the scale where the production balances the dissipation. These descriptions regarding the generation of pressure $p'$ can be related to $\theta '$ by the approximation $\theta ' \approx -(1/p)\,{\partial p'/\partial t}$. It is therefore justifiable to attribute the generation of the dilatational TWP structures to the $S_{PB}$ term, caused by the restriction of the isothermal boundary condition, and hence the parallel gradients of pressure and density.

Figure 7. Correlation coefficient  $C_{\rho ' p'}$ between $\rho '$ and $p'$.
$p'$.
Notably, the primordial wall pressure fluctuations (prior to the emergence of TWPs) are generated by the vortical structures that are associated with solenoidal turbulent motions in the buffer region. There is no direct evidence that the wall pressure fluctuations related to the dilatational TWP structures are self-induced, self-sustained or accountable for perturbation amplification or the generation of unstable vortical motions, as has been proven in the previous subsection.
3.3. Analysis of the fully turbulent regime
The previous discussion explain why the dilatational motions are the most intense in close proximity to the wall instead of at higher wall-normal locations, and how the TWP structures are generated through the already existing wall pressure fluctuations. However, this is not sufficient to support the conclusion that the dilatational motions are generated by the nonlinearity of the streak meandering in the regeneration cycle, because this assertion implies that the spanwise characteristic length scales of the TWP structures and the low-speed streaks should be approximately the same, which is not the case. As we have shown in our previous study (Yu et al. Reference Yu, Xu and Pirozzoli2019, Reference Yu, Xu and Pirozzoli2020), the spanwise characteristic length scales of pressure  $p'$ and flow divergence $\theta '$ are $2\unicode{x2013} 3$ times that of the velocity streaks in the buffer region, indicating that there probably exist subharmonic excitations of the fluctuations. This is more challenging to interpret physically than the shorter streamwise length scales, for the fluctuations at lower wavenumbers (larger characteristic length scale) can be excited only at the last stage of transition (as will be shown later). Directly tracing causality from the instantaneous fields is an arduous and potentially futile task, given the complexity of flow dynamics in the strong nonlinear stage of flow transition or fully developed turbulence. However, scrutinizing the evolution of coherent structures by prohibiting certain effects will shed some interesting light on flow physics.
We perform two additional simulations by setting the spanwise width of the computational domain as  $l^+_z \approx 180$ and $540$, and spanwise wavenumber $k_z=1$ and $3$ (in (3.5)), referred to as cases NWn (case NW in a narrower domain) and NWw (case NW in a wider domain), respectively, in order to reveal the impact of motions with spanwise scales wider than the near-wall velocity streaks on the structural variation of the near-wall dilatational motions. Figure 8 shows the temporal evolution of $E^+_k$ and $\epsilon ^+_\theta$ within $y^+ = 60$. From the initial state $t^+=0$ to $t^+=1300$, during which the flows have gone through several low-intensity and one high-intensity bursting events, the turbulent kinetic energy $E^+_{k}$ and dilatational enstrophy $\epsilon ^+_\theta$ of the three cases are almost identical, indicating that the turbulent motions can be considered to evolve as independent clusters with the same streamwise and spanwise length scales as the initially introduced perturbations without significant nonlinear effects to trigger larger-scale motions, at least in the spanwise direction where the sizes of the computational domain differ in these cases. Within this period, the spanwise spectra remain discrete, which is a typical phenomenon in transition flows, as shown in figures 9(a,b). It can also be inferred from the instantaneous flow fields in figures 10(a,b) that the structures are still periodic, organized as clusters with the sizes of the initially introduced wavelengths. From $t^+ \approx 1300$, $E^+_{k}$ and $\epsilon ^+_\theta$ commence to diverge after reaching very high peak values, corresponding to a highly intensified turbulent bursting event. After that, both of these flow quantities diminish to comparatively lower levels around which they oscillate. It is not until this second strong bursting event that the spanwise spectra gradually become continuous, as displayed in figures 9(c,d), and the initially introduced periodicity vanishes completely, accompanied by the amplified energy at scales greater than those of the streaks. By comparison, $E^+_{k}$ and $\epsilon ^+_\theta$ in case NWn are evidently lower than those in the other two cases. Considering that the ‘healthy’ turbulent height is approximately one-third of the spanwise width of the computational domain (Flores & Jiménez Reference Flores and Jiménez2010; Yin, Huang & Xu Reference Yin, Huang and Xu2017), the lower turbulent kinetic energy $E^+_{k}$ in case NWn can be ascribed to the diminished turbulent fluctuations near and above the healthy turbulence height $y^+ \approx 60$. The abatement of $\epsilon ^+_\theta$, however, cannot be explained similarly, for the strong velocity divergence is restricted within the viscous sublayer and cannot reach such a high off-wall distance. Instead, it is more rational to associate the ‘healthy’ dilatational TWP structures, those endowed with the features of the same structures in regular turbulent boundary layers in larger computational sizes, with the strong turbulent fluctuations at larger scales and higher locations, the lack of which directly influences their generation.

Figure 8. Temporal evolution of (a)  $E_k$ and (b) $\epsilon ^+_\theta$. Red dashed lines, case NWn; black solid lines, case NW; and blue dash-dotted lines, case NWw.

Figure 9. Premultiplied streamwise (black solid lines) and spanwise (red dashed lines) spectra integrated below  $y^+=60$ at three peaks of $E_k$: (a) $t^+=250$, (b) $t^+=640$, (c) $t^+=1350$, (d) $t^+=1720$.

Figure 10. Instantaneous distribution of vortices (isosurfaces of  $\lambda _{ci}$, green), dilatational motions ( $\theta '$, black and red) and velocity streaks ( $u^+=13$, translucent blue) for (a) $t^+=250$ ( $Q=1.2$, $\theta '=\pm 0.7$), (b) $t^+=640$ ( $Q=6$, $\theta '=\pm 3$), (c) $t^+=1350$ ( $Q=2.5$, $\theta '=\pm 2.5$), and (d) $t^+=1720$ ( $Q=2.5$, $\theta '=\pm 2.5$).
We would like to comment on the small-scale spanwise-oriented vortical structures located within and slightly above the dilatational TWP structures, which are clearly visible in fully-developed turbulence in figure 2. However, these structures can be barely observed during the initial stage of the transient growth, suggesting that their formation occurs during subsequent processes. Their correlation with the dilatational motions (Yu et al. Reference Yu, Liu, Fu, Tang and Yuan2022b) can be explained by simple reasoning. The dilatational motions are correlated with the strong wall-normal velocity  $v'$ close to the wall. As they are organized as streamwise positive–negative alternating structures, the strong $\partial v/\partial x$ should be expected. Additionally, the wall-normal velocity brings the low-speed fluids upwards and high-speed fluids downwards, similar to the streamwise vortices in the buffer region, inducing $\partial u'/\partial y$. Both of these processes are related to the spanwise vorticity $\omega '_z$. Such a description interprets the process of the dilatational motions generating solenoidal vortical ones. But then again, these spanwise vortices lack the mechanisms of self-sustainment, so the initial dilatational disturbances cannot trigger the transition, as proved in § 3.1.
3.4. Correlation with the Orr mechanism
The vortical clusters are found to be associated with turbulent bursting events (Kim & Moin Reference Kim and Moin1986; Tardu Reference Tardu1995; Adrian Reference Adrian2007). It has been proven that the vortical clusters are related to the Orr mechanism (Encinar & Jiménez Reference Encinar and Jiménez2020; Jiao, Hwang & Chernyshenko Reference Jiao, Hwang and Chernyshenko2021; Lozano-Durán et al. Reference Lozano-Durán, Constantinou, Nikolaidis and Karp2021), which describes the velocity and pressure perturbation amplification during their variation from the backward tilting to the forward tilting structures in the flows with mean shear (Orr Reference Orr1907). Lozano-Durán et al. (Reference Lozano-Durán, Constantinou, Nikolaidis and Karp2021) conducted numerical experiments in which the Orr-mechanism-related pressure fluctuations in the wall-normal momentum equation are removed, and found that the near-wall turbulence is laminarized. This suggests the significant role played by the Orr mechanism in the near-wall turbulence. In light of this, we also attempt to mitigate the Orr mechanism, and hence the turbulent bursts and vortical clusters, for the purpose of investigating their influences on the dilatational TWP structures.
Lozano-Durán et al. (Reference Lozano-Durán, Constantinou, Nikolaidis and Karp2021) pointed out that the Orr mechanism contributes mainly to the slow term of the pressure fluctuations, inhibiting the cross-shear velocities when the structures are tilted. Presuming that such a conclusion is also valid in compressible turbulence, we propose to cast the wall-normal momentum equation as follows to alleviate the Orr mechanism:
 \begin{equation} \frac{\partial \rho v}{\partial t} + \frac{\partial \rho u_j v}{\partial x_j} =-\frac{\partial p}{\partial y} + \frac{\partial \tau_{2j}}{\partial x_j} + \alpha\,\frac{\partial p'_s}{\partial y}. \end{equation}
Here, the slow term  $p'_s$ is solved by the Poisson equation
 \begin{equation} \frac{\partial^2 p'_s}{\partial x_i\,\partial x_i} =- \frac{\partial^2}{\partial x_i\, \partial x_i} (\rho u''_i u''_j - \overline{\rho u''_i u''_j}), \end{equation}
with the boundary conditions  $\partial p'_s/\partial y=0$ on the wall and $p'_s=0$ at the upper boundary, following the study of Zhang et al. (Reference Zhang, Wan, Liu, Sun and Lu2022). When taking the parameter $\alpha =1.0$, the slow term will be eliminated. In our simulation, we set $\alpha$ as 0.5 and 0.8 to remove the slow term partially for the consideration of numerical stability, and as $0.0$ for comparison.
We commence our simulations from a fully developed flow field at  $t^+=3000$ in case NW. The cases with various $\alpha$ have been run for a period $1000 \delta _\nu /u_\tau$. The temporal evolution of the divergence fluctuation intensity at the wall is shown in figure 11. Compared with the case with $\alpha =0$, the $\theta '_{rms}$ values on the wall are significantly lowered as the values of $\alpha$ increase, especially the high rising peaks indicating the occurrence of strong turbulent bursting events, suggesting the weakening of the dilatational motions with the alleviation of the Orr mechanism. By observing the instantaneous flow fields in figure 12, we found that removing the slow term of the pressure that is closely related to the Orr mechanism leads to the evident weakening of the vortical structures, accompanied by the diminishing dilatational TWP structure beneath them.

Figure 11. Evolution of  $\theta '_{rms}$ on the wall: black solid line, $\alpha = 0$; red dashed line, $\alpha =0.5$; blue dash-dotted line, $\alpha =0.8$.

Figure 12. Instantaneous distribution of vortices (isosurfaces of  $Q=2.5$, green) and dilatational motions ( $\theta '=\pm 2.5$, black and red) at $t^+=100$ for (a) $\alpha =0$, (b) $\alpha =0.5$, and (c) $\alpha =0.8$.
However, we must point out that the simple numerical experiment conducted herein constrained the nonlinearity more than the Orr mechanism. It remains unclear whether the Orr mechanism or the other nonlinear effects should be attributed to the generation or the sustainment of the dilatational TWP structures. Such ambiguity does not affect our conclusion that the vortical clusters and dilatational TWP structures occur simultaneously in hypersonic wall turbulence, and that the vortical clusters related to the bursting events are, at least partially, induced by the Orr mechanism, as proven by Lozano-Durán et al. (Reference Lozano-Durán, Constantinou, Nikolaidis and Karp2021).
4. Concluding remarks
This paper explores the generation of dilatational motions in the form of travelling wave packets (TWPs), a gradually manifesting phenomenon with increasing Mach number and decreasing wall temperature, and its dynamical association with near-wall turbulence with the support of evidence of direct numerical simulations statistics, numerical experiments and theoretical analyses. Starting with the processes in the near-wall self-sustaining cycle, we eliminate the possibility of the generation of dilatational TWP structures being associated directly with the ‘lift-up’ effects inducing the low-speed streaks and the linear perturbation transient growth of the low-speed streaks – two physical processes that can be described by linear dynamics. The wall-normal velocity perturbations in the shape of TWPs close to the wall are not capable of triggering a high energy amplification rate in the framework of the stability of temporally steady streaks either. The initial weakly nonlinear stage of the streak evolution in numerical experiments reveals that the nonlinearity due to the parallel density and pressure gradients leads to the generation of dilatational structures with smaller streamwise length scales. The streak meandering and breakdown related to the Orr mechanism are accompanied by the vortical clusters that induce the strong wall pressure, and further, the dilatational TWPs excited by the aforementioned nonlinear effects. In fully developed turbulence, we found that the occurrence of the dilatational TWP structures should be attributed to the strong turbulent bursting events with wider spanwise scales and at higher locations. This is indicated by the much lower dilatational enstrophy if the wider and outer motions are removed artificially, and if the Orr mechanism, associated with the generation of the vortical clusters, is alleviated. In the strong shear environment with a high mean velocity gradient in the near-wall region, the wall-normal velocity induces spanwise-oriented shear and vorticity, which are responsible for the intensification of wall shear stress and wall heat flux fluctuations in high Mach number flows over cold walls (Yu et al. Reference Yu, Liu, Fu, Tang and Yuan2022a,Reference Yu, Liu, Fu, Tang and Yuanb).
With the previous conclusions, we can summarize the descriptions of the dynamics of the generation of the dilatational TWP structures in the process of near-wall self-sustaining cycles in figure 13, and recapitulate it as follows. In the near-wall self-sustaining cycles, namely the regeneration between the velocity streaks and the vortical structures, the dilatational TWP structures are induced during the vortex stretching and streak breakdown. The nonlinear effects of the inter-scale turbulent interaction and the Orr mechanism further lead to larger clusters of vortical motions. The strong vortical clusters lead to pressure fluctuations at the wall, which, due to the isothermal boundary condition, further result in similarly distributed density fluctuations. The approximately parallel pressure and density gradients generate pressure fluctuations and velocity divergence at smaller streamwise length scales through the strong nonlinear interaction, forming the dilatational structures organized as TWPs beneath the vortical clusters.

Figure 13. Summary of the near-wall self-sustaining cycles and the generation of the dilatational TWP structures.
Funding
This work is supported by the National Natural Science Foundation of China (grant nos 12202469, 12388101 and 92052301).
Declaration of interests
The authors report no conflict of interest.


