


Introduction
The stable isotope composition of ice in glaciers is determined by primary climatic processes which determine the character of precipitation on their surfaces, and by subsequent diagenetic and metamorphic processes which may lead to movement and fractionation of isotopes within the ice mass.
Most work on stable isotopes in glaciology has been concerned with the reconstruction of changing climatic conditions on the surface of ice sheets and glaciers from studies of isotopic variations in bore-hole cores. Because of the possible isotopic complications which might be produced in the basal parts of ice sheets, workers have been reluctant to use basal isotopic profiles as direct indicators of climatic change (Reference Paterson and PatersonPaterson and others, 1977; Reference Gow, Gow, Epstein and SheehyGow and others, 1979).
We wish to present a simple theory of isotopic evolution at the base of a glacier, predicting a pattern of expectations which enable us to use basal isotopic profiles as indicators of basal processes, and which can, in certain cases, be used to isolate that component of the isotopic record which reflects an original climatic signal.
We suggest two fundamental controls on the isotopic patterns produced in basal ice:
-
(a) Whether there is net freezing-on of regelation ice at the glacier sole (basal accumulation) or net melting of the glacier sole but with a basal regelation layer which is continually destroyed and re-formed (basal ablation).
-
(b) The origin and flow path of water at the glacier sole: whether surface water reaches the bed; whether water drains away from the glacier sole and with what frequency; and whether there is a large- or small-scale closed system of water flow at the glacier sole.
Isotopic Fractionation at the Base of Polar Glaciers where there is Net Freezing-On of Regelation Ice
It is well known that fractionation of D and 18O isotopes occurs during the freezing of water and the melting of ice. When ice is formed from an excess of water, there is an increase in the 18O/16O ratio in the ice compared with the original water reservoir, and a concomitant decrease in the ratio in the remaining water.
Lawson and Kulla (1978) developed the basis of a theory of isotopic fractionation from observations on Matanuska Glacier, where basal ice, presumed to be rege-lation ice, showed a different composition from that of overlying ice. Jouzel and Souchez (1982) have modelled the Rayleigh process for local fractionation between a solid and a liquid during regelation at the glacier sole. We have also modelled a Rayleigh process in order to analyse coupled large-scale spatial variations in the isotopic composition of basal regelation ice and the underlying melt water (cf.Reference Boulton and Robin Boulton, 1983). This theory can be used as a basis for reconstructing the palaeohydrology of the subglacial system, and was first presented to the 1981 meeting of the British Branch of the International Glaciological Society.
Fractionation factors (α) between ice and water isotopes are defined by:

where Rice and R are the isotopic ratios of ice and water, respectively. Reference O’NeillO’Neill (1976) determined experimentally values of (18O) = 1.003 and (D) = 1.019.
We know that melt water can exist deep beneath modern ice sheets (Reference GowGow, 1970). Thermal modelling of ice sheets suggests that broad zones of melting and zones where the basal ice temperature is well below the melting point do occur, and further, theoretical and field studies suggest that melt water produced in zones of melting flows subglacially towards the glacier margin, and if it flows into a “cold zone” will freeze to the glacier zone as regelation ice (Reference WeertmanWeertman, 1961; Reference Boulton, Price and SugdenBoulton, 1972; Gow and others, 1979).
Figure 1 is an idealized ice sheet with a central zone A‒B in which temperatures are below the melting point and no water is produced or consumed by freezing, and beneath which there is thus no water flow although we assume pores and voids to be water-saturated; a zone B‒C in which water is produced by melting and which flows outwards to balance the melting rate in order to allow a steady state; a zone C‒D in which the rate of heat conduction through the ice sheet exceeds the rate of basal frictional heating and the geothermal heat flux, and thus has a capacity to freeze water from the subglacial reservoir, until all the water produced in zone B‒C has been frozen on (point D); a zone D‒E which the prior exhaustion of the water input from B‒C excludes an external heat source, the glacier⁄bed interface is again frozen and there is no subglacial water movement.
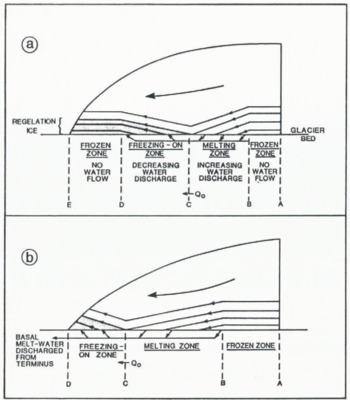
Fig. 1 An idealized ice sheet showing a complete sequence of possible basal mass-balance (melting or freezing-on) states. Beneath a given glacier we might find zones AB or BC Only, or AB‒BC, AB‒CD, BC‒CD, BC‒DE, or a repetitive sequence if the bed is highly irregular (see Fig. 4).
In zone A‒B, the basal ice carries an isotopic record which reflects surface climate; in zone B‒C, some of this basal ice is destroyed; in zone C‒D, fresh regelation ice is produced, and in zone D‒E this new basal sequence is preserved. A further set of similar zones may occur down-glacier.
We can be sure that the great thickness of ice along this profile will prevent any surface water finding its way to the glacier bed to disturb this system. Thus, the sub-glacial discharge of water (Q) in the zone of melting (B‒C) and the zone of freezing (C‒D) can be calculated, as can the thickness of basal regelation ice in zone C‒D.
Using a model such as this (Fig. 1), we can predict the nature of isotopic variation in basal regelation ice and subglacial water. We assume that subglacial flow of water in an aquifer of unspecified characteristics will cause mixing and homogenization of all subglacial melt water. Thus, at c in Figure 1 we have a subglacial water discharge of Q0 with a uniform isotopic ratio R0 . We assume that, because of the low permeability of basal ice compared with the melting rate, all the isotopic components of the ice will pass into the water reservoir when it melts, avoiding fraction-ation. Thus, R0 is also the mean isotopic ratio of all the melted ice.
In the freezing zone C‒D (Fig. 1), freezing will occur in the presence of excess water in which isotopic mobility will allow fractionation. As water discharge decreases in this zone due to freezing, the ratio of 18O and D will also decrease because of the relative enrichment of regelation ice in these isotopes.
Let N denote the number of heavy isotopes and M the number of light isotopes, respectively, within the basal water discharge (Q) at position x. Then the isotopic ratio is:
Supposing a closed system, conservation of mass requires that the spatial change of N, M within the basal water is balanced by the number of isotopes (n, m) contained within the newly formed regelation ice:
Hence the isotopic ratio of the regelation ice is:
Rewriting Equation (3) in terms of M and m, taking into account Equations (2) and (4), leads to:

since N << M, M can be set proportional to Q. Hence Equation (5) may be written in the form:

Here, dQ⁄dx denotes the freezing rate.
Integrating Equation (6) subject to the boundary values Q 0, the initial discharge at the beginning of the freezing zone (c, x‒0), and R ice, its isotopic ratio, we obtain:

R 0 is also the mean isotopic composition of all the ice melted in BC. Given R(x) , from Equation (7), the isotopic concentration in regelation ice is determined by the fractionation factor, hence:
In Figure 2 we plot changing δ18O and δD ratios in basal regelation ice and in the subglacial water reservoir which would occur in zone C‒D of Figure 1, given the melting⁄freezing rate (dQ⁄dx), and with α(18O) = 1.003, and α(D) = 1.019. The difference between isotopic concentrations of freshly formed basal regelation ice and immediately sub-jacent subglacial water at a given point will be:
and the difference between the isotopic composition of sub-glacial water and C (mean of melted ice in BC) and subglacial water at a given point will be:

Fig. 2 Progressive fractionation of δ18O and δD in subglacial water (Rx) and the overlying ice formed from it (Rice) when an initial subglacial water discharge (Q0) of isotopic composition (R0) from a zone of melting (Fig. 1, BC) is progressively frozen to the glacier sole in the succeeding zone (Fig. 1, CD) so that subglacial discharge (Qx⁄Q0) diminishes.
Standard water has a value of δ(18O) = —1.94‰ (Reference Dansgaard, Dansgaard, Johnsen, Clausen and GundestrupDansgaard and others, 1973). δ(l8O) values in basal ice strongly depend on location and vary between —10‰ and —40‰. Hence K 0 could vary from 0.990 to 0.960, and the difference d 1 in Equation (6) is more or less independent of K 0.
To apply this theory to an actual glacier, we must know the freezing rate or discharge in the freezing zone, and have grounds for believing that the two basic assumptions of mixing of the subglacial water reservoir and no addition of surface water are true. Where we also have isotopic data, we can test these assumptions.
The theory is developed for a large-scale closed system where all the water produced in the zone of melting is used up as regelation ice in a freezing-on zone, beyond which there occurs a frozen zone where no more melt water is available, the glacier is frozen to its bed, a thick basal regelation zone of distinctive isotopic profile is pre-served, and there is no subglacial water flow, However, it can also apply to a large-scale open system where the freezing-on zone extends to the glacier margin or is succeeded by a zone of melting, and melt water derived from the inner zone of melting escapes from the system (Fig. 1).
Figure 2 reflects an important general statement about the progressive fractionation of water and the regelation ice formed from it when water passes into a zone of freezing-on. It is a valuable basis for interpretation.
Test of the Theory: The Basal Isotopic Profile from Byrd Station, Antarctica
Reference Gow, Gow, Epstein and SheehyGow and others (1979) have presented a detailed iso-topic profile from the basal part of the core taken from the 2164 m bore hole at Byrd Station on the West Antarctic ice sheet (Fig. 3a). Basally derived debris extends up to 4.83 m above the glacier sole, at which height entrapped air first appears in the core. This evidence led Reference Gow, Gow, Epstein and SheehyGow and others (1979) to conclude that this basal 4.83 m of ice had been produced by freezing of subglacial melt water.
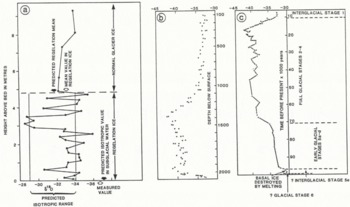
Fig. 3 Oxygen-isotope profile of the core taken from the Byrd Station bore hole, West Antarctica (data from Reference Gow, Gow, Epstein and SheehyGow and others (1979), and Reference Epstein, Epstein, Sharp and GowEpstein and others (1970)). (a) Isotopic composition of basal ice.(b) Isotopic composition for the whole depth of the ice sheet. (c) Isotopic composition against time, and with a correlation with the deep ocean isotopic stages. The ice deposited during stage 6 and part of stage 5e, the penultimate glacial and last interglacial stages, is suggested to have been destroyed by melting and re-formed as regelation ice.
Using a thermal model, Reference Budd, Budd, Jenssen and RadokBudd and others (1970) com-puted the disposition of zones of melting and refreezing at the base of the ice sheet along a flow line through Byrd Station. They predicted the distribution of zones of melting and freezing-on, and the frozen zones shown in Figure 4a and b. A zone of net melting (B) up-glacier of Byrd Station is succeeded by a zone of freezing-on (c) near whose down-glacier extremity the Byrd Station bore hole was drilled. They predicted a thickness of 7 m of basal regelation ice at Byrd Station (Fig. 4d), which agrees well with the observed thickness of 4.83 m.

Fig. 4 A vertical section along a transect through Byrd Station, West Antarctica, showing patterns of basal melting, water flow, and regelation based on the modelling by Reference Budd, Budd, Jenssen and RadokBudd and others (1970). (a) Flow lines along the transect and the location of the Byrd Station bore hole. (b) The sequence of zones of melting, freezing-on, and frozen zones, and the rates of melting and freezing. (c) Water discharges in zones of melting and freezing-on. (d) Flow lines in relation to the bed. Flow lines descend to the bed in zones of melting (basal ablation) and rise from it in zones of freezing-on (basal accumulation). Regelation ice is stippled.
Using Equations (7) and (8), and Reference Budd, Budd, Jenssen and RadokBudd and others’ (1970) predicted values of subglacial water discharge (Fig. 4c), the progressive fractionation in the zone of freezing-on (c, Fig. 4) of newly formed regelation ice and the subjacent water from which it is formed can be compared with the isotopic composition of the melt water at the down-glacier extremity of the melting zone (B).
In order to reconstruct the theoretical isotopic profile through any vertical column of regelation ice in the freezing-on zone, we merely need to reconstruct flow paths within this zone and then to correlate each level within the column with the point from which it is derived, which determines its isotopic composition. This has been done in Figure 5 for a series of columns along the Byrd Station flow line. We have ignored any strains within the ice.

Fig. 5 Predicted oxygen-isotope fractionation patterns in freezing-on zone c along the Byrd Station transect. (a) Reduction in subglacial water discharge. (b) Progressive oxygen-isotope fractionation in newly formed regelation ice and the remaining subglacial water discharge. (c) The build-up of basal regelation ice. (d) Predicted deviation of δ18O values from the values in parent ice in vertical profiles in basal regelation ice and relative values in subglacial water at different points along the transect (340, 360, 380, and 395 km). This assumes a simple laminar pattern of basal ice flow.
The important predictions are:
-
(a) Predictions of numerical δl8O values in basal ice and subglacial water.
-
(b) There will be an abrupt change in isotopic composition at the upper boundary of the regelation ice zone, to a lower δ18O value in normal glacier ice.
-
(c) There will be an upward increase in δ18O values in the regelation ice.
-
(d) At the upper end of the flow line, δl8O values in regelation ice will be higher than in overlying ice, but further down-glacier the lower part of the regelation ice zone will have lower δ18O values than overlying ice.
-
(e) δl8O values for subglacial water will become progressively smaller than normal ice values as we move down the flow line.
To what extent are these predictions borne out in practice?
We find that δ18O values in subglacial water at Byrd Station are lower than in the overlying ice (Fig. 3a). Theory predicts that the difference between subglacial melt water and the basal part of normal ice at Byrd Station should be 5.4‰. In practice we find a difference of 5.3‰.
Theory predicts that the differences between δl8O values for subglacial water and the glacier sole with which it is in contact should be 3.0‰. In practice we find a difference of about 2.9‰.
Assuming the regelation ice to have been produced from ice with the same isotopic composition as the lowest normal glacier ice, predicted maximum and minimum isotopic values are ‒29.1 and ‒34.3, respectively, compared with measured values of ‒28.6 and ‒36, and a predicted mean of ‒31.88 compared with ‒32.95.
Apart from the last, we are impressed by these similarities.
However, the patterns referred to in predictions (b)‒(d) above are not borne out in practice.
Observations on modern glaciers frequently show complex patterns of strain in basal ice. Folding and narrow zones of high shear strain are particularly common in basal ice and might be expected to complicate isotopic profiles (Reference BoultonBoulton, 1983). However, although we might expect such processes to disturb the patterns shown in Figure 5a, the range of isotopic values which we predict should be preserved. Thus, the highest predicted δ18O value, at the top of the regelation zone if the sequence were undisturbed, and the lowest predicted value, at the glacier sole, should be found in the isotopic sequence of Byrd Station, not-withstanding any complex deformation. Figure 5 predicts a maximum range of δl8O values of 5.2‰ and a mean of ‒31.9‰. The measured range is 7.5‰ with a mean of ‒32.95‰.
The major quantitative discrepancy arises from a series of horizons which are isotopically lighter than we expect, several of which lie outside the theoretically expected range. Whereas complex patterns of deformation may change the mean by changing the relative proportions of isotopically different ice in a particular vertical column, it cannot explain values which lie outside the expected range. To do this, we must assume that some of the ice from which the regelation ice was formed was isotopically lighter than the lowest normal glacier ice at Byrd Station. The extreme value of ‒36‰ in regelation ice would require a source at least as low as ‒34‰.
The ice immediately above the basal regelation layer at Byrd Station has been estimated by Reference Epstein, Epstein, Sharp and GowEpstein and others (1970) to have formed between 70 and 100 ka (Fig. 3c), and would thus belong to early glacial stages 5a‒d of the deep ocean record. If ice older than the basal normal glacier ice at Byrd Station were isotopically colder (‒34‰), it could be interpreted as having accumulated on the glacier surface during stage 6, the lowermost 2 m of normal ice with the highest isotopic values of about ‒32‰ could represent the last interglacial (stage 5e), with the early glacial stage (5a‒d) beginning with the ice about 8 m above the bed with iso-topic values of ‒34‰.
We conclude that our numerical predictions are sufficiently good at Byrd Station to suggest that most of the simple assumptions underlying the theory are plausible. However, if the theory is to be applied at Byrd Station, we must relax the implicit assumption of a single pattern of strain in basal ice, and assume that the stratigraphy of basal ice is disturbed by complex patterns of folding. It is not difficult to imagine how a basal profile such as that at Byrd Station might have originated by folding.
The fact that complex isotopic patterns do not appear to extend upwards above the debris-rich regelation ice may be due to the role of these debris inhomogeneities in generating complex strain patterns.
The Influence of Complex Deformation Patterns in Basal Ice
Direct observations of patterns of folding and faulting in the basal parts of glaciers indicate that extremely complex patterns of deformation are common. It is also frequently found that complex patterns of deformation immediately above the glacier bed give way upwards to more uniform patterns reflecting simple shear strain (Fig. 6). It is as if a basal boundary layer of ice accommodates itself to the irregularity of the bed, allowing overlying ice to flow more smoothly over an “effective bed” of ice and substratum which together form a relatively smooth plane. This décollement plane often coincides with or is close to the upper surface of the basal ice carrying subglacially derived debris.

Fig. 6 The effect of complex patterns of basal flow on isotopic profiles. (b)‒(d) show observed patterns of folding and faulting, often beneath a planar décollement surface, and the changes they might produce in an originally simple isotopic pattern. (a) Isotopic pattern in basal regelation ice in which simple laminar flow has occurred (cf. Fig. 5d). (b) Pattern of basal folding beneath a sharp décollement in SØrbreen, Spitsbergen. (c) Basal folding and faulting in Aavatsmarkbreen, Spitsbergen. (d) Multiple folding in the basal ice of Lower Wright Glacier, Antarctica. Numbers identify different folded strata. The effect of this folding on an assumed initial isotopic profile such as that in (a) is shown. The direction of displacement of the isotopic profile at the top of regelation ice (shaded) depends on whether the top of the regelation ice coincides with the décollement (position R1), or whether it lies above the décollement (position R2). Vertical dashed lines show the positions of hypothetical isotopic profiles in the folded ice.
As at Byrd Station, the commonly accepted explanation of such subglacially derived debris is that it has been frozen in to the base of the glacier, and thus that the ice within which it occurs is regelation ice (Reference WeertmanWeertman, 1961; Reference LawsonKamb and LaChapelle, 1964; Reference BoultonBoulton, 1970). The character-istics of the ice are well known. Strong vertical and horizontal changes of debris concentration occur within it and it contains many large clasts (Reference Boulton and RobinBoulton, 1983). Compared with clean ice, we expect it to have a strongly anistropic rheology, as Reference Jouzel and SouchezHooke and others (1972) have shown that strain-rates for debris-rich ice are less than for clean ice under similar stress and temperature conditions, whilst some observations even suggest that very low concentrations might even lead to enhanced strain-rates.
We suggest that complex patterns of deformation result partly from complex patterns of stress orientation produced by flow over an irregular bed and partly from the strongly anisotropic strain response of debris-rich ice. We expect that the décollement separating a complexly deforming basal zone and an overlying zone of simple shear will frequently coin-cide with the top of the debris-rich regelation ice, or be near to it.
Figure 6 shows three examples of increasingly complex fold and fault structures observed in basal parts of modern glaciers which reflect increasingly complex net strain patterns. The commonest fold style is a shear fold in which anticlinal closures are highly attenuated, and synclinal closures are best preserved, though multiple folding events may be superimposed. We show the way in which the net strain indicated by these patterns might produce complex isotopic patterns in a pre-existing isotopic profile resulting from the simple regelation process modelled in Figure 5. Where the downward passage from normal glacier ice to regelation ice is above the major tectonic décollement, this passage will be marked by a sharp increase in δ values of about 3‰ (cases marked R2 in Figure 6), although complex isotopic patterns will occur beneath the underlying décollement. Where the regelation ice is entirely below the décollement plane, the tendency for synclinal fold closures to dominate beneath this plane will emplace some of the lower horizons of regelation ice into a position directly beneath it (Fig. 6). Thus, an isotopic profile through the décollement will tend to show a sharp reduction in δ values in passing from normal ice to regelation ice (patterns marked R1 in Figure 6).
Although coincidental juxtaposition of similar isotopic values might fail to show a sharp isotopic change when passing into basal regelation ice when the tectonic décollement coincides with the top of the regelation ice (probably its mean position), a sharp deflection will normally be expected. This should coincide with the occurrence of mineral and rock debris frozen on during the regelation process.
It is also important to stress that the upper limit of debris derived from the glacier bed marks the lower limit of the ice whose isotopic composition reflects in some simple way past atmospheric conditions on the ice-sheet surface.
Application of the Theory to other Isotopic Profiles from Polar Glaciers
Irrespective of any deformation patterns which might complicate the isotopic profile expected from regelation in a simple planar flow regime (Fig. 4), an important feature of the fractionation process is likely to survive. This is the large range of isotopic values produced by completed pro-gressive fractionation, which is thus likely to yield a major positive or negative spike, or both, in the basal isotopic profile. (As the final, most negative, regelation fractions will be contained in relatively thin ice increments, coarse sampling may underestimate the true isotopic range.) Major shifts and spikes in basal isotopic profiles from ice sheets are commonly found. They occur in the Devon Island Ice Cap (Reference Paterson and PatersonPaterson and others, 1977; Reference Fisher, Fisher, Koerner, Paterson, Dansgaard, Gundestrup and ReehFisher and others, 1983; Reference RobinRobin, 1983), at Camp Century and Dye 3 in Greenland (Reference Dansgaard, Dansgaard, Johnsen, Clausen, Gundestrup and ReehDansgaard and others, 1982), and in Terre Adélie (Reference Lorius and MerlivatLorius and Merlivat, 1977) and Byrd Station (Reference Gow, Gow, Epstein and SheehyGow and others, 1979) in Antarctica. We have argued that our theory can explain the basal part of the Byrd Station isotopic profile and, although this may not be true at other sites, the possibility should at least be considered.
Reference Dansgaard, Dansgaard, Johnsen, Clausen, Gundestrup and ReehDansgaard and others (1982) have described isotopic profiles from the lowermost few metres of the Greenland ice sheet at Camp Century (in north-west Greenland) and Dye 3 (in southern Greenland). Debris derived from the subglacial bed occurs in the lowermost few metres at both sites (Fig. 7). At neither of them does basal freezing-on currently occur, although Reference Herron and LangwayHerron and Langway (1979) have suggested that the basal, debris-bearing ice at Camp Century is regelation ice which formed at some time in the past. In both cases, the isotopic profile shows a strong shift of the order of 3‰ at the interface between relatively clean ice and the basal debris-bearing ice. In the case of Dye 3, values increase, whilst for Camp Century they decrease.
The coincidence of an isotopic shift with the change from clean to debris-rich ice is compatible with our model if the basal ice is regelation ice, an origin, in the case of Camp Century at least, supported by independent data (Reference Herron and LangwayHerron and Langway, 1979).

Fig. 7 Basal isotopic profiles from Camp Century and Dye 3 on the Greenland ice sheet (from Reference Dansgaard, Dansgaard, Johnsen, Clausen, Gundestrup and ReehDansgaard and others 1982; the basal value at Camp Century is a personal communication from Reference Dansgaard, Dansgaard, Johnsen, Clausen, Gundestrup and ReehDansgaard, 1982). Horizontal dashed lines show the upper limit of basally derived debris.
According to our model, the positive shift of δ values at the top of debris-rich ice at Dye 3 would reflect an untectonized contact between normal glacier ice and rege-lation ice, while the positive shift at Camp Century would reflect a tectonized contact.
Again, it must be stressed that simple climatic or stratigraphical interpretations of isotopic profiles in basal ice of the type made by Reference Dansgaard, Dansgaard, Johnsen, Clausen, Gundestrup and ReehDansgaard and others (1982) are invalid where this ice contains subglacially derived debris, particularly if this is regelation ice.
The theory developed above applies to a large-scale closed system in a steady state in which net basal melting in one part of the glacier is balanced by net basal freezing in another part. It can clearly be extended in a simple way to several partially open systems:
-
(a) Where only part of the total subglacial melt-water discharge is consumed by regelation ice and the rest is dis-charged from the glacier snout or into a further zone of melting. In this case, the glacier terminus or the new melting zone would be represented by a point in Figure 2 to the right of the left-hand margin of the graphs. The composition of last-formed regelation ice and the melt-water discharge would be given by corresponding points on the curves. A bore hole which reaches a glacier bed in the regelation zone will also miss the last, isotopically light, regelation fractions.
-
(b)
-
(i) Where surface melt water reaches the glacier sole to mix with subglacially derived melt water. This mixing could occur in a general zone of basal melting, from which the mixed melt water would flow on into a closed freezing zone and undergo progressive fractionation as shown in Figure 2.
-
(ii) Alternatively, surface melt water could also reach the glacier sole in a general zone of freezing. Net freezing-on occurs at the base of a glacier where there is strong surface cooling and a strong internal temperature gradient which conducts away the latent heat produced by basal freezing. The upward decrease in temperature effectively seals the glacier bed against penetration of surface melt water along relatively narrow, easily frozen conduits. Thus, unless there are large open water conduits to the glacier bed, most subglacial water will be basally produced. However, if major crevasses are open to the bed, surface melt water may penetrate rapidly, import sufficient heat to prevent freezing, and warm the glacier bed in broad zones around them (Fig. 8). In this case, local water inputs would be frozen to the glacier bed near to the input zones.
-
-
(c) Loss of basal melt water from the melting⁄regelation system into a subglacial aquifer. If this occurred in the zone of melting, or just into the zone of regelation, its effect would largely be to diminish the thickness of the regelation ice which would form from any residual water. If it occurred towards the distal extremity of the regelation zone, the effect would be to lose the last-formed isotopically light regelation fraction.

Fig. 8 Isotopic profiles in the basal part of Matanuska Glacier (from Reference LawsonLawson and Kulla, 1978). The data from the few transects reported by them are related to datum points at the boundary of diffused and dispersed ice facies, and the top of the stratified ice facies (debris-rich regelation ice).
Reference LawsonLawson (1979) published δl8O values from profiles through the basal part of Matanuska Glacier in southern Alaska, where he believed normal glacier ice overlay up to 15 m of regelation ice. He suggested that this latter was derived by freezing-on of subglacially flowing melt water, and that as the glacier was crevassed in the thin terminal zone that much of the frozen-on melt water was derived from local surface sources. His transects (Fig. 9) all show higher δ18O values in the presumed regelation ice than in the overlying normal ice. His regelation zone comprised a stratified ice⁄debris facies, and normal ice was described as a diffused ice⁄debris facies, with a thin transitional dispersed facies between them.

Fig. 9 a and b. Postulated zones of melting and refreezing produced when crevasses allow melt water to penetrate to the bed of otherwise cold glaciers.
The sudden increase in δl8O across the contact between diffused⁄dispersed facies and stratified facies supports the idea that the latter is regelation ice and that isotopic frac-tionation occurred during its formation, as suggested by Reference LawsonLawson (1979) and Reference Lawson and KullaLawson and Kulla (1978).
How could this general model of the progressive frac-tionation by continuous freezing of water from a single subglacial source (Fig. 2) apply to Matanuska Glacier? Three explanations, based on those set out above, seem possible.
(i) Closed system with a single subglacial water source
Assume that melt water derived from zone B‒C (Fig. 1) progressively freezes to the glacier sole in zone C‒D. Let us assume that complex deformation patterns have destroyed the original isotopic pattern in the basal debris-rich zone (Reference LawsonLawson (1979, fig. 5) showed complex folding in this zone which contrasts with overlying zones), but that sampling has produced a reasonable estimate of the true isotopic variation. The range of variation is 4.5‰. The isotopically heavy ice will have formed at the up-glacier extremity of the freezing-on zone and the isotopically light ice either at the sampling site, if the freezing-on zone extends to the site, or at its down-glacier extremity if it does not. From Figure 2, an isotopic range of 4.5‰ will be achieved when Q⁄Q 0 = 0.22, that is when 78% of the original melt water has been frozen to the glacier sole and the rest still flows subglacially beneath the site. Thus, this could not be a closed system, but would be analogous to variant (a) above, being open at the distal extremity. For a maximum δ value in the regelation ice of –19.7‰, which according to this model would be produced at the up-glacier extremity of the freezing-on zone, the basal ice from which the melt water was derived would have had a value of –16.7‰. However, the basal 10 m of normal glacier ice at the sampling site has a mean δ value of –25.37‰, which would need to have been underlain by isotopically heavier ice in the melting zone if this model is correct. However, as lower ice is derived from a higher elevation, we normally expect a reduction in δ values towards the glacier bed, which does indeed occur in the diffused facies of Matanuska Glacier. We thus reject this explanation.
(ii) Partially open system with surface ingress in the melting zone
In this model we allow surface water to reach the glacier sole in a zone of basal melting (B‒C; Fig. 1), to mix with subglacially melted water, and to flow into a freezing-on zone (C‒D; Fig. 1).
In this case, the fractionation model would be the same as in the previous case, with the sample site lying in the freezing-on zone after 78% of melt water had frozen to the glacier sole and with a water input into the freezing-on zone of δ –16.7. In this case, however, the production of such water would be envisaged as resulting from melting of local precipitation and old ice at surface (Lawson has suggested surface precipitation in the range δ = 3‒14‰) which mixes with isotopically lighter basal melt water.
(iii) Partially open system with multiple sources in a deeply crevassed glacier
The limited isotopic range of 4.5‰ in the regelation ice at the Matanuska Glacier sampling site suggests that fractionation does not progress to its limit when regelation is complete and a final fraction is about 9‰ lighter than the first fraction (Fig. 2). A great deal of the variability might reflect variability of input, and the mean of δ = –16.7 could reflect surface melt water mixed from fresh precipitation and old ice in a situation similar to that of variant (a) above (Fig. 8). Thus, although hypothesis (c) and hypothesis (b) cannot be distinguished on the basis of the isotopic data, Lawson’s (1979) comments about the cre-vassed state of the glacier suggest that hypothesis (c) is the better.
Summary and Conclusions
-
(1) In cold ice sheets with a thermally complex basal boundary, refreezing of basal melt water occurs in a large-scale closed system and frequently produces thick sequences of regelation ice.
-
(2) Whereas melt water preserves the isotopic ratios of the parent ice, regelation ice formed from an excess of melt water is preferentially enriched in the heavy isotopes 2H and 18O. A theory of progressive fractionation of melt water and the regelation ice formed from it is developed for a subglaciat zone in which basal freezing-on progressively exhausts melt water from an adjacent zone of melting.
-
(3) The theory yields predictions about the mean isotopic ratios in regelation ice, the range of these ratios, and the vertical trend, together with the composition of subglacial melt water.
-
(4) The theory is tested by using Reference Budd, Budd, Jenssen and RadokBudd and others’ (1970) temperature and discharge model along the West Antarctic ice sheet flow line through Byrd Station. The isotopic composition of basal ice in the Byrd Station bore-hole core is predicted together with the com-position of basal melt water. All the isotopic characteristics of the basal regelation ice and melt water are predicted successfully apart from the precise nature of the vertical isotopic trend in the ice. We suggest that complex patterns of deformation which are likely to occur in basal debris-rich ice have re-organized isotopic trends.
-
(5) We also suggest that the isotopic composition of normal glacier ice destroyed in a zone of melting can be re-constructed from the composition of the regelation ice formed from its melt water. We suggest that ice destroyed by melting beneath the level of the lowest “normal” ice at Byrd Station had a δ18O ratio 2.0‰ lighter than the latter and that it may reflect the end of the penultimate glacial period.
-
(6) In ideal circumstances, the theory can be used to explain the significance of isotopic profiles through the basal horizons in glaciers which behave as closed systems or partially open sytems and in which net basal freezing-on is believed to have occurred. It can also be used as a means of deducing some characteristics of subglacial hydrology. In one case, Matanuska Glacier, Alaska, we deduce from the isotopic data that there is a strong influx of surface melt water which produces a relatively constant isotopic ratio within the subglacial reservoir from which regelation ice forms. This is thus an open system and there is no significant progressive fractionation.
-
(7) It is an important hypothesis in glacial geology that much subglacially derived debris in glaciers is incorporated by regelation of subglacial melt water. Our theory of isotopic fractionation during regelation successfully predicts many of the isotopic changes in basal debris-bearing ice, and thus gives strong support to the concept that regelation is a major agent of basal debris incorporation, and provides a further tool by which regelation ice can be identified.
-
(8) Although in ideal circumstances a complete record of fractionation might occur in basal ice, flow of the glacier over an irregular bed produces complex deformation in this basal ice which we expect in many cases to disrupt simple isotopic patterns. However, certain styles of deformation seem characteristic and some general conclusions are drawn about their effects. Heavily deformed and completely fractionated ice should at least retain an abrupt negative or positive isotopic deflection at the top of the regelation ice, and a range of δ values of at least 9‰, though other trends may be obliterated by deformation.


