


1. Introduction
Annual ice accumulation reflects the trend of precipitation rather than the actual amount because of ice mass loss caused by various degrees of melting, sublimation/evaporation (S/E) and snowdrifting (Stichler and others, Reference Stichler2001; Kang and others, Reference Kang2015). Ice loss in the Arctic, Antarctic and middle/low latitudes has been studied comprehensively using energy mass balance models driven by reanalysis data (van den Broeke and others, Reference van den Broeke2009; Lenaerts and others, Reference Lenaerts, van den Broeke, van de Berg, van Meijgaard and Kuipers Munneke2012; Mölg and others, Reference Mölg, Großhauser, Hemp, Hofer and Marzeion2012; Reijmer and others, Reference Reijmer, van den Broeke, Fettweis, Ettema and Stap2012; van Pelt and others, Reference van Pelt, Oerlemans, Reijmer, Pohjola, Pettersson and van Angelen2012; Noël and others, Reference Noël2016). Few studies have conducted similar assessments in relation to the Tibetan Plateau (TP) owing to scarce observations at high elevation and the generally poor performance of reanalysis data for this region (You and others, Reference You2014, Reference You, Min, Zhang, Pepin and Kang2015, Reference You, Bao, Jiang, Pepin and Moore2019); however, ice core research has been conducted to reconstruct climatic and environmental changes at atmospheric levels equivalent to the height of the TP (Hou and others, Reference Hou, Qin, Yao, Zhang and Chen2002; Kang and others, Reference Kang2015). In comparison with other proxies, sequences of precipitation events are usually well recorded in ice cores because the water is retained directly. However, the recorded precipitation with its embedded isotopic and chemical information can be modified by various postdepositional processes such as wind scour (Fisher and Koerner, Reference Fisher and Koerner1994), meltwater percolation (Taylor and others, Reference Taylor2001) and refreezing (Zhou and others, Reference Zhou, Nakawo, Hashimoto and Sakai2008), erosive and depositional sublimation (Stichler and others, Reference Stichler2001) and vapor diffusion (Johnsen and others, Reference Johnsen2000). Thus, the influence of postdepositional processes should be considered when interpreting precipitation sequences recorded in ice cores.
Recent studies found that glacial shrinkage in western China is more pervasive than previously realized, especially on the TP (Guo and others, Reference Guo2015; Yao and others, Reference Yao2012), where even deficits in the accumulation area are observed in certain regions, for example, Geladiandong, Namunani and Tanggula in central and southern parts of the TP (Kang and others, Reference Kang2015; Zhang and others, Reference Zhang, Kang, Gabrielli, Loewen and Schwikowski2015). Such findings raise new challenges in relation to ice core studies, and highlight the urgent need both to assess mass loss in ice cores and to identify its governing processes.
Use of ice cores to reconstruct past precipitation variation has been adopted widely in studies in western China (e.g. on the TP, and in the Tien Shan and Altai mountains) because it can enhance understanding of the long-term spatial patterns and evolution of alpine precipitation (Yao and others, Reference Yao1996; Hou and others, Reference Hou, Qin, Yao, Zhang and Chen2002; Kang, Reference Kang2011). Additionally, most meteorological observations in northwestern China are taken at locations on low-elevation plains or in river valleys, and provide only short-term precipitation data with uneven distribution (Kang and others, Reference Kang2010; You and others, Reference You2010). Moreover, horizontal and trace precipitation at high elevations cannot be collected efficiently using the observational instruments currently available (Sun and others, Reference Sun2018).
Therefore, consideration of integrated observations obtained at glacial drilling sites would provide opportunities for precise quantification of the amount of ice mass loss, and promote understanding regarding precipitation in alpine regions (or at high elevations). It would also support sustainable use of regional water resources and the development of land-use patterns in arid northwestern China (Immerzeel and Bierkens, Reference Immerzeel and Bierkens2012; Cauvy and others, Reference Cauvy-Fraunié2016; Qin and others, Reference Qin2017).
To quantitatively investigate ice loss and precipitation variations with consideration of depositional processes, this study assessed the climatic indictors (1960–2006) of the Laohugou (LHG) ice core (Cui and others, Reference Cui, Ren and Qin2010) in terms of the evolution from snow to ice, in situ mass balance, and climatological change, and analyzed the relationships with local meteorological and topographical conditions. In the LHG Glacier No. 12 region, one such integrated observation network established in 2008 is operated by the Qilian Shan Station of Glaciology and Eco-environment (Chinese Academy of Sciences). The network obtains routine observations of the glacier, and the local atmosphere, hydrology and ecology. In this study, the primary processes of ice mass loss that comprise S/E and meltwater loss were quantified using the bulk aerodynamic method (BAM) and the degree day model (DDM) on the basis of in situ S/E, mass balance, automatic weather station (AWS) and interpolated air temperature time series data. The influence of wind speed was considered in the BAM, but mass loss attributed to snowdrifting was neglected owing to its minimal impact (i.e. approximately only several millimeters water equivalent) (Gascoin and others, Reference Gascoin, Lhermitte, Kinnard, Bortels and Liston2013; Zhou and others, Reference Zhou2013; Mott and others, Reference Mott, Vionnet and Grünewald2018; Pramanik and others, Reference Pramanik, Kohler, Schuler, van Pelt and Cohen2019). Furthermore, the effect of snow avalanches was also neglected because the study site is in a large reasonably flat area (slope: ~3°). Owing to the urgency of the need to assess mass loss in ice cores under the background of unprecedented glacial shrinkage, we used very scarce integrated observations to quantify the mass loss of an ice core from the northeastern TP to gain accurate understanding of the variations in alpine precipitation at high elevations.
2. Material and methods
2.1. Study region
This study was conducted on LHG Glacier No. 12 (39°26.4′N, 96°32.5′E; RGI 60-13.33006, Fig. 1), which was the first designated monitoring glacier in China owing to it being an extreme-continental type glacier and the largest valley glacier in the Qilian Mountains. The Qilian Shan Station originally operated from 1958 until 1962, but was then recommissioned in 2008. In 2006, a shallow ice core was retrieved at the firn basin (elevation: 5040 m a.s.l.), where the annual air temperature on the glacier surface is −11.8°C, annual precipitation is ~424 mm w.e., melting is minimal (Sun and others, Reference Sun2012; Chen and others, Reference Chen2018), and ice flow is slow owing to the relatively flat terrain (Du and others, Reference Du, Qin, Kang, Cui and Sun2016a).
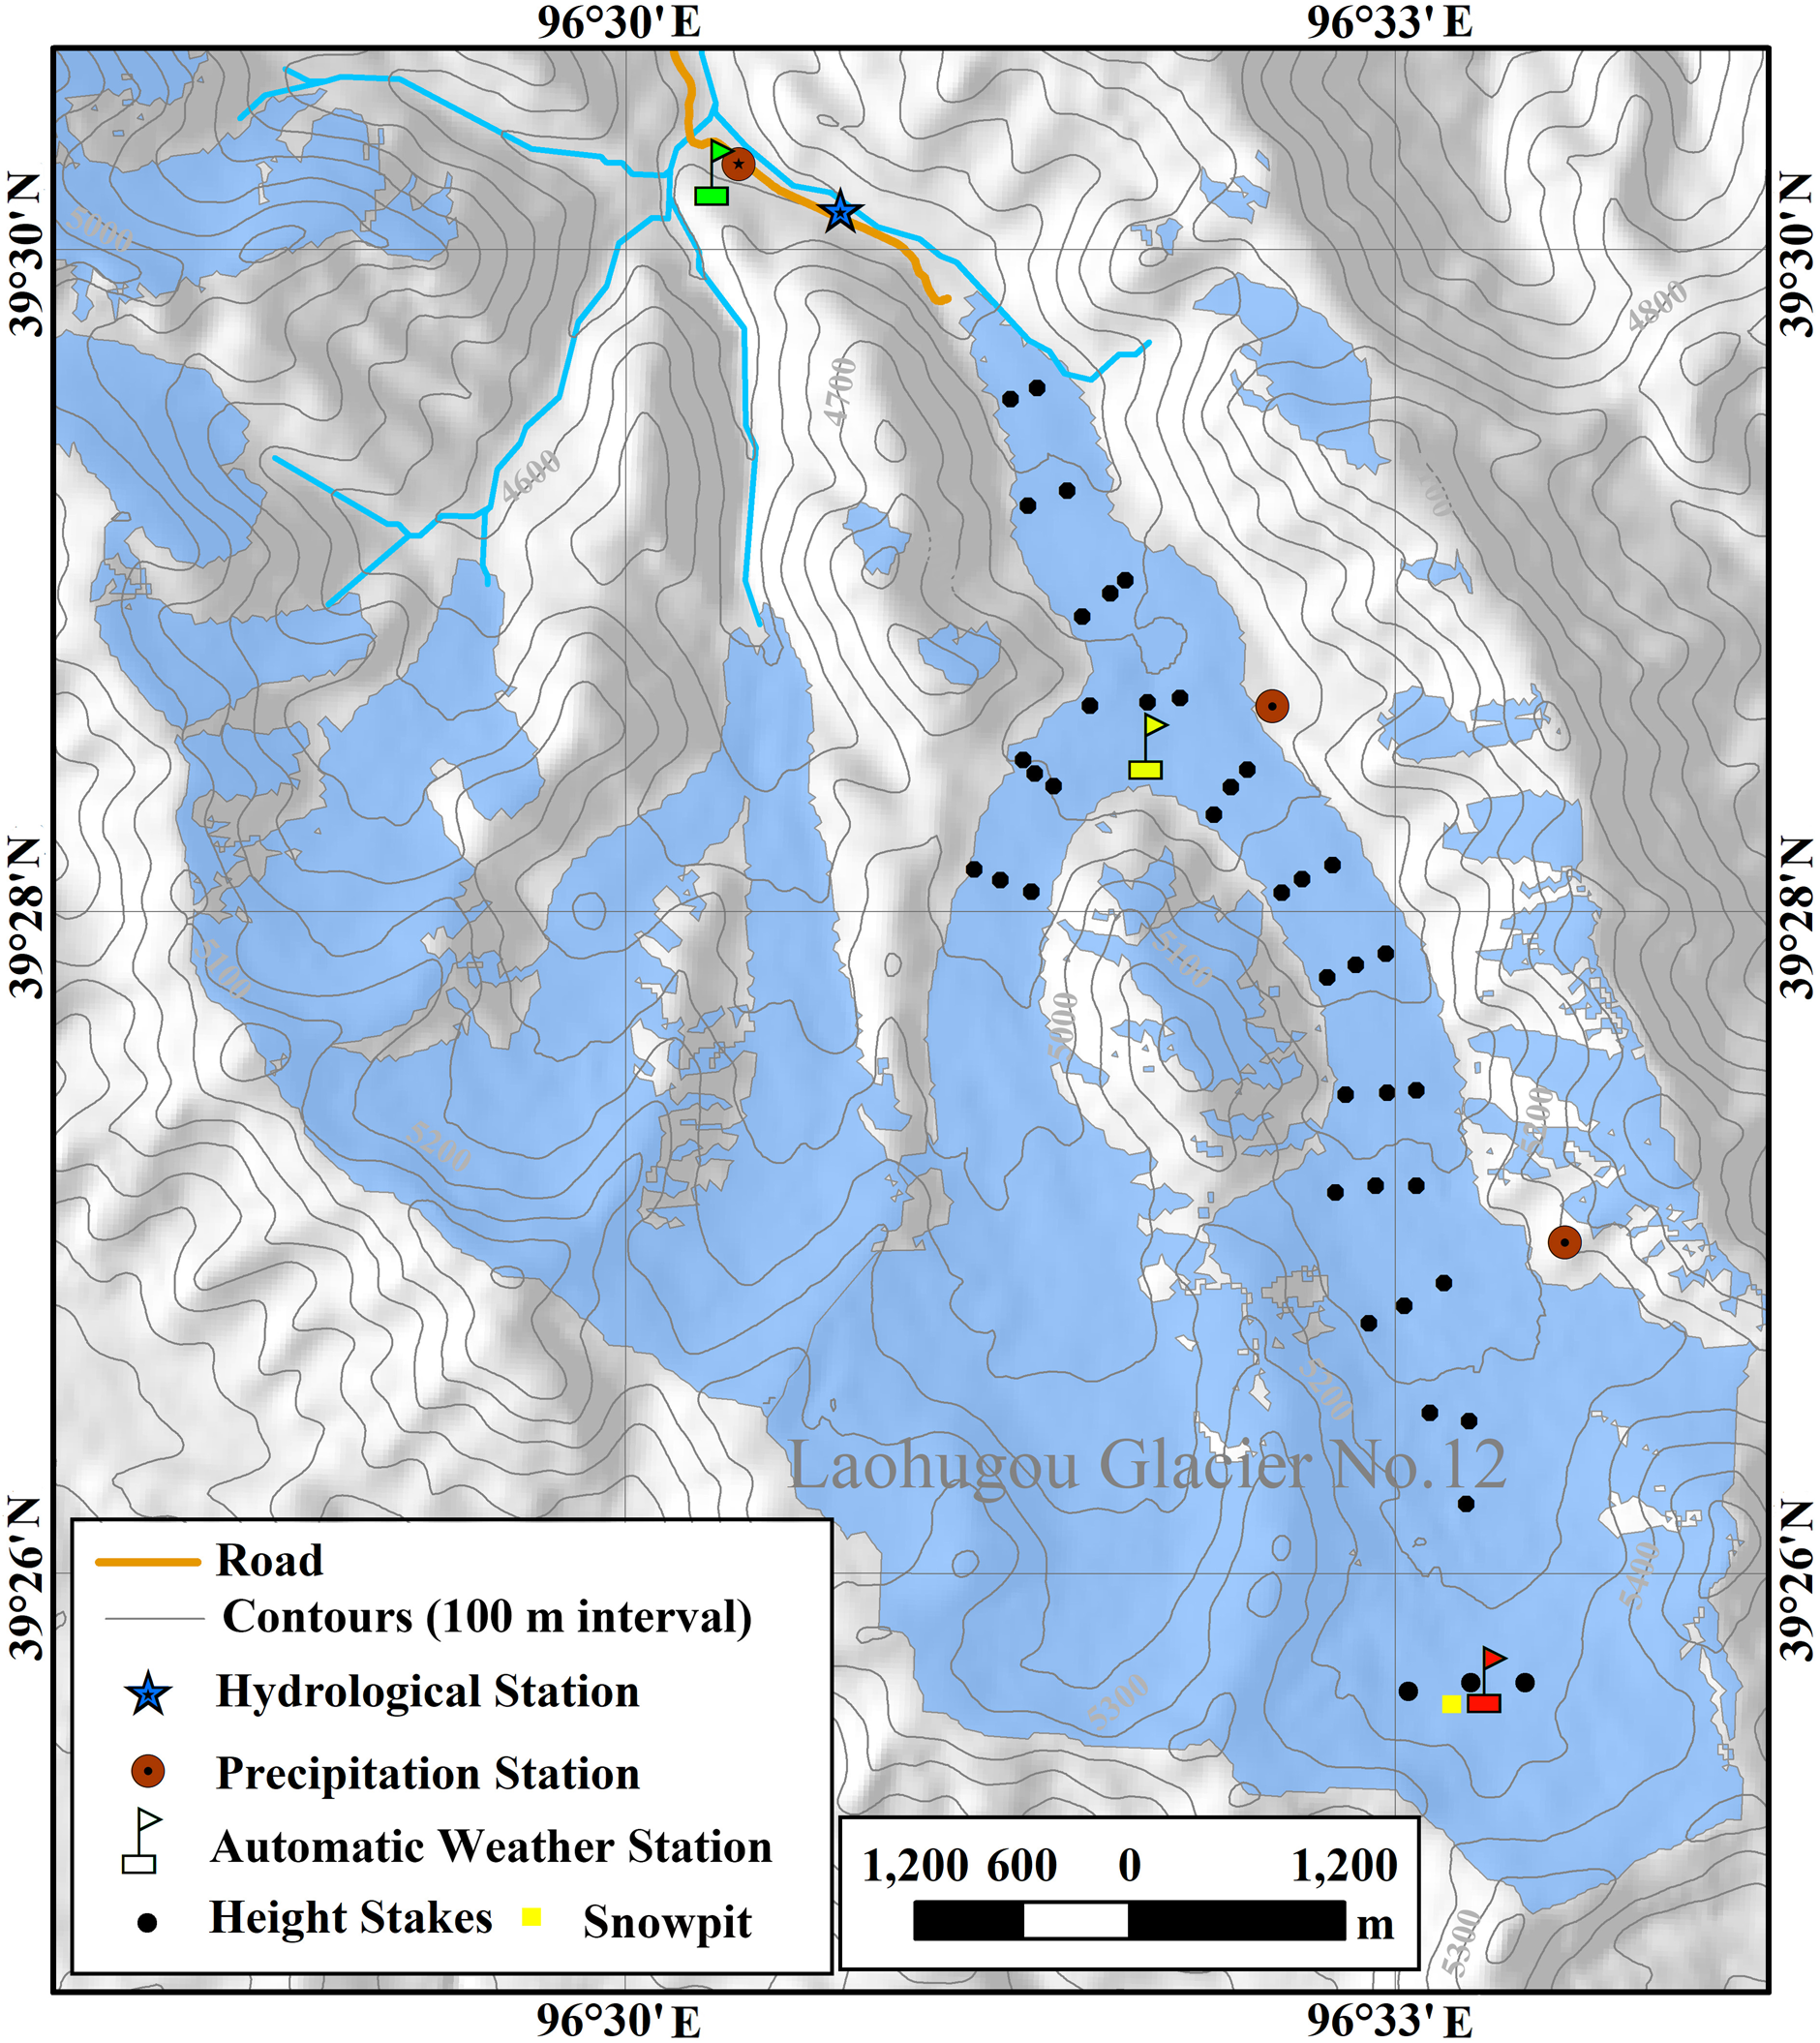
Figure 1. In situ observation network on Laohugou Glacier No. 12.
2.2. Data
2.2.1. Automatic weather station meteorological dataset
One AWS-C (red flag in Fig. 1) was deployed at the drilling site (39°25′39.5″N, 96°33′21.8″E; 5040 m a.s.l.) on LHG Glacier No. 12 in 2009. Air temperature, relative humidity, wind speed and wind direction were measured at two heights (1.5 and 3 m). Air pressure, incoming shortwave radiation, reflected shortwave radiation, incoming longwave radiation and outgoing longwave radiation were measured at one height (1.5 m). Measurements were taken synchronously every 10 s, and 30-min means of the measurements were recorded. Two similar AWSs operated in the ablation region (yellow flag in Fig. 1, 4550 m a.s.l.) and base camp (green flag in Fig. 1, 4260 m a.s.l.) during 2009–2015. Maintenance of the AWSs was conducted twice monthly during May–October each year. Because meteorological observations might contain errors resulting from nonconsecutive measurements, outliers and missing data, several methods were adopted prior to data analysis to eliminate erroneous data and to fill missing values (Sun and others, Reference Sun2017). Erroneous data were manually checked, validated and corrected or removed. Missing precipitation data over a period of one or two days were filled using the average precipitation values of neighboring days; if more than two consecutive days had missing data, the missing values were replaced with the long-term averages for the same days.
2.2.2. Mass balance
Determination of the annual mass balance using the direct glaciological method relies on repeated measurements taken at stakes and snow pits on the glacier surface. Glacier ablation can be obtained by subtraction between the observed mass balance and mass accumulation (solid precipitation). Near to the drilling site, three stakes were placed to measure the relative change of snow surface height, and snow pits were dug to measure the depth and density of different snow layers to obtain water equivalent values. Those observations were conducted at intervals to calculate the mass balance by combining changes of snow surface height and water equivalent values from the snow pits. In this work, the observations were performed at the drilling site at one-month intervals during May–September in 2011 and 2012.
2.2.3. Reconstruction of monthly air temperature during 1958–2008
We collected observational temperature data in the LHG glacier region (1959–1961, 2008–2009) and from six meteorological stations (Duanhuang, Yumenzhen, Jiuquan, Tuole, Lenghu and Dachaidan) to reconstruct temperature change at the drilling site. The observations from 1959–1961 were used for calibration, while the in situ temperature data acquired during 2008–2009 were used for validation. First, methods such as ordinary Kriging, inverse distance weighting, spline functions, multiple regression analysis and regional climate model simulations adjusted for elevation were trialed to select the optimal approach, which was ultimately determined as ordinary Kriging. Meanwhile, both the in situ lapse rate at different elevations and the thermocline coefficient between the land and the glacier were also considered. Finally, the temperature change at the drilling site was reconstructed (Du and others, Reference Du, Qin, Sun, Liu and Hou2011).
2.2.4. LHG ice core
In June 2006, a 20.12 m ice core was retrieved from the firn basin of LHG Glacier No. 12 (39°25′39.5″N, 96°33′21.8″E; 5040 m a.s.l.). It was cut into consecutive 3–5 cm samples at a temperature of −5°C. The oxalate, fluoride and other main ions were analyzed. Oxygen isotope analysis and β activation grade analysis were also performed. Using a multiparameter method based on the seasonal variation characteristics of δ18O, the main ions, the β activity in 1963, and the visible dirty layers deposited during winter and spring seasons, the ice core was dated to the period of 1960–2006, with average resolution of 11–12 samples per year (Du and others, Reference Du, Qin, Kang, Cui and Sun2016a).
2.3. Methods
Ice core mass loss is generally attributable to melting, S/E, snowdrifting, and avalanches. In this work, melting and S/E were considered the primary sources of ice mass loss, while the effects of snowdrifting and avalanches were ignored; the reason for this is discussed in section 4.1. Both the DDM and the BAM were used to determine melting and S/E. It should be noted that ice core mass loss was attributed solely to S/E until 1996 because slight melting was fully preserved in the snow pit, as analyzed in section 3.1. After 1996, ice core mass loss consisted of both S/E and melting, as analyzed in section 3.2.2. Because the only meteorological variable that could be obtained is temperature, we constructed a quantitative relationship between temperature and mass loss (S/E & meltwater loss). First, we established a temperature-based S/E reconstruction to obtain S/E during the entire period (see section 3.2.1). Second, the drastic melting period with meltwater loss was determined using the Mann–Kendall test for positive degree days (PDD) and using the DDM to calculate ablation, from which we subtracted S/E to quantify the meltwater. Using the meltwater freezing ratio determined through a designed contrast test, we obtained the meltwater loss (see section 3.2.2). Further details regarding the methods are described in the following.
2.3.1. Bulk aerodynamic method
Generally, S/E is calculated from the latent heat flux at the glacial surface, which can be determined more accurately based on datasets of on-glacier meteorological measurements than based on off-glacier measurements (Gabbi and others, Reference Gabbi, Carenzo, Pellicciotti, Bauder and Funk2014). The BAM has been used successfully to calculate the latent heat flux on LHG Glacier No. 12 (Sun and others, Reference Sun2012, Reference Sun2014, Reference Sun2017; Chen, Reference Chen2014). In this study, the BAM was used to calculate the latent heat fluxes (following Eqn (1)), and the inputs included wind speed and air and glacier surface humidity. The most important parameters in the BAM are the roughness lengths for momentum (Zom), and humidity (Zoq), following Sun and others (Reference Sun2012, Reference Sun2014).
The analytical expression used for the latent flux was as follows (e.g. Oke, Reference Oke1987):

where ρ is air density at 5040 m a.s.l., k is the von Karman constant (k = 0.4), u and q are wind speed (m s−1), and specific humidity (dimensionless), respectively, at height z, q s is the surface specific humidity (assumed saturated at the surface), Ls is the latent heat of sublimation of snow or ice (2.834 MJ Kg−1), and Zom and Zoq are the surface roughness lengths (m) for momentum, and humidity, respectively. The nondimensional stability functions for momentum (Φm, i.e. 0.9 mm), and moisture (Φv) are expressed as a function of the bulk Richardson number including the stability correction (Andreas, Reference Andreas1987; Sun and others, Reference Sun2012). Roughness is a temporal parameter with a differential spatiotemporal pattern, resulting in uncertainty of the latent heat and sensible heat fluxes. Additionally, the change in the height of the AWS attributable to the ablation also causes error.
2.3.2. Degree day model
The DDM has been applied successfully to estimation of ablation in relation to many glaciers and ice sheets globally (e.g. Braithwaite and Zhang, Reference Braithwaite and Zhang2000). The ablation of snow/ice (M) is calculated on the basis of the strength of ablation (DDF) and the sum of the daily mean temperatures above the ablation point (PDD) during a certain period:


where Tt is the daily mean air temperature (°C), and Ht is a logical variable (Ht = 1 for Tt ≥ 0°C and Ht = 0 for Tt < 0°C).
In this work, some important parameters including the ablation time, DDF, PDD and meltwater refreezing ratio (MRR) were determined following data analysis, as discussed in section 3.2.2.
2.3.3. Mann–Kendall test
In this study, the Mann–Kendall test was used to detect abrupt changes in the long-term data series. However, if the intersection was outside the confidence interval, we employed another method (i.e. the moving t test technique) to analyze the stationarity data. In this approach, UF is the forward sequence that follows the normal distribution, indicating the change trend, while UB can be denoted by reversing the data series based on the same equation. The approximate time of occurrence of the change point can be located according to the intersection between UF and UB within the confidence interval. In this study, testing of the trends was performed with a significance level of α = 0.05. In the resulting figure, the y-axis represents the UF and UB results obtained using the Mann–Kendall test (Hamed and Rao, Reference Hamed and Rao1998).
3. Results
3.1. Reliability and validity of the LHG ice core
The LHG ice core was extracted from a central position in a large firn basin without steep surrounding mountains on LHG Glacier No. 12, where the surface was reasonably flat (slope: ~3°). This site is highly suitable for storing snow and ice because of the minimal ice flow on the decadal timescale and the virtual impossibility of snow avalanches. Furthermore, the annual temperature is approximately −12°C, and there are only approximately 20 days per year (mostly during July and August) when the daily temperature is >0°C. The cold climate allows meltwater to be well stored in the snow layer of the past year, although percolation of meltwater into lower snow layers could occur (Cui and others, Reference Cui, Ren and Qin2010, Reference Cui2014). On LHG Glacier No. 12, glacial winds prevail throughout the year and mountain–valley winds dominate in spring and summer (Du and others, Reference Du, Qin, Sun, Liu and Hou2012). Although snowdrifting can redistribute some of the surface snow, its contribution to mass change can be considered negligible because only minor differences (i.e. several millimeters water equivalent) have been reported for adjacent regions (Zhou and others, Reference Zhou2013). The depth of the snow pits dug at the drilling site in the summers of 2006, 2008, 2009 and 2010 were in the range of ~80–200 cm. Snow chemistry analysis revealed evident seasonal variation in both the stable oxygen isotopes and the dust layers of the snow pits (LIGG, 1988; Cui and others, Reference Cui2014; Yu and others, Reference Yu2014; Zhang and others, Reference Zhang2017), indicating that annual information could be extracted.
The contribution of S/E to ice core mass change was substantial. The amount of annual melting at the drilling site, calculated using the mass balance and the energy balance model, was ~110 mm w.e., that is, greater than the measured value attributable to refreezing and far less than the annual accumulation. In terms of homologous consistency between the ice core records and the in situ measurements, it can be concluded that postdepositional effects on the LHG ice core would be sufficiently small to be ignored (Du and others, Reference Du, Qin, Kang, Cui and Sun2016a, Reference Du, Kang, Qin, Cui and Sun2016b).
Considering the above discussion, it is recognized that the LHG ice core should be a reasonable indicator of historic climatological and environmental trends. To retrieve actual precipitation, this study considered two principal processes of ice core mass loss: meltwater loss during short melt times and S/E throughout an entire year.
3.2. Quantification of mass loss of the LHG ice core
3.2.1. Mass loss caused by sublimation/evaporation (S/E)
The principal cause of mass loss at the drilling site might be S/E, especially during the cold seasons (Sun and others, Reference Sun2012). To reconstruct S/E since 1960, it was necessary to establish a relationship between S/E and air temperature because only air temperature data were available for the entire study period.
Latent heat flux at both the accumulation zone during 2011–2012 and the ablation zone during 2009–2015 was calculated using the BAM; full details of the method are described in Sun and others (Reference Sun2012, Reference Sun2014, Reference Sun2017). The method included an initial stability correction. Then, connections between monthly mean S/E and monthly mean temperature, wind speed and water vapor pressure were investigated comprehensively (Fig. 2). Although wind speed directly influences latent heat flux, no significant relationship between S/E and wind speed was found (Fig. 2b) owing to the low variability in wind speed (range: 2–4 m s−1). Monthly variation of S/E was similar to that of both water vapor pressure (Fig. 2c) and temperature (Fig. 2a) because water vapor is strongly correlated with temperature in different seasons (Chen and others, Reference Chen2018). At monthly intervals, S/E was found correlated positively in the cold seasons (January–April and October–December) with air temperature below −4.8°C, whereas S/E was found correlated negatively in the warm seasons (May–September) with air temperature of above −4.8°C (Fig. 2a). There are several reasons for such a relationship between S/E and air temperature. Water vapor pressure on the glacier surface is always saturated, which is determined by the glacier surface temperature. As shown in (Fig. 2), during months with air temperature of below −4.8°C, the rate of increase of water vapor pressure in the air is slower than that of water vapor pressure on the glacier surface with increasing air temperature. Consequently, the water vapor pressure difference becomes larger, enhancing latent heat and S/E. Thus, S/E will increase following temperature rise in the cold seasons. During months with air temperature of above −4.8°C, with increasing air temperature, the surface ice temperature gradually reaches melting point, resulting in the water vapor pressure on the glacier surface reaching a saturated state corresponding to the melting point temperature, and it finally stops rising. Meanwhile, water vapor pressure in the air increases rapidly with rising temperature, such that the difference in water vapor between the glacier surface and the air decreases, resulting in reduced latent heat (Fig. 2).

Figure 2. Relationships between monthly sublimation/evaporation (S/E) and monthly average (a) temperature, (b) wind speed and (c) water vapor pressure. Black straight line denotes linear regression between S/E and air temperature when the temperature is below (above) −4.8°C.
Given the distinct connection between S/E and air temperature, monthly S/E since 1960 was reconstructed using only the temperature data in the time series. A series of threshold values from 4–6°C was considered at intervals of 0.2°C, and two linear regressions were performed between S/E and temperature at each interval: one for the negative threshold in the cold seasons and one for the positive threshold in the warm seasons. The best match with the observations was identified at −4.8°C (Fig. 2a), with r = 0.66 (n = 102, p < 0.05) and root mean square error of ± 2.7 mm w.e.
For both the warm–wet and the cold–dry seasons, S/E was reconstructed on the basis of the following regression equations:


where Tm is monthly air temperature. As shown in Figure 3a, there was no obvious trend of S/E in the warm–wet seasons prior to 1990, but there was a trend of slight increase after 1990. In the warm–wet seasons, S/E varied from 34.55 mm w.e. (in 1976) to 44.84 mm w.e. (in 1979); the median and mean values were 35.04 and 36.84 ± 1.54 mm w.e., respectively. In the cold–dry seasons (Fig. 3b), S/E increased after 1979 (slope = 0.16 mm w.e. a−1, p < 0.05) from 40.21 mm w.e. (in 1979) to 57.1 mm w.e. (in 1998); the median and mean values were 47.89 and 49.87 ± 3.2 mm w.e., respectively. In summary, the highest, lowest, median, and mean values of annual S/E were 95.08 mm w.e. (in 1998), 78.97 mm w.e. (in 1967), 82.93 and 86.71 ± 3.52 mm w.e., respectively (Fig. 3c). Although S/E diminished with increasing temperature in the warm seasons, it appeared to increase with increasing temperature in the longer cold seasons, especially after 1991 (1961–1990: slope = 0.1 mm a−1, failed to pass the confidence test; 1991–2005: slope = 0.31 mm w.e. a−1, p < 0.05). Since the 1990s, the increase in S/E during the cold seasons has been stronger than the decrease during the warm seasons (1998–2005: slope = −0.035 mm w.e. a−1, failed to pass the confidence test), resulting in overall annual increase. On the basis of the Mann–Kendall test, we can conclude that this trend of increase from the 1970s had an abrupt change point at 1993. Thus, the average annual S/E was 85.2 mm w.e. before 1992, after which it increased to 90.42 mm w.e. Although S/E was increasing prior to 1992 (slope = 0.106 mm a−1, p < 0.05), its rate of increase accelerated markedly after 1992 (slope = 0.438 mm w.e. a−1, p < 0.05).

Figure 3. Reconstructed sublimation/evaporation (S/E) since 1960. (a) warm–wet seasons, (b) cold–dry seasons and (c) annually (error bars in gray).
The increase in annual S/E at the drilling site, which is very different to the decline observed elsewhere in the Northern Hemisphere before 1993, can be explained as follows. The foremost reason is the substantial elevation difference. Typically, the higher the elevation, the more intense the solar radiation, the greater the wind speed, and the more dramatic the warming and the supply of water vapor in glacier/snow regions. Such conditions are conducive to higher S/E, especially in regions with elevation of >3000 m a.s.l., as confirmed in a previous study of a semiarid region (Schulz and Jong, Reference Schulz and de Jong2004). Furthermore, most observations of S/E in the Northern Hemisphere are acquired on plains, and the decreasing trend is weakened or even reversed with increasing elevation. For example, in Xinjiang Province in western China, the decrease in pan evaporation has been more drastic on the plains in comparison with that in alpine regions (Su and others, Reference Su, Wei and Han2003). The elevation at the drilling site of this study is >5000 m a.s.l., that is, much higher than that of the study site of Su and others (Reference Su, Wei and Han2003). Thus, it is very likely that the trend of S/E at the drilling site is flat or even increasing. The second reason is related to land surface type, for example, snow. The particular characteristics of the snow/ice surface and climate create a relationship of increasing S/E with temperature increase when the monthly air temperature is below −4.8°C. At the high elevation of the drilling site, monthly air temperature has generally always been below −4.8°C during autumn–spring. However, during the past 50 years, air temperature has increased, especially the winter temperature, which has led to increased S/E in those months in which air temperature is below −4.8°C. Although S/E in some warm months has diminished with warming, the months with air temperature below −4.8°C account for a larger proportion of the year; thus, the increase in winter air temperature has been more dramatic, leading to overall increase in S/E with global warming.
3.2.2. Mass loss caused by melting
Ice core mass loss attributable to meltwater was obtained by subtracting S/E and the meltwater refreezing from ablation, which can be calculated using the DDM. Total melting was considered to comprise meltwater loss and refreezing. Here, certain crucial points should be considered, for example, the melting condition (i.e. PDD), melting strength (i.e. DDF) and the MRR.
Ablation period: The PDD was calculated using reconstructed monthly temperature time series data for 1957–2008 (Fig. 4a) (Du and others, Reference Du, Qin, Sun, Liu and Hou2011). The monthly temperature in each year was assumed normally distributed. The Mann–Kendall test identified significant increase in PDD in 1997 (Fig. 4b), indicating temperature fluctuation in a similar range during 1960–1996. Following a previous study focusing on modern evolution processes from snow to ice on LHG Glacier No. 12 (Huang and Xie, Reference Huang and Xie1988), it can be concluded that climatic and environmental information for approximately two years could be well preserved in the snow layers at the drilling site. The Mann–Kendall test also showed that an abrupt change point in cumulative positive temperature occurred in 1996, indicating that significant warming since 1997 has intensified ablation and caused meltwater loss. According to instrumental temperature data from such a high-elevation site, the number of days per year with daily mean air temperature of >0°C is approximately 20, most of which occur during July and August, which means that almost all the annual ablation occurs in July and August. Thus, only data for July and August in each year during 1997–2005 were considered in the evaluation of meltwater loss.

Figure 4. (a) Variation in positive degree days (PDD) and (b) the results of the Mann–Kendall test. The statistic is result of Mann–Kendall test, which includes UF and UB. UF is the forward sequence that follows the normal distribution, indicating the change trend, while UB can be denoted by reversing the data series based on the same equation.
Ablation strength: Values of DDF at the drilling site were calculated at monthly intervals from May–September during 2011–2012. The values fluctuated greatly but were relatively stable in July and August with ranges of 4.73–5.5 and 2.5–3.6 mm °C−1 d−1, respectively (Fig. 5). Thus, the amount of melting during 2011–2012 was estimated using the mean DDF values of 5.12 mm °C−1 d−1 in July and 3.05 mm °C−1 d−1 in August.

Figure 5. Variation in monthly degree day factor (DDF) during 2011–2012 at the drilling site.
Meltwater refreezing ratio: In China, the MRR of glaciers is usually taken as 10%, which is a value based on limited observations conducted in both the Tien Shan Mountains and the Qilian Mountains (Xie and Liu, Reference Xie and Liu2010). However, the MRR of different glaciers and in different seasons is expected to vary widely. Thus, trials were undertaken in this study to determine an accurate MRR for the drilling site. We tuned the MRR from 0 to 100% at intervals of 1% until the revised ice accumulation with the tuned MRR best matched the instrumental precipitation on the annual scale. Precipitation observations from 11 meteorological stations surrounding the study site (Table 1) were collected to determine the best correlation with the revised ice accumulation. As shown in Figure 6a, the precipitation observed at Tuole displayed the best correlation with the revised ice accumulation, and further detailed analyses (as illustrated in Fig. 6b) indicated that an MRR value of 26% was optimal for the studied site.
Table 1. Location and elevation of 11 meteorological stations near the study site


Figure 6. Different scenarios of meltwater refreezing ratio (MRR) at 1% intervals (a) according to the relation between adjacent stations (see Table 1) and (b) the optimal value.
Because temperature rise displayed no obvious shift during 1961–1996, ablation intensity and information preservation in the layers of the snow pits did not alter markedly. It can be concluded that meltwater was completely preserved in the snow pit because the total ablation amount was less than the maximum water storage of the snow pit during this period. The annual meltwater loss during 1997–2005 showed a substantial difference of 34.2 mm w.e., that is, ranging from 57.4 mm w.e. (in 2000) to 23.2 mm w.e. (in 2003); the median and mean values were 54.51 and 43.11 ± 3.75 mm w.e., respectively. The meltwater loss increased during 1999–2000, then decreased until 2003 and then increased again in the following two years (Fig. 7c).

Figure 7. Variations in (a) ice accumulation, (b) S/E loss, (c) meltwater loss, (d) revised ice accumulation and (e) precipitation at Tuole (TL) station during 1961–2005.
3.3. Precipitation signals from revised annual ice accumulation
Adding S/E and meltwater loss together, the mass loss of the LHG ice core in the northeastern TP was quantified as the revised annual ice accumulation (Fig. 7d). It increased significantly until the 1980s (slope = 16.7, p < 0.05), following which it began to decrease. The relative difference was 558.75 mm w.e. between the largest annual ice accumulation in 1992 (768.59 mm w.e.) and the smallest in 1961 (209.83 mm w.e.). The median and mean values were 631.93 and 490.73 ± 125.57 mm w.e., respectively, that is, greater than their original values. The revised range and variance were both broadly unchanged, as were the trend, periodicity and time of the abrupt change. This indicated that the variation of alpine precipitation was well recorded in the mass loss of the LHG ice core.
During 1961–1996, the revised annual ice accumulation was well correlated with the observations recorded at the Tuole and Lenghu meteorological stations (r = 0.32, p < 0.05), where ice mass loss occurs only via S/E. Correlation with precipitation at Tuole station was stronger (r = 0.475), but it failed to pass the confidence test when meltwater loss was taken into account during 1997–2005. Over the entire period, the most significant relationship between the revised annual accumulation and ambient precipitation was detected for Tuole station (Figs 7d and e). The elevation effect on increasing precipitation was notable as a trait of alpine precipitation. It should be noted that qualification of mass loss promotes understanding of alpine precipitation, especially in high-elevation regions.
4. Discussion
During 1961–2005, the average annual mass loss in the ice core was 95.33 ± 20.56 mm w.e. (minimum: 78.97 mm w.e. in 1967, maximum: 146.67 mm w.e. in 2001), while the average ratio of the revised annual ice accumulation was 21.2 ± 7.7% (minimum: 11.0% in 1992, maximum 44.8% in 2000). Thus, over the entire study period, the average annual S/E was 86.71 ± 3.52 mm w.e. (minimum: 78.97 mm w.e. in 1992, maximum: 95.08 mm w.e. in 1961), while the average ratio of the revised annual ice accumulation was 19.32 ± 6.17% (minimum: 11% in 1974, maximum: 44.79% in 2000). Meanwhile, since 1997, the average annual meltwater loss was 43.11 ± 3.75 mm w.e. (minimum: 23.2 mm w.e. in 2003, maximum: 57.4 mm w.e. in 2000), while the average ratio of the revised annual ice accumulation was 9.21 ± 3.9% (minimum: 4.25% in 2003, maximum: 17.61% in 2000).
4.1. Comparison of S/E on different glaciers
The mass loss of the LHG ice core in the northeastern TP was less than that of a valley glacier (33%) in South America and the Cerro Tapado ice core (50.86%) obtained in the Chilean Andes (Ginot and others, Reference Ginot, Kull, Schotterer, Schwikowski and Gäggeler2006). Most importantly, ice cores drilled on Mt. Naimona'nyi (6050 m a.s.l.) in 2006, Mt. Nyainqentanglha (5850 m a.s.l.) in 2002, and Mt. Geladaindong (5750 m a.s.l.) in 2005 revealed the absence of certain critical reference chemical peaks (e.g. Tritium), suggesting that mass loss causes shrinkage of the top accumulation zone of glaciers in central and southern parts of the TP (Kang and others, Reference Kang2015; Zhang and others, Reference Zhang, Kang, Gabrielli, Loewen and Schwikowski2015).
Owing to the ever-present and increasingly severe mass loss of glaciers, it is necessary to investigate the spatial pattern of S/E and its potential drivers. However, comparison of S/E determined for different locations can be somewhat problematic because of different experimental methodologies, observation times and site elevations. The S/E of many glaciers in different parts of the TP are listed in Table 2. It can be seen that S/E at the drilling site on LHG Glacier No. 12 (86.7 mm w.e.) is similar to that obtained for the Qiyi Glacier and Urumiqi Glacier No. 1; however, it is smaller than that of most glaciers in western, northern, southern and central parts of the TP. There are two exceptions to this patten: Parlung Glacier No. 94 in the southern TP and Xiao Dongkemadi Glacier in the central TP, where S/E is smaller than that determined for LHG Glacier No. 12. The pattern of S/E of the listed glaciers might reflect the effects of dramatic solar dimming over the southern TP and wind stilling in the northern TP (Zhang and others, Reference Zhang, Ren, Yin, Lin and Zheng2009; Yang and others, Reference Yang2014).
Table 2. Comparison of sublimation/evaporation (S/E) on different glaciers

In contrast, the Antarctic continent with its cold, dry climate and relatively high temperatures in summer effectively promotes water vapor diffusion from the snow/ice surface to the air such that the latent heat of sublimation/evaporation is the leading energy expenditure (Bintanja and van den Broeke, Reference Bintanja and van den Broeke1995). The combined processes of surface and blowing snow sublimation are estimated to remove 29 mm w.e. a−1 over Antarctica, disposing of approximately 17–20% of the annual precipitation (Déry and Yau, Reference Déry and Yau2002). In the Arctic, especially the Greenland Ice Sheet, total sublimation ranges from −0.62 ± 0.25 × 10¹⁴ to −1.2 ± 0.65 × 10¹⁴ kg a−1, indicating 12 or 23% precipitation loss, respectively (Box and Steffen, Reference Box and Steffen2001). Mass loss from sublimation (32 mm w.e. a−1) at the Greenland Summit (center of dry snow zone: 72°35′N, 38°28′W; 3203 m a.s.l.) is thought to remove approximately 10% of the mass gain from annual precipitation (Cullen and others, Reference Cullen, Mölg, Conway and Steffen2014). It is important that mass loss by sublimation is not neglected, irrespective of elevation or latitude of the glacier (Potocki and others, Reference Potocki2022).
4.2. Causes of S/E at different regional scales
Pan evaporation at most locations in the Northern Hemisphere has been decreasing over the past several decades (Peterson and others, Reference Peterson, Golubev and Groisman1995), and a similar trend has been observed throughout most of China except in the northeast (Liu and others, Reference Liu, Xu, Henderson and Gong2004). The observed decrease in evaporation, which contradicts theoretical analysis that suggests it should increase with the effects of global warming, is known as the pan evaporation paradox (Roderick and Farquhar, Reference Roderick and Farquhar2002). However, the observed decreases are consistent with widespread decreases in solar irradiance, wind speed and diurnal temperature range. In China, the greatest decline has occurred in the northwest, while the lowest decline has been in the southwest, with descending rates of decline moving from the northwest to the south and to the east. This spatial pattern of pan evaporation is anticorrelated with the distribution of summer precipitation, implying that atmospheric humidity plays a critical role in pan evaporation. Air temperature is another important climatic driver because prediction performance can be improved substantially in northwestern China and on the TP through consideration of air temperature in multiple regression models between meteorological parameters and evaporation; however, improvement at the national level has not been realized (Liu and others, Reference Liu, Xu, Henderson and Gong2004). It has been observed that pan evaporation has increased greatly at the stations of Dunhuang and Mazongshan in Gansu Province, which are two nearby stations in the same administrative region as the study site. This is attributed to air temperature increase rather than to wind, that is, thermal factors dominate evaporation (Wang and others, Reference Wang, Zhang and Han2010). Some studies have concluded that the diurnal temperature range has stronger correlation than other individual meteorological factors with pan evaporation in China because the diurnal temperature range is a remarkable reflection of multiple other factors (Liu and others, Reference Liu, Shen, Zeng and Liu2010).
The variation of S/E or that of the latent heat of snow/ice depends on the amount of turbulence at the surface, which is associated with the energy budget (i.e. sunshine duration and air temperature), water vapor transport (i.e. saturation deficit of water vapor and wind speed) and its mediums. Thus, in comparison with other meteorological variables, the gradient of specific humidity, temperature between the air and the snow/ice and wind speed are the most important factors of the climatic forcing behind S/E changes (Sun and others, Reference Sun2014; Guo and others, Reference Guo2018). As described earlier, S/E decreases with increasing air temperature during the melting seasons owing to the constraints imposed on its surface temperature by melting, while S/E is much higher during the cold seasons. Thus, annual S/E has increased since the 1960s because the temperature gradient has increased dramatically.
5. Conclusions
This study analyzed a new ice core spanning 1960–2006, obtained from LHG Glacier No. 12 in the western Qilian Mountains of the northeastern TP, using integrated glacier and meteorological observations to assess its climatic reliability and validity. The contributions of primary mass loss from S/E and meltwater loss were quantified using the BAM and the DDM, while minor contributions from both snowdrifting and avalanches were neglected. Analysis revealed that historical variations of precipitation were well recorded in the LHG ice core. During 1961–2005, the average annual mass loss in the ice core was 95.33 ± 20.56 mm w.e. (minimum: 78.97 mm w.e. in 1967, maximum: 146.67 mm w.e. in 2001), while the average ratio of the revised annual ice accumulation was 21.2 ± 7.7% (minimum: 11.0% in 1992, maximum 44.8% in 2000). Thus, over the entire study period, the average annual S/E was 86.71 ± 3.52 mm w.e. (minimum: 78.97 mm w.e. in 1992, maximum: 95.08 mm w.e. in 1961), while the average ratio of the revised annual ice accumulation was 19.32 ± 6.17% (minimum: 11% in 1974, maximum: 44.79% in 2000). Meanwhile, since 1997, the average meltwater loss was 43.11 ± 3.75 mm w.e. (minimum: 23.2 mm w.e. in 2003, maximum: 57.4 mm w.e. in 2000), while the average ratio of the revised annual ice accumulation was 9.21 ± 3.9% (minimum: 4.25% in 2003, maximum: 17.61% in 2000). Using the calculated mass loss, the revised mean, maximum and minimum values of annual accumulation were increased by 95.33, 84.6 and 83.8 mm w.e., respectively, in comparison with the original ice accumulation data. However, both the range and the variance of annual mass loss were effectively unchanged. Additionally, a quantitative formula expressing the relationship between S/E and air temperature at the annual scale was established, providing an improved method for assessment of S/E in the northeastern TP using time series temperature data. The annual variation in revised ice accumulation correlated best with precipitation recorded at Tuole station. The elevation effect on precipitation was remarkable, highlighting the trait of alpine precipitation throughout the entire period. This explorative research developed a method for quantitative assessment of the time-varying mass loss of ice cores, and advanced the reconstruction of long-term precipitation at high elevations. However, certain limitations of this study could be addressed in future work. Most importantly, the dataset of in situ observations should be extended temporally and spatially. Additionally, reanalysis data and satellite data might represent better choices for long-term and spatial reconstruction through data assimilation or bias correction based on in situ measurements (Guo and others, Reference Guo, Chen and Li2022; Srivastava and Azam, Reference Srivastava and Azam2022). Multisource meteorological data could provide opportunities for improving regional or long-term S/E simulations using physical methods such as the BAM and the Energy Balance Model, while sufficient in situ measurements would benefit calibration and support simplification of model parameters.
Acknowledgements, samples and data
This work was funded by the Gansu Provincial Science and Technology Program (22ZD6FA005), the Science Fund for Creative Research Groups of Gansu Province (Grant No. 23JRRA567), China Meteorological Administration Climate Change Special Program(CMA-CCSP:QBZ202308)and Chinese Academy of Sciences ‘Light of West China’ Program. We acknowledge Qilian Shan Station of Glaciology and Eco-environment for providing the in situ data. The data used in this study are available by contacting the corresponding author (shichang.kang@lzb.ac.cn). We thank James Buxton MSc, from Liwen Bianji (Edanz) (www.liwenbianji.cn), for editing the English text of a draft of this manuscript.


 Open access