


Introduction
Advection is a horizontal movement of mass that causes changes in temperature or other physical properties. It therefore describes the dominant type of flow in polar ice sheets. Advective flow is primarily determined by the longitudinal shear stress σxz down a column in the ice sheet. To a first approximation:
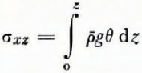
where ρ̄; is the mean ice density, g is the acceleration of gravity, z is depth down the ice column, and θ is the surface slope of the ice sheet at the top of the column in the longitudinal flow direction x.
Convection is a circulatory motion of mass having a non-uniform temperature owing to the variation of density and the action of gravity. It might be an important type of flow in polar ice sheets. Convective flow is primarily determined by the vertical buoyancy stress σzdown a column in the ice sheet. To a first approximation:
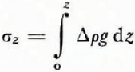
where Δρ,is the decrease of density with depth z down the ice column.
It can readily be shown that σ xz ≈ σz near the domes of polar ice sheets where ice is thick and the surface slope is small, Advective flow clearly occurs in these regions, so why not convective flow if their respective stresses arc comparable ? That is the question to be addressed in this paper.
Theory
Convection as a creep phenomenon
Figure 1 shows the idealized creep behavior of ice deduced from constant stress and constant strain-rate creep tests for polycrystalline and single-crystal ice specimens (Reference Griggs and ColesGriggs and Coles, 1954; Reference GlenGlen, 1955; Reference Higashi, Higashi, Koinuma and MaeHigashi and others, 1964,1965,1968; Reference Tabor and WalkerTabor and Walker, 1970; Reference Hawkes and MellorHawkes and Mellor, 1972; Ramseier, unpublished). Elastic deformation occurs during Stage I, decelerating creep deformation occurs during Stage II, constant creep deformation controlled by hard glide occurs during Stage III, accelerating creep deformation occurs during Stage IV, and constant creep deformation controlled by easy glide occurs during Stage V. Hard glide is slip on non-basal crystallographic planes (probably prismatic planes, which are parallel to the open axis of an ice crystal). Easy glide is slip on basal crystallographic planes (basal planes are normal to the optic axis of an ice crystal). Decelerating, constant, and accelerating creep are sometimes called primary (transient), secondary (steady-state), and tertiary creep. Decelerating creep (Reference MottMott, 1953) and constant creep (Reference Weertman, Whalley, Whalley and GoldWeertman, 1973) can be explained by dislocation climb theories. Accelerating creep is related to re-crystallization in polycrystalline ice, during which hard glide resulting from a randomly oriented crystal fabric is replaced by easy glide resulting from a crystal fabric with a strong preferred orientation. Accelerating creep in ice single crystals is related to the upper yield stress phenomenon (Reference Weertman, Whalley, Whalley and GoldWeertman, 1973).
The classical empirical expression of the creep curve considers total strain ϵ to be the sum of an elastic strain ϵe and a visco-plastic strain ϵv:

Fig. 1.
Idealized creep curves in ice. Shown are the effects of increasing temperature T, time t, strain ϵ, strain rate ![]() and stress σ, far (a) creep in polycrystalline ice under a constant stress, (b) creep in polycrystalline ice under a constant strain-rate, (c) creep in single-crystal ice under a constant stress, and (d) creep in single-crystal ice under a constant strain-rate. Stage I elastic deformation. Stage II is transient creep deformation. Stage III is steady-state creep deformation controlled by hard glide. Stage IV is creep deformation during recrystallization and during transition from hard glide to easy glide. Stage V is steady- state creep deformation controlled by easy glide. Solid lines are creep curves. Dotted lines separate creep stages.
and stress σ, far (a) creep in polycrystalline ice under a constant stress, (b) creep in polycrystalline ice under a constant strain-rate, (c) creep in single-crystal ice under a constant stress, and (d) creep in single-crystal ice under a constant strain-rate. Stage I elastic deformation. Stage II is transient creep deformation. Stage III is steady-state creep deformation controlled by hard glide. Stage IV is creep deformation during recrystallization and during transition from hard glide to easy glide. Stage V is steady- state creep deformation controlled by easy glide. Solid lines are creep curves. Dotted lines separate creep stages.
where
The total strain-rate given by Equation (3) is
where
Assume that thermally activated power-law dislocation mechanisms control both temporary and steady-state creep in ice. In this case
where
where single prime terms refer to time-dependent creep and double prime terms refer to time-independent creep.
For decelerating creep rates, o < m < 1 and for accelerating creep rates 1 < m < ∞ where decelerating creep rates are observed in Stage II creep for polycrystalline ice having a random fabric and single-crystal ice oriented for hard glide, and accelerating creep rates are observed in Stage IV creep for polycrystalline ice during recrystallization to an oriented fabric and single-crystal ice oriented for easy glide. For perfectly viscous flow n = 1 and for perfectly plastic flow n = ∞, where η = σo|
Thermal convection in polar ice sheets involves the creep of polycrystalline ice. Convection flow driven by the buoyancy stress probably initiates as plumes rising vertically from the base of the ice sheet, where either a random crystal fabric will prevail owing to continuous recrystallization or an oriented fabric will prevail owing to basal shear. In either case, convection flow normal to the bed will initially be controlled by hard glide (except along the sides of ice streams where shear should generate an ice fabric favoring easy glide normal to the bed). Reference GlenGlen (1955) was the first to make a comprehensive study of creep in polycrystalline ice having a random fabric. His results and subsequent work, as reviewed by Reference BuddBudd (1969), Reference Weertman, Whalley, Whalley and GoldWeertman (1973), and Reference GowGlen (in press), show that m =⅓, n = 3, and Q’ = 3Q” are appropriate for the creep rates common to glacial flow. Using these values and the results of Reference RigsbyRigsby (1958), Equation (6) reduces to:
Where T M is the melting temperature at hydrostatic pressure P,
and K is constant given by the expression (Reference WeertmanWeertman, 1970,1973)

Stage II strain is viscous because the transient creep term B tdominates when t ≈ 0, and Stage III strain is visco-plastic because the steady-state term B s dominates when t ≫ 0.
Equations (6) and (7) follow from Equation (3), which predicts a steady-state contribution to creep at all strains, as illustrated in Figure 2 for polycrystalline ice with m = ⅓ and n = 3. Dislocation theory predicts the

Fig. 2. a. Components of creep in randomly oriented polycrystalline ice. Shown using an arbitrary scale are the elastic strain ϵe transient strain ϵt, and steady-state strain ϵs components summed to give the total strain at a given time t prior to recrystallization.
Equations (6) and (7) are not the only expressions capable of representing the creep curves in Figure 1. Reference Weertman, Whalley, Whalley and GoldWeertman (1973) suggests alternative equations which do not require a steady-state creep component at small strains. However, a significant fraction of ice crystals near the bed of a polar ice sheet will have high dislocation densities due to advection strain, so that a steady-state component will exist in these grains when convection strain begins. Therefore, Equations (6) and (7) should satisfactorily represent all strains related to convection in polar ice sheets. Figure 2 is drawn using m = ⅓ and n = 3 in Equation (3), where
Transient creep and the initiation of convection flow
Thermal convection in polar ice sheets should begin as linear viscous flow, according to Equation (7). Hence, the classical theory for the initiation of thermal convection in a horizontal fluid layer heated from below can be applied (Reference StruttStrutt, 1916). This theory assumes that heat transfer via conduction dominates so that convective heat transfer can be treated as a small perturbation of conduction heat transfer. While adequate for transient creep during the initiation of convection, this assumption breaks down when convective flow stabilizes because heat transport via convection dominates and because non-linear visco-plastic flow probably dominates during steady-state creep. Reference WeertmanWeertman (1967) overcame these difficulties by developing a block model for thermal convection in a crystalline solid heated from below. He developed his model specifically for the Earth’s mantle but it can be applied to polar ice sheets with relatively minor alterations, as shown in Figure 3.

Fig. 3. A block model of connection in a crystalline solid. Shown are the variation of horizontal velocity u in the vertical direction z (left) and convection flow lines (right) for a connecting layer having a semi-rigid upper boundary and a rigid lower boundary (top), a semi-free upper boundary and a free lower boundary (middle), and the block model approximating semi-free upper and lower boundaries (bottom). The distance of the density inversion (dashed line) below the upper surface determines the extent to which the density inversion is a free, surface. The degree of uncoupling between the lower surface and its bed determines the extent to which this interface is a free surface. Convection flow creates regions where tension, compression, and shear dominate. These regions are designated by letters, T, C, and S, respectively, and blocks I through 6 identify the regions. Active convection flow occurs below the density inversion (sinusoidal variation of u with z), and passive convection flow occurs above the density inversion (exponential variation of u with z). This figure is modified from Reference WeertmanWeertman (1967 figs 1, 2 a and 3).
Active thermal convective flow in polar ice sheets occurs below the density inversion since the buoyancy stress exists only in this region. Passive thermal convection flow occurs above the density inversion in polar ice sheets since this region is carried by active convective flow below the density inversion. Hence, Figure 3 shows a sinusoidal variation of the horizontal component u of convection velocity with vertical distance z through the ice sheet below the density inversion and an exponential decrease of u above the density inversion. The sinusoidal variation is weighted in favor of the increasing buoyancy stress and temperature toward the bed of the ice sheet, where u is zero at a frozen ice interface and u is maximized at a thick ice-water interface. These extremes and their influence on the pattern of convection flow are illustrated in Figure 3a and b, respectively. Cellular convection generates compression at the base of ascending flow and the top of descending flow, tension at the top of ascending flow and the bottom of descending flow, and shear between ascending and descending flow. These regions arc denoted by the letters C, T, and S. respectively, in Figure 3. Note that these stresses do not distort the convecting layer in Figure 3a where the base of the ice sheet is a rigid boundary, but do distort the convecting layer in Figure 3b where the base of the ice sheet is a free boundary. Figure 3c shows conditions when the ice—rock interface is partly uncoupled by an intervening water layer, and is therefore intermediate between Figure 3a and b. In this case, basal sliding makes longitudinal advective flow important near the bed and shear advective flow important further up (Reference LliboutryLliboutry, 1966). Longitudinal flow and shear flow develop multiple-maximum and single-maximum ice fabrics, respectively. Hence, u is controlled by the warmer temperature toward the bed and by the preferred fabric toward the density inversion. Figure 3c shows these effects on u as balanced for simplicity. Figure 3c also approximates the smoothly distorted convection layer of Figure 3b with a series of blocks displaced with respect to each other.
Let T i be the temperature at the density inversion and be the temperature at the bed. If ρ is the mean density of the convection layer, ρ-δ ρ is the density of blocks 1 and 2 where warm ascending flow dominates, ρ+δ ρ is the density of blocks 3 and 4 where cold descending flow dominates, and ρ is the density of blocks 5 and 6 where horizontal shear flow dominates. This density difference is caused by a mean temperature difference δT between ascending and descending flow, so that:
where αv is the volume coefficient of thermal expansion. Equation (9) follows from the definition of αv:

where M is mass, Vis unit volume, Lis unit length, αL is the linear coefficient of thermal expansion.
Figure 4 shows the stresses acting on blocks 1 through 6. These arc the tensile, compressive, and shear deviator stresse σT, σC, and σS, respectively; and the hydrostatic pressure P. Under equilibrium conditions, the size and shape of all blocks are constant with time. This requirement means that the forces exerted across sections y’-y’ and y”-y” above the line z are equal and opposite. The thermal stress caused by the density inversion can be estimated by considering the horizontal forces acting on blocks 1, 4, and 5. As shown in Figure 4,
where
Here h is the total ice thickness, d is the ice thickness below the density inversion, and Δd is the displacement of blocks 1 and 2 above blocks 3 and 4 due to thermal buoyancy, where

Fig. 4. Horizontal stress variations in the vertical direction for the block model of convection in Figure 3. Deflator components are the tensile stress oT the compressive stress or. and the shear stress as- Spherical components are the hydrostatic pressures P1 through P6, including p1’ and P5’ Other symbols defined are in the text.
Several simplifying assumptions are needed to extract the thermal buoyancy stress from Equation (11). Of course and σT and σCare equal, and they must approximately equal σSsince these deviator stresses are smoothly varying functions of position. However, if ice above the density inversion is passively transported by active convective flow below the density inversion, the stress σSshould be small and will be neglected. This approximation is best when the density inversion is closest to the surface, because the firn air interface is a free boundary. The ratio λ|d, where λ is the distance between centers of ascending (or descending) flow in a horizontal fluid layer heated from below, depends on whether convective circulation is in the form of polygonal platform cells or elongated rolls, and on whether the top and bottom surfaces are free or rigid (Reference KnopoffKnopoff, 1964). In Figure 3c the density inversion and basal interfaces are intermediate between free and rigid, where 2 < λ/d < 2√2 is the range over these extremes. The approximate treatment given here will assume that
Using Equations (9) (13), and (14), the thermal buoyancy stress from Equation (11) is
where terms involving are ignored.(Δp)2 (Δd)2
Equation (15) is identical to the equation Reference WeertmanWeertman (1967) derived for his four-block convection model which had free top and bottom surfaces with no overlying layer of passive convection flow. This encourages an application of the Weertman block convection model to polar ice sheets partly uncoupled from bedrock by a basal water layer.
Continuing with the Weertman block-convection model, thermal convection begins when the thermal buoyancy stress σT overcomes the visco-plastic resistance of the ice sheet. Equation (15) shows that σT varies with the mean temperature difference δT between ascending and descending convection currents. The equation of heat flow must be solved to obtain δT. This equation is:
where K IS the thermal dittusivity, w is the vertical velocity of convection now, z is veirtical distance measured from the base of the ice sheet, and
where w 1, w 2, w 3, w 4, w 5, and w 6 are vertical velocities in blocks 1 through 6, respectively, and is the vertical strain-rate, which is always positive in Equations (17).
Setting T = Ti + ∆T at ɀ = 0 and T = Ti at ɀ = d as boundary conditions and using Equations (17) to specify the variation of w, steady-state solutions of Equation (16) for blocks 1 and 2 are:


where replacing
Most heat is transported via conduction when
where T* is a temperature perturbation caused by the onset of convection. Letting


The mean temperature difference between acending and descending currents is
Where
Convenction flow
Equations (7) and (8) indicate that σ0 → σ0' when σ or t are small, σ0 → σ0”; when σ or t are large,
Letting σ = σT convection begins when σT* = σo Therefore the ratio

is unity at the onset of convection. Here the dimensionless Rayleigh number is
and the critical Rayleigh number for the onset of convection is
According to classical convection theory, 657 ≤ (Ra)* ≤ 1 708 for convection in a horizontal fluid layer heated from below, where the lower value is for free boundary conditions and the higher value is for rigid boundary conditions (Reference KnopoffKnopoff, 1964). The value of (Ra)* in Equation (27) is a direct consequence of taking a free boundary λ/d ratio in Equation (14c). Even so, the square-wave solution from the Weertman (1967) block model gives (Ra)* values about half those given by the sinusoidal wave solution from the Rayleigh classical model (Reference StruttStrutt, 1916). Higher (Ra)* values are expected if convection flow is not permitted to deform free boundaries, and this was a restriction imposed on the sinusoidal wave model shown in Figure 4a which was removed for the square-wave model shown in Figure 4b and c. Hence, Equation (27) probably underestimates (Ra)* but not as much as might be expected (Reference WeertmanWeertman, 1967).
Thermal convection is possible when (Ra) ≥ (Ra)* and comparing Equations (7) and (8) with Equations (25) through (27) shows that (Ra) ∝t -2/3 for t ≈ 0 and (Ra) ∝ σ2 t ≫ o.for This illustrates an important distinction between convection in crystalline solids and convection in fluids. The viscous flow creep component in crystalline solids is time dependent, whereas viscous flow in fluids is time independent. Furthermore, the time dependence is such that when convection begins at t = o, the strain-rate
Steady-state creep and stable convection flow
Thermal convection in polar ice sheets is important only if thermal conduction alone cannot satisfy the equation of heat How, as expressed by Equation (16). In the absence of convection, w = o and Equation (16) becomes

where k is the thermal conductivity, cp is the specific heat capacity at constant pressure, and setting w = o neglects accumulation and ablation of ice. In the absence of conduction, K = o and Equation (16) becomes:
where w is the mean vertical velocity in incremental distance Δz. Hence, K is obtained from the ratio of the temporal variation of temperature to the gradient of the spatial variation of temperature across distance Δz when conduction overwhelms convection, and
Steady-state convective flow can therefore be discussed in terms of a characteristic distance z*, where
When convection overwhelms conduction, z* is the thickness of the thermal boundary layer of sharp temperature gradients which develops at the top of blocks 1 and 5, at the bottom of blocks 3 and 6, and between blocks 4 and 5, blocks 5 and 6, and blocks 6 and 2, as shown in Figure 5. Heat transport across this boundary layer is via conduction because
Heat transport via convection dominates heat transport via conduction above a critical creep rate
Solutions of Equations (18) in terms of
in the range

In the range

Fig. 5. Thermal regimes predicted by the block model of convection. Shown are the regime during Stage III steady-state strain (top), Stage V steady-state strain (bottom), and the zone of sharp temperature gradients (diagonal hatching). Here, T i and T1 + ∆T are ice temperatures at the density inversion and at the bed, respectively, before convection began.
in the range and

in the range
Comparing Equations (21) and (33) shows that δT varies with
Convection in a polar ice sheet underlain by a substantial basal water layer occurs at a rate which keeps ΔT nearly constant below the density inversion because T = T Mat the bed and T = T i at the density inversion, where T i is close to ambient mean annual air temperature. Therefore the position of the density inversion is such that heat supplied at the bed equals heat transported across d. The minimum amount of heat supplied from the bed is the geothermal heat flux H G, and the maximum value of d is the total ice thickness h (disregarding the firn layer). Consequently the thickness of the actively convecting layer is controlled by heat transport across this layer.
In Stage III steady-state strain,
In Stage V steady-state strain,
However,
Heat transported upward by convection and downward by conduction must equal the total heat generated at the bed. This heat is H(λ/2) in Figure 5, where λ/2 is the total length of the bed under blocks, 2, 3, and 6. Therefore, the heat blance equation is
Substituting from Equations (35) and (36) gives the heat transport when
When
For constant heat transport, ΔT is obtained from Equation (34) and Equation (39) becomes
When
For constant heat transport, ΔT is obtained from Equation (38) and Equation (41) becomes
Note that both σTand σH are proportional to
Figure 6 is a plot of stress versus strain-rate comparing Equations (39) through (42) with Equation (7), including both transient and steady-state creep components. Transient creep is controlled by a viscous flow stress ση:
Steady-state creep is controlled by a visco-plastic flow stress σn

Fig. 6. Heat and mass transport characteristics predicted by applying the visco-plastic flow law of ice to the block model of convection. Shown are stress a and strain rate £ variations with temperature T that relate viscous creep (on curve) and visco-plastic creep (on" curve) to a constant temperature difference (σT curves) and a constant heat tranpsort rate (σH curve) through the connecting layer. Details are discussed in the text, where σ = σz This figure is modified from Reference WeertmanWeertman (1967,fig 5).
Stage I strain is instantaneous clastic deformation (t = o, ϵz ≈ o, and
Stage II strain is marginally stable when
Equation (38) was derived on the assumption that blocks 1 through 6 in Figure 3 were comparable in size and shape. This is true when
Convective heat transport across (d-z*) ≈ d is obtained from Equation (38) modified by changing widths L 1 L 5, respectively, of blocks 1 and 5:
Equations (45) and (46) can be combined to show how the ratio (L 1\L 5 varies with
The thermal buoyancy strees at
which is Equation (15) multiplied by the ratio (L 1/L 5Eliminating L 1/L 5and ΔT from Equation (48) by substituting from Equation (46) and Equation (45), respectively, gives Equation (42).
Temporary creep and turbulent convection flow
It is interesting that the relationship H ∝ (ΔT)4/3 observed in turbulent fluid convection can be obtained by combining Equations (46) and (48) to eliminate L 1/L 5, combining the resulting equation with Equations (43) and (44) by setting σT = ση + σ n and combining this resulting equation with Equations (8) and (45) to relate H with ΔT via

As shown by Equations (8), the terms B t and B s contain the visco-plastic yield stress σ0. Constant strain-rate creep tests produce flow curves in σ0 which varies with according to the relationship (Reference Weertman, Whalley, Whalley and GoldWeertman, 1973):
where C and c are constants. For randomly oriented polycrystalline ice, σ0 = σ0’and c = 3. For ice single crystals oriented for easy glide, σ0 = σ0” and c Hence, 15 ≤ c ≤ 3 is the range of polycrystalline ice with fabrics ranging from single-maximum aligned for easy glide to random. When the term having B s in Equation (49) is disregarded, then B t is obtained from Equation (8a), where


Note that H ∝ (ΔT)4/3 in both cases. However, since fluids and randomly oriented poly-crystalline ice are both isotropic, a comparison of turbulent convection in fluids and polar ice sheets is better for Equation (51) because Equation (52) applies to stage V steady-state strain after recrystallization.
The time dependence of Equation (51) is a unique feature of turbulent convection in polar ice sheets. Its significance may lie in the fact that creep in ice is initially not purely viscous, as in fluids, but is temporarily viscous according to Equations (7) and (8). Turbulent convection in polar ice sheets can be expected if the buoyancy stresses caused by the density inversion are insufficient to overcome the visco-plastic resistance of the ice even though thermal conduction cannot transport enough heat upward to eliminate the superadiabatic temperature gradient that develops when (Ra) > (Ra)*. Hence, as (Ra) for the ice sheet increases above the (Ra) * values appropriate for convection in fluids, oT builds until it. is relieved catastrophically at time
after (Ra) = (Ra)* for fluid convection. Equation (53) is obtained by setting B tσ= B sσ3and in Equation (7) and solving for t using Equations (8). It represents the time since the superadiabatic temperature gradient developed at t = o until the time when convection begins as catastrophic recrystallization during stage IV strain. Hence, turbulent convection in polar ice sheets is expected where (Ra) for the ice sheet greatly exceeds (Ra)* for fluids. This condition exists wherever ice is over 4 km thick in the Antarctic ice sheet.
Turbulent convection via catastrophic recrystallization in a polar ice sheet is a temporary event because the thermal buoyancy stress is suddenly relieved, The turbulent convection episode may consist of a local collapse of the relatively rigid cold ice ceiling above the relatively soft hot ice basement, causing a downward flood of cold heavy ice which pushes the hot light ice aside. Or, perhaps more likely, the turbulent convection episode may consist of a local upthrusting of the relatively soft hot ice. basement, caused by a uniform slow en masse sinking of the relatively rigid cold ice ceiling. The first process would create a local down-warping of the cold ice strata, and the second process might inject hot ice sills into the cold ice strata. Ice has a high Prandtl number (Pr) = η\ ρk and turbulent convection in fluids having high Prandtl numbers consists of unstable convection cells which constantly change in size and shape while appearing and disappearing (Reference Somerscales and DropkinSomerscales and Dropkin, 1966; Reference Somerscales and GazdaSomerscales and Gazda, 1969). By analogy, turbulent convection in polar ice sheets should be a temporary creep phenomenon.
Discussion
Dike-sill convection near the centers of polar ice sheets
The turbulent solid-state convection regime of Stage V steady-state creep suggested by Equation (52) consists of narrow zones of hot rising ice and cold sinking ice separated by wide zones of stagnant ice, as described by Reference Schubert, Schubert, Turcotte and OxburghSchubert and others (1969) for fluids with a strongly temperature-dependent Newtonian viscosity. The narrow sinking zone may not exist in a convecting polar ice sheet, however, owing to the anisotropic effective viscosity of ice. In this case Equation (47) becomes:
where Δλ replaces L 1 and λ = 2 (L1 + L4 + L5 +) ~ 2L 5 + in Figure 5. This is dike- sill convection of the type commonly observed when magma intrudes horizontal beds of sedimentary rocks in the Earth’s crust. By analogy, the strata of cold ice sinks en masse into the hot temperate ice layer at the bed, forcing the basal ice upward as dikes which inject sills between the most weakly coupled layers of the slowly sinking cold strata. In order to conserve mass flux, the ratio of dike width to distance between dikes is inversely proportional to the ratio of ice velocities rising in dikes and sinking between dikes.
Figure 7 illustrates the possible development of dike—sill convection according to plasticity theory, for which n = ∞ in Equation (5). The main difference for ice, which is visco-plastic so that n < ∞, would be a rounding of sharp corners and a widening of the shear zones bordering dikes and sills in Figure 7. One practical consequence of this is to reduce the possibility that convection dikes could be detected by radio-echo sounding, since the junctions between dikes and sills would be less able to behave like corner reflectors for radar waves (personal communication from S. Evans in 1974) Figure 7, convection begins as an up- warp of the boundary between temperate basal ice and cold overlying ice (an upward bulge of the T M isotherm). The initial up-warps could be nucleated where variations exist in the basal temperature gradient, the strength of ice-rock coupling at the bed, and the stress regime around bedrock topography, all of which arc interrelated and can locally decrease the effective viscosity of cold ice. These up-warps collapse laterally and arc thrust upward during the five stages of strain to become dikes which inject sills into the sinking strata of cold ice. Convection dikes are unstable and form randomly during Stage III steady-state strain but may become stable to form an orderly array if Stage V steady-state strain is attained. The stable array is active only so long as the basal temperate ice layer exists. The array stagnates if convection flow redistributes the temperate basal ice in dikes and sills faster than it is formed by geothermal and frictional heat generated at the bed. Convective flow stops when an array stagnates, so advective flow will recrystallize the vertical easy glide ice fabric developed in dikes but will preserve the horizontal easy glide ice fabric developed in sills.

Fig. 7. The initiation and growth of dike-sill convection in a polar ice sheet according to plasticity theory. Arrows show ice flow directions and orthogonal cycloid segments show the ice slip-line field in dikes and sills. In the top view, the slip,-line field is shown for a basal temperate ice layer having an effective viscosity an order of magnitude lower than the overlying cold ice [see Fig. 9) so that the cold ice and the bed (shaded zone) behave as rigid plates cornpressing the temperate ice (Reference HillHill 1950, fig. 64). The compressive pressure is relieved where irregularities in basal conditions allow doming of the basal temperate ice layer so that basal ice flows toward these domes, generating the slip-line field shown. In the middle view lateral spreading of the cold ice overlying the domes causes the domes to contract laterally and expand vertically into the cold ice becoming ascending dikes of recrystallized ice in the process. The slip-line field in the dikes is that for a plastic material injected between rigid parallel plates and forcing them apart. In the bottom view, ascending dikes have injected sills between weakly coupled layers (dashed horizontal lines) in the strata of slowly sinking cold ice between dikes, and frictional heat in the basal ice feeding the dikes has created a basal water layer (black horizontal band) which has uncoupled the ice sheet from the bed. Consequently, sills have the slip-line field of plastic material forced between rigid parallel plates and the basal temperate ice layer has the same slip line field as when one of the plates (the water layer) is a frictionless surface.
Advective flow is a general feature that is characteristic of the entire ice sheet, whereas convective flow would be a local feature confined to narrow dikes and sills in the lower part of the ice sheet. In general, therefore, the convective flow regime should conform to the advective flow regime rather than vice versa. Figure 8 shows the slip-line field which plasticity theory predicts for advective flow from a central ice dome. Ice flow lines can be drawn as lines radiating from the ice dome and therefore are 45° diagonals to the slip-line field. In the absence of advection, the most efficient convection occurs when convection dikes intersect at 1200 angles to form a hexagonal array, since this minimizes the length of dikes penetrating cold sinking ice. In Stage V convection, therefore, hexagonal prisms of cold ice λ in diameter and separated by dikes of width Δλ should sink slowly into a temperate basal ice layer under the domes of polar ice sheets where advection is small. However, advective flow increases with increasing distance from the domes, and the dike array must intersect at 90° angles if it is to enclose prisms of cold sinking ice which correspond to the slip-line field of orthogonal logarithmic spirals for advective flow radiating from the dome, as shown in Figure 8. Furthermore, as distance from the dome increases, the prism diameter paralleling advective flow increases with respect to the prism diameter normal to advective flow. Consequently, hexagonal convection “cells” under the dome where advection is least are transformed into elongated convection “rolls” aligned with advective flow toward the margin of the ice sheet. This transformation has been observed and studied in detail for convection-advection interactions in fluid flow (Low, 1925; Reference JeffreysJeffreys, 1928; Reference Deardroff Deardorff, 1965; Reference Gallagher and MercerGallagher and Mercer, 1965; Reference Davies-JonesDavies-Jones, 1971). However, the dike-sill nature of crystalline convection proposed for ice sheets does not exist in fluid convection.
The vertical ice velocity entering dikes can be estimated from the tensor form of the flow law of ice (Reference NyeNye, 1957):
where i and j are orthogonal coordinates, u i and u j are velocity components in respective directions x i and x j,
Since a convection dike is aligned in the direction x of advective flow, set i = y, j = z, xi = y, and x j = z so that the effective strees
since σij = σij’. Advection is nil under central ice domes of polar ice sheets so the only deviator stress components used in Equation (57) are where σz' = σy' ≃ σyz', where σy' = σT = σc and in Equation (14a) and Figure 4. For Stage V steady-state strain, n = 3 and d → h in the temperate ice layer at the base of the dike. In the dike itself, the effects of developing an easy-glide fabric tend to offset the effects of decreasing temperature so that A -n should not change greatly for ice moving up the dike. Solving Equation (55) for i =j = z and using Equation (57) to evaluate t gives

Fig. 8. An idealization of the interaction between convective flow and advective flow in a polar ice sheet drained by ice streams and fringed by ice shelves. This figure assumes that convection dikes form a stable polygonal array that becomes elongated in the direction of advective flow and converges on ice streams so that the entire ice stream behaves like a single dike (alternatively, the convection dikes may form randomly. be transient, and be largely independent of advective flow). Convection begins under domes (D) and saddles (S) along the ice divide where the ice sheet is thickest and advection is minimal so that dikes (thick lines) can form a hexagonal array. As ice spreads from the domes, interaction with the plastic slip-line field of radially spreading advective flow (dotted orthogonal logarithmic spirals) causes the six-sided convection polygons to become five-sided, then four-sided. and finally elongated rolls with dikes paralleling advection flow lines (thin broken lines). These flow lines converge to form ice streams, for which the plastic slip-line field is typical of extrusion flow (Reference HillHill, 1950, fig. 44) at the upper end where flow lines converge on the ice stream, compressive flow (Reference HillHill, 1950, fig. 64) in the middle where flow lines are parallel in the ice stream, and indenting flow (Reference HillHill, 1950, fig. 70) at the lower end where flow lines diverge onto the ice shelf Indenting flow (cross-section A) also characterizes ice-stream convection before ice thinning enables the shear zones alongside ice streams to penetrate the surface (cross-section B).
where σz’ is obtained from Equations (2) and (g). Snow accumulation and ice advection are generally least under central ice domes of polar ice sheets. Hence, the density inversion should occur not far below the firn layer so

If dike-sill convection in the Earth’s mantle controls sea-floor spreading and continental drift, as has been suggested (Reference HughesHughes, 1973[a] Reference Hughes[d]), then λ ≃ 2d = 6000 km for mantle-wide convection. Setting Δλ/λ = 0.032 predicts that Δλ = 200 km is the dike width in the mantle. These values of λ and Δλ are the same order as the average distance between mid-ocean ridges and the average ridge width. Hence, the spacing and width of dikes predicted for polar ice sheets arc in approximately the same ratio as those observed for crustal features that might result from convection dikes in the Earth’s mantle. This is encouraging, because the Earth’s mantle is the only other part of our planet where convection in crystalline solids is postulated.
Vertical convection velocity w e is a maximum at the base of a dike and decreases in steps to zero at the top of the dike, with one step for each sill intersected and fed by the dike. Solving Equation (58) for the above values of
Ice-stream convection near the margins of polar ice sheets
Ice streams form near the margins of polar ice sheets when advective flow concentrates in channels of the subglacial topography. The increased shear deformation in these regions of concentrated flow generates frictional heat which melts the basal ice, permitting basal sliding, which erodes the channels and thereby further increases the ice discharged through them. Once formed, therefore, ice streams are self-perpetuating. Shear zones border the sides of ice streams, and create characteristic crevasse patterns when ice-sheet thinning near the margin is sufficient to allow the shear zones to penetrate to the surface. The ice fabric generated in the shear zones favors vertical easy glide, and if shear deformation at the base and along the sides of the ice stream generates sufficient Frictional heat to make ice streams warmer than ice between ice streams, a buoyancy force arises which may lift the ice stream slab en masse from its bed. This would be ice-stream convection.
Figure 8 illustrates the possible development of ice-stream convection before and after the flanking ice-stream shear zones penetrate the surface of the ice sheet, according to plasticity theory. Before penetration, the warm ice stream presses against the cold overlying ice as if it were a rigid prism indenting a plastic plate. If d and A are the respective heights and widths of the ice stream, where d < h and the ice stream temperature is uniformly δT hotter than the surrounding ice, the buoyancy force it experiences arises from a thermal stress σT = ρgdαvδT Applying the Reference OrowanOrowan (1965) analysis to ice streams, resisting this force are the plastic properties of the surrounding colder ice. This includes a uniaxial stress

Solving for δT:
When the ice stream penetrates the surface of the ice sheet, σz vanishes, d = h and Equation (60) becomes
Note that δT is independent of d in this case.
Antarctic ice streams are generally visible as heavily crevassed slabs on the ice sheet surface when h ≤ 1 km, and they are typically A ≈ 25 km in width. The plastic yield stress of ice is commonly taken as σ0= 1 bar. Using these values and the values of p, g, and αv previously cited gives =δT = 178 deg in Equation (60) and δT = 8.7 deg in Equation (61). Hence ice-stream convection is unlikely when d < .h, but may occur when d = .h, provided that ice streams average several degrees warmer than surrounding ice. However, since σo ≪ 1 bar for visco-plastic flow, ice-stream convection is still possible when d < h if Ʌ → d Major ice streams often form by the confluence of smaller ice streams for whichɅ → d, and small ice streams may originate from converging convection dikes. The displacement of a convecting ice stream from the bed is
For = 1 km,
Figure 8 shows the slip-line field and the resulting flow lines which plasticity theory predicts for an ice stream draining an ice sheet onto an ice shelf. In ice-stream convection, the ice stream is buoyed up en masse as a hot slab as shown in Figure 8, This slab acts like a rigid prism which plastically indents the overlying cold ice before the ice stream breaks through the surface of the ice sheet.
Rayleigh numbers for initiating convection
Convection begins under the central domes of polar ice sheets where ice thickness and the temperature difference between surface and bed are greatest and where snow accumulation and ice advection are least, since (Ra) ∝ d 3 ΔT in Equation (26) and d → h under these conditions. The temperature profile under polar ice domes is given by the equation (Reference Robin.de, Robin.de, Swithinbank and SmithRobin, 1955):
where z is measured from the base,
where T b is the basal ice temperature. The effective viscosity of ice no in Equation (26) is obtained from Equation (55) and can be written in terms of the basal effective viscosity of ice ηb using z/h and N in Equation (64) as follows (Reference HughesHughes, 1972[c]:

where K = 25.3 in Equation (7) and Figure 9, and (k/N) is a viscous scale height.
Reference Schubert, Schubert, Turcotte and OxburghSchubert and others (1969) show how the viscous critical Rayleigh number (Ra)η* varies with the ratio (K/N for both rigid and free boundary conditions in fluid convection. For polar ice sheets, rigid boundaries exist when

Fig. 9.
A polynomial-exponential flow law fitted to creep data for polycrystalline ice in which hard glide dominates. Plotted is the variation of octahedral shear stress τ with octahedral shear strain-rates y at various temperaturesΘ. A best-fit of the flow law at various homologous temperatures T/TM (thin lines) is given to creep data from laboratory experiments and glacier studies (dashed lines). Note that ![]() τ when τ < 0.5 bars,
τ when τ < 0.5 bars, ![]() τ3 when τ > 5.0 bars, and
τ3 when τ > 5.0 bars, and ![]() increases tenfold as T/TM → 1. This figure is modified from Rudd (1969, fig. 2.2).
increases tenfold as T/TM → 1. This figure is modified from Rudd (1969, fig. 2.2).

Fig. 10. The variation of the critical Rayleigh number for initiating convection with the viscous scale height in the convecting layer. Rayleigh numbers (Ra) (no) can be calculated for the effective viscosity no averaged through a convecting layer of thickness d, or Rayleigh numbers (Ra) (nb)can be calculated for the effective viscosity n\b, at the base of the convecting layer of thickness d(N)K). Solid lines are for a coupled bed and dashed lines are for an uncoupled bed. This figure illustrates the Reference Schubert, Schubert, Turcotte and OxburghSchubert and others (1969) treatment modified for polar ice sheets (Reference HughesHughes 1972[c]).
The minimum ice thickness needed to initiate convection is obtained by solving Equation (26) for h after setting
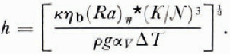
Equation (66) will be applied to the region of the Wilkes Land ice dome in East Antarctica, where
The resulting temperature profiles are compatible with N = 3 in Equation (64) for the lower portion of the ice sheet where convection would be active. Taking K = 25.3 from Figure 9 gives (N/K) = 8.4, for which (Ra)η* = 25 for a thawed bed and Ra)η*= 32 for a frozen bed according to the curves showing (Ra) as a function of ηb in Figure 10, From Equation (65):
Where τ = √2σz' from Equation (57) for
Rayleigh numbers for maintaining convection
Convection begins as transient creep which creates a broad upward bulge in the T M isotherm at the top of the temperate ice layer covering a thawed bed or in the T b isotherm at the bottom of the cold ice layer covering a frozen bed. This is accompanied by a downward bulge of isotherms in the flanking ice, and the net result is a tiny fraction of one convection overturn so that the convective perturbation of conductive heat flow takes place, as shown in Figure 6 for
The Rayleigh number for maintaining dike-sill convection is obtained from a consideration of Stage V steady-state strain. Let (Ra),η* be the viscous critical Rayleigh number which must be exceeded to initiate convection as Stage II transient strain, and Ra), n * be the visco-plastic critical Rayleigh number which must be exceeded to maintain convection as Stage V steady-state strain. The thermal buoyancy stress driving convection can be expressed in terms of Ra),η* and (Ra) n * by setting
Substituting for ηo, using Equation (24) and substituting for

Note that
The minimum ice thickness for maintaining convection is obtained by solving Equation (66) when ηb is given by:
Here

Fig. 11.
The variation of the ratio of the final critical Rayleigh number to the initial one with the thermal buoyancy stress driving convection. Note that ![]() bars. Compare with Figure 9
.
bars. Compare with Figure 9
.
Conclusions
Thermal convection in polar ice sheets is predicted. Possible convecting regions in the Antarctic ice sheet are shown in Figure 12. Convection will be active below the density inversion and passive above it. Dike-sill convection predominates under the central ice domes and ice-stream convection predominates along margins which terminate as ice shelves. If dike-sill convection stabilizes, a polygonal network of dikes may form under ice domes and advective flow will transport this network to the heads of ice streams where dike—sill convection transforms to ice-stream convection. Separate Rayleigh criteria arc necessary to specify conditions which initiate convection and conditions which maintain convection, and these criteria determine whether dike-sill convection consists of unstable random events or forms a stable polygonal network.
Dike-sill convection results if the cold ice ceiling slowly sinks en masse into the hot ice basement, forcing narrow dikes of basement ice to rise. Sills of basement ice are then injected laterally into the cold ice strata from the rising dikes. Alternatively the cold ice ceiling might collapse into the hot ice basement, pushing aside the hot ice underneath. This would cause a local down-warping of the cold ice strata, whereas dike-sill convection allows the cold ice to remain relatively undeformed by concentrating deformation in the hot ice. Since hot ice deforms more easily than cold ice, upward dike-sill convection is more probable than downward convection via local down-warping of cold ice.
Thermal convection in polar ice sheets provides new interpretations of several glaciological observations. For example, convection sills would create the horizontal “shear bands” which intersect the “Byrd” station core hole in Antarctica (Reference GowGow, 1970), and the “cold spikes” in the oxygen isotope profile down the Gamp Century core hole in Greenland (Reference Dansgaard, Dansgaard, Johnsen, Clausen and LangwayDansgaard and others, 1972). The details of these explanations will be published elsewhere (Reference HughesHughes, in press). Perhaps the most dramatic effect predicted by thermal convection in polar ice sheets is glacial instability leading to ice-stream surges and catastrophic ice-sheet disintegration. Dike—sill convection provides a means for generating considerable basal melt water under the interior of an ice sheet from the frictional heat of shear deformation in basal ice moving toward dikes. This permits the lower part of the ice sheet to be much softer and less coupled to (he bed than was previously believed possible. The basal melt water generated by dike-sill convection will flow down the pressure gradient toward the ice-sheet margin where it converges at the heads of ice streams. Ice-stream convection buoys up ice streams, thereby uncoupling them from the bed and allowing them to surge. If the force of the surge is sufficiently strong, the ice stream can punch through the ice shelves which typically fringe polar ice sheets and discharge directly into the sea. When this happens, longitudinal flow transforms from compressive to extensive and the dominant crevasse pattern transforms from a predominantly longitudinal alignment to a predominantly transverse alignment (Reference NyeNye, 1952). Transverse crevasses favor iceberg formation, and a calving bay develops at the ice stream terminus which migrates up the ice streams and guts out the heart of the ice sheet just as the ice stream in Hudson Strait gutted out the heart of the Laurentide ice sheet centered over Hudson Bay in less than 300 years (Reference HughesHughes, 1974,1975). A calving bay may be forming in the Amundson Sea where Pine Island Glacier and Thwaites Glacier have punched through the ice-shelf fringe around west Antarctica. Thermal convection should have uncoupled this part of the ice sheet from the bed, as shown in Figure 12. It can be assumed that the Hollock Kenyon Plateau ice drainage basin, which feeds these ice streams, will be the next sector of the west Antarctic ice sheet to disintegrate. If so, thermal convection may have played a major role.

Fig. 12. Thermal converting regions predicted for the Antarctic ice sheet. Shown are the continental-shelf margin (outer dashed line), ice-shelf margins (hatched lines), the ice-sheet margin (solid lines), ice-sheet 500 m elevation contour intervals (inner dashed lines), major ice domes (lettered D), major bedrock outcrops (black patches), and possible converting regions (dotted areas). Dike-sill convection occurs in the interior and ice-stream convection occurs along the margin. Due to frictional heat generated in the hot basal ice squeezed up dikes by cold sinking ice, the converting regions are also regions of probable basal melting and partial uncoupling between the ice sheet and the bed. Hence, glacial instability is possible where these regions penetrate to the coast as converting ice streams. This occurs frequently in West Antarctica, which may be disintegrating as a result (Reference HughesHughes, 1973[d]) .
Acknowledgements
Most of this work was done during an appointment to the Advanced Study Program of the National Center For Atmospheric Research, I thank Peter Gilman, Chairman of the Advanced Study Program, for inviting me to N.C.A.R., and the secretarial and drafting staff at N.C.A.R. for typing the manuscript and drafting the figures; in particular, Judith Prangley, Ursula Rosncr, Leland Fortier, and Michael Shibao. The remainder of this work was done at the University of Maine, and 1 thank Robin Astbury, Thelma Libby, and Ellen Chessa for typing these parts of the manuscript.
Discussion
J. F. Nye: The slip-line field you showed describes how the ice thickens and therefore rises at a low place, and thins and therefore falls at a high place. This happens with uniform density and so is an effect quite independent of convection, which depends on buoyancy forces arising from density variations. But after showing this slip-line field you seem to say that it exhibits convection. Could you clarify this point?
T, J. Hughes: My purpose in showing the slip-line field for perfectly plastic flow was to call attention to the slip lines which are normal to the bed at the bed. Principal shear stresses causing plastic yielding along these slip lines are equal in magnitude to those causing plastic yielding along slip lines parallel to the bed at the bed. You have related aspects of the slip-line field beginning parallel to the bed with various aspects of spreading glacial flow (longitudinal tension, longitudinal compression, basal erosion, surface faulting and slumping, etc) I wanted to relate aspects of the slip-line field beginning normal to the bed with various aspects of convection glacial flow. One aspect is ice converging toward an ice stream from flanking ice domes. Another aspect is ice moving along ice divides from domes to saddles. Another aspect is ice moving across depressions or lakes at the bed. All of these aspects involve longitudinal compression or vertical shear, both of which favour vertical ice transport if a buoyancy force exists. Convection dikes result from vertical ice transport at the bed, and therefore may begin at sites where surface and basal conditions favour preferential shear in a small sector of the slip-line field which is normal to the bed at the bed. If so, convection dikes may nucleate at such sites. Of course, any particular slip-line field vanishes as soon as convection begins. But it exists (for perfect plasticity) right up to that moment, because the assumption of constant density is adequate until convection begins. I am interested in any condition which favours the initiation of convection, and the pre-convection slip-line field is useful in this respect.
L. Lliboutry: Calculations on convection consider an infinity of cells side by side. I suppose that two single cells cannot work in a steady way, owing to the strong resistance of the motionless ice around. In other words, 1 can imagine diapirs of warm ice, but not a continuous overturn. Do you think it could exist?
Hughes: 1 expect that if continuous overturn exists, a complete cycle is unlikely during the lifetime of a convection episode because the cold ice sinking between dikes is very slow in absolute velocities and with respect to velocities of ice in dikes. I imagine that the velocity of ice in sills decreases to zero with distance from the dike, and horizontal ice velocities in sills arc therefore intermediate compared with vertical ice velocities in and between dikes. Continuous overturn is most likely in ice entering (he lateral shear zones alongside ice streams from ice ridges between ice streams. But ice-stream thinning halts convection long before a convection circuit is complete. The particle path of an ice crystal transported by dike-sill convection and ice-stream flow would resemble a portion (much less than one circuit) of a rectangular spiral aligned with the ice stream. On the other hand, dike-sill convection under central ice divides would not be continuous unless a continuous polygonal network of dikes existed.
Even in this ease, dike-sill convection at the margins of the network should be discontinuous. Certainly, single isolated dike-sill convection systems would be discontinuous for the reason you stated.
G. De Q. Robin: Dr Hughes will be welcome to study our collection of radio-echo records from the i974-75 season which arc much better for studies of layering than earlier seasons due to use of a differentiated output on the receiver. If, as you suggest, there is an appearance of stronger horizontal layering above sub-ice lakes, these may not he due to presence of sills, but merely because the internal layering is flatter, and hence the reflection closer to specular, than over areas of rougher bedrock.
HUGHES: This would he unfortunate because I had hoped that radar sounding, which is so promising in furthering our understanding of ice-sheet dynamics, might also be sensitive to dike-sill convection. However, if internal reflection horizons exist between mechanically weak layers in the glacial strata, the horizons are potential sills and may be actual sills if dike-sill convection does occur. In this regard ice moving over subglacial lakes will develop vertical shear zones along the sides of the lake, If convection dikes exist in these shear zones, the resulting sills will extend over both the ice-lake and the ice-rock interfaces. Intensified internal radar reflections above the ice-rock interface alongside subglacial lakes could not be explained by the specular reflection you mention because this interface is not smooth. So that is what I would be looking for in radar reflection horizons associated with subglacial lakes.
J. W. Glen: I wonder if the Rayleigh number for fluids is the correct one to use here. First you use the lowest (bottom) viscosity although presumably higher up the viscosity is higher though in a fluid convection this fluid is also taking part in the circulation. Surely some sort of average viscosity should be used. However, you now refer to the dike-sill type of convection and in this the bottom material has most of the rapid flow so perhaps its viscosity is the most important. However, in this case the critical Rayleigh criterion is that the temperature difference can be maintained despite thermal conductivity in the time required by the viscosity for the circulation to take place. That is why these quantities enter into the dimensionless Rayleigh number. With a very narrow dike the thermal conductivity is favoured (temperature gradient) as compared with the viscous forces, and surely the Rayleigh criterion for instability will be harder to satisfy. Has anyone studied critical Rayleigh number in the dike- sill case? Might experiments on convection cells in liquid crystals he of use? They are another case where anisotropy favouring flow is generated by the flow itself.
Hughes: You have just stated the reason why two Rayleigh numbers are needed for convection in anisotropic, visco-plastic materials; one to initiate convection and one to maintain convection. I attempted to deal with this problem by defining a time-dependent, stress- independent Rayleigh number for transient creep when convection begins; and a time- independent, stress-dependent Rayleigh number for steady-state creep when convection stabilizes. The latter number is about triple the former number, partly for the reason you suggest. The problem of the effective viscosity can he handled in either of two ways. On the one hand, an average ice viscosity can be used for the entire region of active convection below the density inversion. On the other hand, a basal ice viscosity can be used for the portion of the active convection region having the greatest vertical temperature gradient. This requires applying the basal ice viscosity to the ice thickness below the density inversion reduced by the “viscous scale height” as discussed in the text, 1 am not aware of other attempts to define a Rayleigh criterion for dike-sill convection, but it should be an interesting exercise. I also like your suggestion about studying convection in liquid crystals.
M. M. Miller: AS you have been discussing the consequences of englacial convection on the stability of the Antarctic ice sheet, may one assume that you are referring to the dominance of the convection process in the marginal zone-hence in lower elevation and presumably warmer ice? Also your discussion refers only to thermal surges. But in the marginal zones of large polar ice sheets, in some sectors at least, load stresses may dominate. How do you square this aspect with your strictly thermal explanation? In other words does this not place your concept in a rather more speculative framework than is dictated by the possible realities of the field situation?
Hughes: Of the two types of non-homogeneous glacial flow, dike-sill convection would be dominant in the thick-ice interiors of polar ice sheets and ice-stream flow would be dominant at the thin-ice margins. However, the two need not be unrelated and I envision a smooth transition between them. You arc correct to conclude that I relate dike-sill convection only to thermal surges. And I agree that other surge mechanisms are possible. Certainly dike-sill convection has nothing to do with surging mountain glaciers. This surge mechanism might well involve load stresses, as you suggest, and there is no reason to think that such a mechanism couldn’t apply to polar ice sheet margins. In response to your final question, speculation is my stock in trade. In defense of my concept, I can only return your question. Who is to say what is reality at the base of a polar ice sheet? W. F. BUDD: In your formula for the Rayleigh number, the numbers you substituted for h was high and for η low. What do you regard as appropriate values for these parameters in a situation where you think the Rayleigh number may be sufficient for convection?
Hughes: The ice viscosities and thicknesses I used in the blackboard example were chosen to calculate the most generous possible Rayleigh number as a quick way to learn whether thermal convection in ice sheets was worth more detailed consideration. 1 concluded that it was when the calculated Rayleigh number was two or three orders of magnitude greater than the critical Rayleigh number of fluid convection. With that encouragement, I proceeded to take a much more critical look at how to calculate both the Rayleigh number and its critical value for ice sheet convection. My procedure is detailed in the paper. But to answer your question, I found that the critical Rayleigh number for an anisotropic visco-plastic poly-crystalline polar ice sheet would be attained near the center of the ice sheet when the effective viscosity of basal ice was in the 1o15 P (1016N s/m2) range, and when the ice thickness below the density inversion was not less than 3 km, assuming a viscous scale height of 8.4. Hence, 1o15P and 3 km/8.4 = 360 m are substituted for ice viscosity and thickness, respectively, in the equation for the Rayleigh number for initiating convection. Once begun, a preferred ice fabric can reduce the effective viscosity to the 1o14P range, and a separate Rayleigh criterion for maintaining convection might remain satisfied for ice depths below the density inversion as low as 1.5 km. This suggests that ice sheet spreading may transport dike sill convecting systems which remain active until the ice sheet thins to about 2 km in thickness, or perhaps a bit less.


