


1. INTRODUCTION
There is an interest in improving Global Navigation Satellite Systems (GNSS) receiver processing such that GNSS can operate effectively in dense multipath environments. Recently, several efforts to improve the performance of location-based services using GNSS in indoor environments have been performed (Soloviev et al., Reference Soloviev, Van Grass and Gunamardena2009). Global Positioning System (GPS)-based positioning techniques encounter serious issues in urban canyons and indoor areas due to significant signal attenuation and fading where users are very likely to operate. To enhance the sensitivity and the availability of the position solution using GNSS in these adverse environments, high sensitivity techniques based on extending the coherent integration time have been developed (Peterson et al., Reference Peterson, Bruckner and Heye1997; Van Diggelen, Reference Van Diggelen2009). However, there are practical limits that restrict the coherent integration time. The primary limitation is the 20 ms period of the navigation message. The Binary Phase Shift Keying (BPSK)-modulated navigation message induces an 180° phase shift across bit transitions. Although a bit transition does not happen every 20 ms, it statistically negates the constructive effect of increasing the coherent integration time if it remains uncompensated (Van Diggelen, Reference Van Diggelen2009). Thus, coherent integrations longer than 20 ms can be realised only when the navigation data is aided or estimated with the receiver. Besides this factor, the coherent integration time is limited by oscillator instability (Watson et al., Reference Watson, Lachapelle and Klukas2006), receiver velocity and the propagation model of the multipath channels due to the random variation of the carrier phase and Doppler frequency in dense multipath environments (Broumandan et al., Reference Broumandan, Nielsen and Lachapelle2011). Doppler measurements have been used in attenuated circumstances to improve the relative position estimation utilising the velocity solution (Borio et al., Reference Borio, Sokolova and Lachapelle2011). The use of Doppler measurements has recently gained much attention due to its various usages in different applications such as aiding the GPS processing with Inertial Navigation Systems (INS) in urban and multipath environments (Aminian, Reference Aminian2011). In various applications, the velocity solution is extracted based on Doppler measurements. Hence, the accuracy of the Doppler measurement plays a critical role in such applications. Conventionally, a GPS/INS integrated system utilises pseudorange measurements to aid the INS. Recently, raw Doppler measurements (Petovello, Reference Petovello2003) or the velocity information extracted from them (Moafipoor et al., Reference Moafipoor, Grejner-Brzezinska and Toth2004) have been used to update the INS drift.
Previous work on GPS Doppler characterization (Van Grass and Soloviev, Reference Van Grass and Soloviev2004; Aminian et al., Reference Aminian, Renaudin, Borio and Lachapelle2010) has focused on open sky conditions and in urban environments where the multipath components affect the line of sight signals. However, the Doppler measurements have not been fully characterised for indoor pedestrian navigation scenarios with the propagation channel represented by a Rayleigh fading model. In (Aminian et al., Reference Aminian, Renaudin, Borio and Lachapelle2010), a practical method to characterise the Doppler and velocity measurements in the indoor environments based on the Block Processing technique is proposed. However, the experiments were limited to North American residential houses. A comprehensive theoretical framework for velocity estimation has been developed in (Borio et al., Reference Borio, Sokolova and Lachapelle2011) to investigate the impact of the tracking loop parameters such as bandwidth, integration time and loop order as well as Carrier-to-Noise ratio (C/N0) and user dynamics on the accuracy of the Doppler and velocity measurements in attenuated signal environments.
When a mobile receiver is moving in multipath fading environments, the multipath components arrive at the receiver antenna from different paths, giving rise to randomly distributed Doppler shifts. The width of the distribution of the Doppler shifts is related to the Doppler spread. (Souden et al., Reference Souden, Affes, Benesty and Bahroun2009) defined the Doppler spread as the standard deviation of the Doppler shifts and explained the relation between the Doppler spread and the received signal Power Spectral Density (PSD).
This paper characterises the PSD of the received signal and consequently the Doppler estimation accuracy in indoor GPS channels due to the user motion. Controlled experiments with constant known antenna motion are used to determine the resulting Doppler spread. Experimental measurements with different satellites under different conditions have been utilised to verify the theoretical findings. The effect of the receiver antenna pattern on Doppler estimation and Doppler spectrum are theoretically and experimentally characterised. It is shown that the antenna gain pattern and the antenna orientation have a significant effect on the PSD measurements and consequently the Doppler measurements. The remainder of the paper is organised as follows. In Section 2 the signal model and the Block Processing method are described. Section 3 describes different multipath propagation models and theoretical Doppler spread characteristics. The effect of the antenna gain pattern on PSD is also considered in this section. Section 4 describes the measurement setup and the data collection scenarios. The experimental results and practical considerations are also given in this section. Conclusions are presented in Section 5.
2. SIGNAL MODEL AND BLOCK PROCESSING METHOD
Consider a mobile receiver scenario where the receiver is travelling along an arbitrary path in a dense multipath environment. The complex baseband signal representation of the received signal at the antenna output is denoted as r(t). The signal component of r(t) emanating from the k-th satellite is denoted as s k (t, p(t)), which is a function of time t and antenna position p(t). This signal can be expressed as:
where:
c k(t) is the Pseudo-Random Code (PRN) corresponding to the k-th satellite.
D(t) is the navigation data modulation.
τ is the code offset.
Δf k represents the frequency offset.
ψ k is the initial phase offset.
A k(p(t)) is the multipath channel response to the incident signal at the antenna position p(t).
The received signal is corrupted with additive noise, which has an equivalent complex baseband representation denoted by w(t). It is assumed that w(t) is a complex normal random process, independent of the signal and has a PSD that is constant within the bandwidth of the received signal. Hence, the representation of r(t) can then be expressed as:
where:
where K is the number of GPS satellites in view.
Here, the presence of simultaneous GPS signals will be ignored; hence, in the remainder of the text, for notational convenience, the subscript k is ignored and the received signal is modelled as:
where s0(t)=D(t−τ)c(t−τ)ej (2πΔft+ψ) is known to the receiver except for the navigation data, the code phase, the Doppler frequency and the initial phase offset ψ.
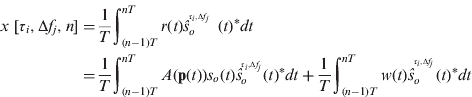
In this work, a method generally used in High Sensitivity (HS) receivers, known as the ‘Block Processing’ technique, is adopted to investigate the Doppler spread and Doppler estimation accuracy. In the Block Processing method, the receiver generates the replica signal for all possible values of Doppler and code phases and realises a bank of correlators for each processing epoch (Borio et al., Reference Borio, Sokolova and Lachapelle2011). The signal snapshot of r(t) is collected by the receiver and de-spread by the locally generated replica of ![]() for a given code phase τ i and Doppler frequency Δf j. The de-spread signal is then coherently integrated over a snapshot interval of t∈[(n−1)T, nT]. For the epoch number n the correlation process results in an output variable denoted by x [τ i, Δf j, n] corresponding to τ i, Δfj. Correlator outputs are expressed as:
for a given code phase τ i and Doppler frequency Δf j. The de-spread signal is then coherently integrated over a snapshot interval of t∈[(n−1)T, nT]. For the epoch number n the correlation process results in an output variable denoted by x [τ i, Δf j, n] corresponding to τ i, Δfj. Correlator outputs are expressed as:
Here, the Doppler frequency characterization in the multipath environments has been considered. Hence, it is assumed that the true code phase and the navigation data bits are known. The Doppler component observed by a moving receiver to the first order contains three terms, namely: the Doppler frequency caused by the satellite motion, Doppler due to the receiver clock drift and Doppler due to the receiver motion. Since in this work the Doppler frequency induced by the receiver motion is of interest and to reduce the range of the Doppler search and computational burden in the Block Processing method, other Doppler components are wiped off. This has been done by aiding the moving receiver process by a nearby reference receiver collecting synchronous signals under open sky static conditions. Hence, considering the aiding process the correlator outputs can be expressed as:
where ![]() .
.
Since the code phase is known, the correlator outputs can be written as:
where G is the correlation gain.
Equation (7) can be considered as the noisy samples of the Short Time Fourier Transform (STFT) of the windowed channel response between [(n−1)T, nT]. Adding the square of absolute values of the correlator outputs for the consecutive windows reduces the noise effect on Fourier transform samples. Thus, the PSD can be expressed as:
where NT is the total observation time.
As mentioned before, by aiding the true code delay, the Doppler frequency estimation is reduced to sinusoidal frequency estimation in noise (Borio et al., Reference Borio, Sokolova and Lachapelle2011). Thus, the Maximum Likelihood (ML) frequency estimation can be expressed as:

Figure 1 shows the Doppler estimation block diagram based on the Block Processing method.

Figure 1. Doppler estimation using the ‘Block Processing’ method.
3. DOPPLER CHARACTERISTICS IN MULTIPATH FADING
In the multipath GNSS channel, propagation between a satellite and a receiver is not only by the direct Line-Of-Sight (LOS) path, but also by many other paths through scattering by reflections from or diffraction around buildings and terrain. Hence, the signal received by the receiver consists of a large number of plane waves whose amplitudes, phases, and angle of arrivals relative to the motion direction are random. Any changes in the scatterers' geometry will change the resulting plane wave incident on the receiver. Hence, in dense multipath environments, the received frequency consists of contributions from many reflected signals, each shifted in frequency by a Doppler shift commensurate with the motion along the corresponding path. In indoor environments, these paths may be assumed to be arriving from the surface of a sphere whose radius is large compared to the signal wavelength (Blaunstein and Anderson, Reference Blaunstein and Andersen2002). Frequencies associated to these paths are confined to the Doppler spread around the transmitted frequency (Van Trees, Reference Van Trees2002). This model is called the ‘sphere of scatterers’ model. Measurement results in (Broumandan et al., Reference Broumandan, Nielsen and Lachapelle2010; Dehghanian et al., Reference Dehghanian, Nielsen and Lachapelle2010) have shown that the indoor GNSS channels can be characterised by the sphere of scatterers model. Hence, this model has been considered here. Consider a GNSS receiver traveling with a constant speed of |v| in a 3D coordinate system as shown in Figure 2 and a multipath environment characterised by the ‘sphere of scatterers’ model.

Figure 2. GNSS receiver traveling in a multipath environment.
The Doppler shift associated to a path is related to its Angle Of Arrivals (AOA) and can be denoted as:
where:
α and β are the azimuth and elevation angles of the incident path.
α 0 and β 0 are the azimuth and elevation angles of the motion direction.
f m is the maximum Doppler shift which is defined by:
(11)
where λ signifies the carrier wavelength.
The total power of the plane waves arriving from the surface element of dαdβ, denoted here as the surface element, received by a non-isotropic antenna and correct polarization is denoted by:
where:
B LPF is the bandwidth of the low pass filter.
p(α, β) represents the scatterers' distribution.
G(α, β) is the 3D antenna gain pattern relative to the isotropic antenna.
The sinc function represents the effect of the coherent integration time's windowing in the frequency domain where B LPF is defined as
where T is the coherent integration time.
The total power spectrum can be obtained by summing the contributions of all paths. This expression is denoted as:

If the coherent integration time is large enough, Equation (14) can be rewritten as:
where δ(t) is the delta dirac function.
Equations (14) and (15) in their general forms are too complicated to result in a close form expression and should be calculated numerically. By considering some assumptions on the scatterers' distribution, the PSD formulation can be simplified. Assuming that the distribution of the scatterers in the horizontal plane is independent from their distribution in the vertical plane, p(α, β) can be written as
Considering the same assumption for the antenna gain pattern, G(α, β) can be written as:
Replacing Equation (16) and Equation (17) in Equation (14), and setting α 0, β 0 to zero, Equation (17) can be rewritten as:

In the following, one widely-used scatterers model which results in closed form expressions for PSD has been considered.
3.1. Clark's Ring of Scatterers Model
Assuming the 2D uniform horizontal distribution of scatterers where ![]() and p(β)=δ(β), Equation (18) for an isotropic antenna can be simplified to:
and p(β)=δ(β), Equation (18) for an isotropic antenna can be simplified to:

where  can be written as:
replacing Equation (20) in Equation (19), the PSD for the ring of scatterers model can be written as:

which is the well-known U shaped PSD (Clarke, Reference Clarke1968).
Considering different assumptions on p(α, β) and G(α, β), different theoretical PSDs can be obtained. Herein, the theoretical PSD curves under three different circumstances are numerically calculated utilising Equation (15). Figure 3(a) shows the normalised PSD curves for ‘ring of scatterers’ and ‘sphere of scatterers’ models. This figure also shows the effect of the antenna gain pattern on the observed PSD in the sphere of scatterers environments observed by a non-isotropic GNSS antenna. Since in the experimental section the Novatel 702 GG antenna is used, in Figure 3(a) its gain pattern (Novatel Inc, 2011a) is considered to calculate the theoretical PSD curve. The Novatel 702 GG antenna gain pattern and its orientation with respect to the motion direction are shown in Figure 3(b).

Figure 3. (a) Theoretical PSD of ring and ‘sphere of scatterers’ are compared with that of a sphere of scatterers observed by a directional antenna. (b) Novatel 702 GG antenna gain pattern (Novatel Inc, 2011a) and its orientation with respect to the motion direction.
4. EXPERIMENTAL RESULTS
In the previous sections, PSD and Doppler characteristics in various multipath environments based on commonly used diffuse multipath models were analysed. In this section, live GPS signal measurements in a dense indoor fading environment are considered to verify the theoretical findings. In addition, the velocity solution utilising the Doppler measurements is characterised in this section.
Data collection was performed in a laboratory located at the University of Calgary. The laboratory has concrete walls and metallic structure considered an extremely harsh multipath environment. Figure 4 shows the data collection setup and location.

Figure 4. Data collection location and setups. (a) Two differently oriented antennas [Up-facing and East-facing] with an IMU are mounted on a moving table. (b) Sky plot shows the available GPS PRNs [red circles] and the motion direction of each set.
In order to acquire GPS signals in such an environment, an Assisted GPS (A-GPS) approach was utilised. The aiding information consisting of navigation data bits, the code phase and the Doppler frequency were provided by a nearby outdoor static reference receiver.
To investigate the effect of the antenna gain pattern on the Doppler spectrum, two NovAtel 702 GG antennas with different orientations collecting data simultaneously as shown in Figure 4 were utilised. GPS L1 signals from the outdoor and indoor antennas were captured using a three-channel front-end operating in a synchronised mode. All the three channels were connected to a reference oscillator. During the data collection process, the indoor antennas were mounted on a precise linear motion table moving at a speed of 50 cm/s in order to emulate user motion. With such velocity, the maximum Doppler shift due to the indoor antenna motion was about 2·6 Hz for the GPS L1 frequency. The indoor antennas were located 50 cm apart in order to minimise the mutual coupling effect (Allen and Ghavami, Reference Allen and Ghavami2005). One of the antennas was erected vertically (the antenna gain pattern was perpendicular to the motion direction), while the other was aligned to the motion direction. Herein, two data sets (Data Sets 1 and 2) were captured.
In ‘Data Set 1’, the moving table was aligned with the East–West direction. One of the antennas was mounted such that the maximum antenna gain pattern was directed toward zenith (as shown in Figure 4a). Another antenna was mounted East-facing aligned with the motion direction where the maximum antenna gain pattern was directed to horizon.
In ‘Data Set 2’, the moving table was placed in the North–South direction as shown in Figure 4b. In this data set, the second indoor antenna was mounted towards North.
In addition to the indoor antennas, a tactical grade Inertial Measurement Unit (IMU) was mounted on the moving table to provide the reference Doppler measurements. The ‘SPAN–LCI’ was used as the tactical grade IMU (Novatel Inc, 2011b).
Aiding the indoor receiver process with the outdoor receiver Doppler frequency results in a reaming indoor Doppler frequency associated with the indoor receiver motion. The moving table forward-backward motion creates two Doppler frequencies associated with these motions. These two Doppler frequencies have the same value and opposite signs. For the sake of illustration, the backward motion is eliminated using the reference Doppler measurements extracted from the IMU measurements. This elimination yields to a pure Eastward motion for Data Set 1 and a pure southward motion for Data Set 2 with a constant speed of 50 cm/s.
To evaluate the Doppler frequency characterization in the indoor fading environments a search space of ±5 Hz centred on the outdoor antenna Doppler frequency was selected. The captured data was processed with the GSNRx-rr™ software receiver (O'Driscoll et al., Reference O'Driscoll, Lachapelle and Tamazin2010).
The correlation outputs are calculated using three different coherent integration times namely 200 ms, 400 ms and 800 ms. Different coherent integration times were utilised to investigate the effect of the coherent integration time on the observed PSD and the Doppler estimation accuracy. The correlation outputs then passed to a processing function to estimate the Doppler and velocity solution characteristics.
4.1. Power Spectral Density Characteristics of the Indoor GPS Channels
As alluded to in the theoretical section, different multipath models have been proposed to characterise the PSD of the received signal in different multipath environments. Moreover, the effect of the antenna gain pattern on the received signal PSD was analysed. Measurement results in (Broumandan et al., Reference Broumandan, Nielsen and Lachapelle2010; Dehghanian et al., Reference Dehghanian, Nielsen and Lachapelle2010) have shown that the indoor GPS channel can be characterised by the ‘sphere of scatterers’ model. Herein, the PSD measurements for several PRNs in a harsh environment can be compared with the theoretical PSD values derived from the sphere of scatterers model. The theoretical PSD curves are calculated utilising the nominal antenna gain pattern calculated numerically using Equation (14). The Novatel 702 GG antenna gain pattern is shown in Figure 3b. Figure 5 shows the measured PSD curves for different PRNs in Data Set 1. For comparison, the theoretical PSD curves based on the sphere of scatterers multipath model considering the utilised antenna gain pattern are overlaid. The theoretical Doppler values due to the LOS signals using Equation (10) are also shown with vertical arrows. The PSD curves are measured based on adding the correlation outputs for all processing epochs in the frequency domain for 1000 s of captured data.

Figure 5. PSD curves for Data Set 1. (a) East-facing antenna. (b) Up-facing antenna.
Figure 6 shows the theoretical and measured PSD curves for Data Set 2.

Figure 6. PSD curves for Data Set 2. (a) North-facing antenna. (b) Up-facing antenna.
Considering the results of Figure 5 and Figure 6, several observations can be made.
In the case of the East-facing and North-facing antennas where the results are shown in Figure 5(a) and Figure 6(a), the PSD curves for all PRNs follow the theoretical fit. The peaks of the PSD curves are located close to the maximum Doppler shift of 2·6 Hz for a speed of 50 cm/s. This is due to the fact that in the North-facing and East-facing cases the antenna pattern has a maximum gain in the motion direction. Hence, the antenna gain pattern amplifies signals arriving from the horizon. The measurement results clearly show that the antenna gain pattern shapes the PSD pattern. Increasing the coherent integration time sharpens the measured PSD curves; however it does not improve the accuracy of the measurements.
In the Up-facing antenna cases where the results are shown in Figure 5(b) and Figure 6(b), although the theoretical fit are still acceptable, the goodness of fit is reduced with respect to the North-facing or East-facing cases. The measured PSD curves for some PRNs (e.g., PRN 20, PRN 32) do not match the theoretical curves. This phenomenon is more observable by increasing the coherent integration time in the case of higher elevation satellites. This observation indicates that there are dominant components on higher elevation PRNs. Presence of the dominant components in fact disrupts the sphere of scatterers model and cause the observed PSD curves deviate from the theoretical one. It should be mentioned that the presence of such dominant components on higher elevation PRNs is also reported in (Keshvadi et al., Reference Keshvadi, Broumandan and Lachapelle2012) where some data collections were performed in the same location.
Although these components are dominant in the Up-facing cases, they are not strong enough to overcome the 10 to 15 dB attenuation due to the antenna gain pattern in the North-facing or East-facing cases. It should be mentioned that although some of these dominant components are representing the LOS Doppler values (e.g., PRN 32 and 20 in Data Set 1), others are expressing the Doppler frequency of the reflected dominant paths (e.g. PRN 31 in both Data Sets 1 and 2).
As a closing remark, since the PSD measurements of differently oriented antennas (Up-facing versus North-facing or East-facing) are significantly different, it can be concluded that the antenna gain pattern and the orientation of the antenna has a significant effect on the measured PSD curves in dense multipath environments.
4.2. Doppler Estimation Characteristics
To investigate the Doppler estimation characteristics in the multipath fading environment, an epoch-by-epoch Doppler estimation method is exploited. In this method, the index of peak value of the correlator outputs at each processing epoch was considered as the estimated Doppler. Figure 7 shows the experimentally measured Probability Density Functions (PDF) of the estimated Doppler frequencies for the Up-facing and the East-facing antennas in Data Set 1. The Doppler values due to the LOS components are also shown in Figure 7.

Figure 7. PDF of estimated Doppler values in the Data Set 1. (a) East-facing. (b) Up-facing.
Figure 8 shows the measured PDFs extracted from the Up-facing and North-facing antenna in Data Set 2.

Figure 8. PDF of estimated Doppler values in the Data Set 2. (a) North-facing. (b) Up-facing.
In the East or North-facing cases [Figure 7(a) and Figure 8(a)], the estimated Doppler frequencies for all available PRNs follow the same pattern. As expected from the theoretical results (Figure 5 and Figure 6), in the multipath fading environments, the Doppler measurements extracted from the antennas aligned with the motion direction are more likely to be around the maximum Doppler shift.
The measurement results in the Up-facing antenna cases reveal that for most PRNs the estimated Doppler values are distributed around zero. This phenomenon agrees with the theoretical findings provided in the previous section. This is due to the fact that in such cases the antenna's maximum gain pattern is perpendicular to the motion direction. The experimental measurements provided here are in agreement with the measurement results of (He et al., 2012) where an Up-facing antenna in different indoor locations was used.
However, in some circumstances (e.g., PRN 20 and PRN 32) where the satellites are located in higher elevation angles, the estimated Doppler frequencies follow the LOS Doppler values. As discussed in the previous section, this is due to the existence of dominant paths. However, these dominant components are attenuated by the antenna gain pattern in the East-facing or North-facing cases; hence, their effect is not noticeable in these cases. Increasing the coherent integration time reduces the Doppler estimation errors in cases where the LOS signal is the dominant component.
It can be concluded that the measured PSD curves shown in Figure 5 and Figure 6 follow the estimated Doppler frequencies pattern shown in Figure 7 and Figure 8.
4.3. Discussion and Comparison with Attenuated Signal Situation
In (Borio et al., Reference Borio, Sokolova and Lachapelle2011), a theoretical bound for the Doppler estimation standard deviation (STD) using the Block Processing method for attenuated signal circumstances is given. The theoretical bound on the Doppler STD is given as:
where:
C/N 0 represents the carrier-to-noise ratio.
T is the coherent integration time.
Experimental results (Borio et al., Reference Borio, Sokolova and Lachapelle2011), have shown that in attenuated signal environments the measurement results utilising the Block Processing techniques agrees with the theoretical findings given in Equation (22). It should be noted that the theoretical STD in Equation (22) was derived under the attenuated LOS circumstances where the multipath effect on the Doppler estimation was not considered. To investigate the effect of multipath propagation on the Doppler estimation accuracy in diffuse multipath environments, the empirically measured Doppler STDs extracted from different antennas are shown in Figure 9. The theoretical STD curves based on Equation (22) for different C/N 0 and coherent integration times are also overlaid to compare with the empirical STD values.

Figure 9. Doppler estimation STD for: North-facing (NF); East-facing (EF); Up-facing (UF);Theoretical Attenuated LOS and (TALOS). (a) Data Set 1. (b) Data Set 2.
Since the measured Doppler STD values are significantly higher than the theoretical STD values, it can be concluded that the multipath propagation in dense multipath environment is the main source of error. It should be mentioned that the multipath phenomenon not only significantly increases the Doppler measurement STD but also induces a bias on the Doppler measurements, which is clearly noticeable in Figure 7 and Figure 8.
4.4. Velocity Estimation
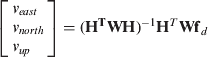
Since in many GNSS applications the Doppler observations are used to aid the position estimation and extract the velocity solution, the effect of Doppler estimation in harsh multipath environments on the velocity solution is considered. The A-GPS method was used whereby the Doppler measurements from the outdoor static antenna were exploited to wipe off the Doppler component caused by the satellite motion and clock drift from the indoor Doppler measurements. Then the measured Doppler values were used to estimate the velocity of the moving antenna. A least squares method was used to estimate the rover receiver velocity in each epoch. The least squares approach can be formulated as:
where:
v i is the velocity in the i-th direction (i.e., North, East and Up).
W is the weighting matrix, which herein is assumed to be a unitary matrix.
fd is the Doppler measurements vector due to the receiver motion.
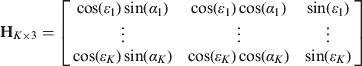
H is the design matrix, written as:
(24)
where:
ɛ i and α i are the elevation and azimuth of i-th satellite respectively.
K is the number of the satellites.
Figure 10 shows the estimated velocity in the East, North and Up (ENU) coordinate for 400 ms coherent integration time of both Data Sets 1 and 2.

Figure 10. ENU velocity. (a) Data Set 1, where the antenna performed East–West motion: (b) Data Set 2, where antenna performed North–South motion.
The observations from Figure 10 can be summarised as follows:
• The measured velocities in different directions in both data sets do not follow the true velocities.
• The measured up velocities extracted from the East-facing and the North-facing antennas are biased. This is due to the fact that all Doppler measurements extracted from the antennas aligned with the motion direction are biased. This phenomenon has been shown in Figure 7(a) and Figure 8(a). Although in the stand-alone velocity estimation method this bias is generally associated with the clock drift, in the reference and rover approach utilised here, a common oscillator has been used. Hence, the clock drift term has been removed from the estimation parameters in Equation (23). As shown, the biased Doppler measurement is mostly associated to the up velocity. This is due the fact that all available satellites are located on one side of the Earth and hence this bias is reflected in the Up velocity.
A more quantified analysis on the velocity solution can be made through the Root Mean Square Error (RMSE) metric. The RMSE values for the individual cases are calculated by:
where:
- is the estimated velocity in i-th direction (i.e., North, East and Up).
v i is the true velocity in the direction which extracted from the reference IMU.
Table 1 and Table 2 tabulate the RMSE values of different scenarios using different coherent integration times for Data Sets 1 and 2 respectively.
Table 1. RMSE velocity values for Data Set 1 (m/s). True velocity=0·5 m/s East.

Table 2. RMSE velocity values for Data Set 2 (m/s). True velocity=0·5 m/s South.
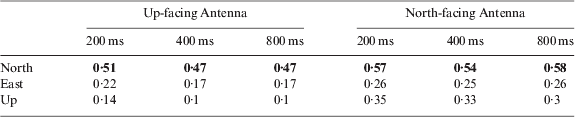
Considering the results of Table 1 and Table 2, the most important observations are the significant errors on velocity solutions especially in the antenna motion direction (shown by bold numbers). These velocity measurement errors are induced by neither accurate nor precise Doppler measurements. The RMSE values in the motion direction are around the actual velocity, which indicates very poor Doppler-derived velocity solution. Hence, it can be concluded that velocity cannot be correctly estimated from the Doppler measurements in the test environment.
Beside this main observation, it is seen that increasing the coherent integration time can slightly enhance the velocity estimation performance for the Up-facing antenna cases. However, this is not the case for the East-facing and North-facing antennas. This slight enhancement is due to improvement in the Doppler measurements on satellites with dominant LOS components (e.g., PRNs 20 and 32 in Data Set 1).
5. CONCLUSIONS
Doppler measurement characterization in dense multipath environments for a mobile receiver has been considered. The Doppler measurements characteristics in terms of the Doppler spread and Power Spectral Density (PSD) metrics have been theoretically analysed for different scatterer models. The effect of the antenna gain pattern on the Doppler PSD was also considered theoretically and practically, using antennas with different orientations. It was shown that the antenna gain pattern plays a critical role in the estimated Doppler values. A good agreement between the experimental and theoretical results was obtained. Of specific interest was the evaluation of the velocity solution derived from the Doppler measurements in the dense multipath environments. The experimental results revealed poor velocity solution utilising the Doppler measurements. Inaccurate Doppler measurements due to the multipath propagation cause inaccurate velocity estimation. It was also shown that the estimated velocity in the multipath environments does not follow the reference velocity, making its usage limited to cases that a dominant Line-Of-Sight (LOS) signal is present.


