


Saving and financial market participation are actions that support many lifecycle consumption goals. Studies have shown that these actions affect financial outcomes, including the prospect of declaring bankruptcy, the ability to meet ongoing financial needs and the prospect of a comfortable retirement (Cole et al., Reference Cole, Paulson and Shastry2014).Footnote 1 Because of their importance, a variety of academic and policy initiatives seek to understand the factors associated with these actions and to increase levels of savings and financial market participation. We investigate two critical drivers of financial market participation: trust and financial literacy. Prior studies have analyzed these two drivers separately, but not simultaneously at the level of detail offered here. Considering these relationships is important because, in addition to driving participation, levels of trust and financial literacy may affect the potential vulnerability of market participants.
We find both trust and financial literacy are related to financial market participation, to the use of specific products, and to preferences for the use of intermediaries – including preferences for robo advisor platforms. Importantly, we find that although increases in trust are consistently correlated with increases in financial market participation, increases in financial literacy have a different relation to market participation. From low to middle levels, increases in financial literacy are associated with declines in average levels of financial market participation. From middle to high levels of financial literacy, rates of financial market participation increase. We find this to be linked to preferences for different account types.
We also document a relationship between our measures of financial market participation and perceived economic well-being, using Consumer Financial Protection Bureau (CFPB) measures of well-being. Our findings support research suggesting that increasing levels of both trust and financial literacy can increase financial market participation and thereby improve financial well-being. At the same time, we highlight the potential vulnerability of those with high levels of trust and low levels of financial literacy.
We further explore the vectors through which these attributes operate. For example, we find that those who report the lowest levels of financial market participation have the lowest average measured levels of trust-in-others. Similarly, we find those who hold brokerage accounts to be more trusting, on average than those whose only market participation is through an employer-sponsored retirement account. We find that, among those with above-average financial literacy, higher levels of financial literacy are associated with an increased likelihood of holding discount brokerage accounts.
We also explore the impact of trust and financial literacy on preferences for types of financial market participation. We find that trust is associated with an increased preference for financial advice, and specifically, a preference for human advice rather than robo advice.Footnote 2 We find that those who hold only defined contribution (DC) accounts have higher levels of trust in their employers relative to others. We observe higher levels of financial literacy among those who prefer to work more autonomously and less through any type of intermediary.
We begin by briefly reviewing the literature on trust and financial literacy as they relate to financial market participation. We next describe our project, in which we develop and field a survey that includes participant-specific measures of trust and financial literacy as well as standard demographic controls. Our primary outcome variable is financial market participation which we explore through both quantitative measures and an exploration of specific types of participation. We also explore preferences for delegation, and preferences for interactions with robo versus human advisors. We conclude with a summary of the contributions our findings offer for: (1) how financial market participation depends on both financial literacy and trust over the lifecycle and, (2) how best to connect people with financial markets, to help them grow and manage lifecycle wealth.
1. Summary of the literature
An extensive literature examines financial market participation and the relationship between such participation and economic well-being. Brown et al. (Reference Brown, Ivkovich, Smith and Weisbenner2004) report that individuals who participate in the stock market accumulate significantly more wealth relative to a given level of savings, than individuals who do not.Footnote 3 Fichtner and Seligman (Reference Fichtner, Seligman and Mitchell2018) find that active participation in the equities market was an important predictor of wealth preservation for retired households over the 2008–2014 period. Given the high return of stocks, the failure of many households to participate in the financial markets has been described as a ‘participation puzzle’ (Chien and Morris, Reference Chien and Morris2017).
Market participation depends critically on both the willingness of individuals to participate and their competence in doing so. Some have questioned the ability of ordinary people to engage in ‘do-it-yourself finance’ effectively (Ryan et al., Reference Ryan, Trumbull and Tufano2011). Others state that there is ‘ample evidence that people frequently make poor financial decisions when deciding on … complex products’ (Agnew et al., Reference Agnew, Bateman, Eckert, Iskhakov, Louviere and Thorp2018). With respect to the specific issue of retirement savings, studies are mixed. Some studies raise concerns that Americans save and invest too little for retirement (Munnell et al., Reference Munnell, Webb and Golub-Sass2007; Munnell et al., Reference Munnell, Hou and Webb2014), whereas other studies suggest that Americans are roughly on track (Engen et al., Reference Engen, Gale and Uccello2005; Hurst and Aguiar, Reference Hurst and Aguiar2005; Scholz et al., Reference Scholz, Seshadri and Khitatrakun2006). Some research has also identified a variety of common investment mistakes (Fisch and Wilkinson-Ryan, Reference Fisch and Wilkinson-Ryan2014).
Some studies indicate that limited financial literacy may cause some investors to avoid participating in the market. Others argue that the failure to participate is related to a lack of trust (Guiso et al., Reference Guiso, Sapienza and Zingales2008; Bricker and Li, Reference Bricker and Li2015). This paper empirically examines the role of both factors, trust and financial literacy, in explaining financial market participation.
Financial literacy may both (1) enhance the ability of individuals to manage their investments, and (2) enhance their ability to monitor intermediaries appropriately.Footnote 4 An extensive literature, however, documents test scores that suggest widespread financial illiteracy and correlated failures in saving and investing (e.g., Lusardi, Mitchell, and Curto, Reference Lusardi, Mitchell and Curto2010; Lusardi and Mitchell, Reference Lusardi and Mitchell2014). A lack of financial literacy may affect people's willingness to invest in financial markets, whether independently or through an intermediary. The normative finding that financial literacy ought to be improved is supported by Van Rooij et al. (Reference Van Rooij, Lusardi and Alessie2012), who document a positive relationship between financial literacy and wealth. Seligman and Bose (Reference Seligman and Bose2012) find that participation in workplace financial literacy seminars combined with the opportunity for active portfolio selection in a DC plan lead to increased financial market participation outside of the workplace and significantly increased household wealth at retirement.
Use of financial products and services implies trust in markets, trust in counterparties, and trust in the suitability of investments being sold. Guiso et al. (Reference Guiso, Sapienza and Zingales2008) find that ‘trust has a positive and large effect on stock market participation as well as on the share invested in stocks’. El-Attar and Poschke (Reference El- Attar and Poschke2011) find that the less trusting tend to invest more in housing and less in riskier financial assets. Haman (2015) explores levels of institutional and individual trust across 15 countries and concludes that trust explains differences in levels of stock market participation. Asgharian et al. (Reference Asgharian, Liu and Lundtofte2017) find that trust in institutions is a function of their quality and relates to stock market participation.
Trust is an important driver of economic activity (Evans and Krueger, Reference Evans and Krueger2009; Hilsenrath, Reference Hilsenrath2013). Focusing on broker–investor relationships, Langevoort (Reference Langevoort1996) suggests a time dynamic whereby brokers build trust, which later substitutes for due diligence on (even sophisticated) investors' part – a developed vulnerability, attributable to hubris by both investors and their agents (brokers). The study of Vohs et al. (Reference Vohs, Baumeister and Chin2007) investigates mistrust and fears of exploitation in economic exchange. They find mistrust to increase with a person's perception that another can take advantage of them, i.e., vulnerability. Research has found that levels of trust are correlated with willingness to invest (Sapienza and Zingales, Reference Sapienza and Zingales2012), and that a lack of trust in the financial system leads some people not to invest in stocks (Guiso et al., Reference Guiso, Sapienza and Zingales2008). Giannetti and Wang (Reference Giannetti and Wang2016) find that revelations of corporate fraud are followed by reductions in households' use of equity markets.
Studies have also sought to identify demographic factors such as race, culture, age, and education that relate to trust and economic exchanges. Smith (Reference Smith2010) reviews a large literature on race and trust. She documents negative economic consequences stemming from a lack of trust across racial groups. Culture, a broader but somewhat proximate concept to race which is connected to factors such as language, religion, and shared history has also been found to impact trust and trade (Guiso et al., Reference Guiso, Sapienza and Zingales2009). Age has been found to have a strong, positive, nonlinear correlation with trust, and people with more education have been documented as being more trusting (Uslaner, Reference Uslaner2002).
Studies that explore the role of trust measure it in a variety of ways. One popular tool is the Trust Game, based on the study of Berg et al. (Reference Berg, Dickhaut and McCabe1995).Footnote 5 Another literature assesses trust using a general question in the World Values Survey (WVS) which asks: ‘Generally speaking, would you say that most people can be trusted or that you need to be very careful in dealing with people?’ (Banerjee, Reference Banerjee2018).Footnote 6 Several studies have used the WVS question to identify a correlation between trust and stock market participation (e.g., Guiso et al., Reference Guiso, Sapienza and Zingales2008; Georgarakos and Pasini, Reference Georgarakos and Pasini2011). The WVS question is particularly useful in analyzing cross-country comparisons (e.g., Georgarakos and Inderst, Reference Georgarakos and Inderst2014). The question from the WVS is based on a similar question from the General Social Survey (GSS), which has been fielded in the United States since 1972.Footnote 7
Others have identified alternative approaches to measuring trust. Frazier et al. (Reference Frazier, Johnson and Fainshmidt2013) survey trust measures and construct a propensity-to-trust scale building from studies in Mayer and Davis (Reference Mayer and Davis1999), Lee and Turban (Reference Lee and Turban2001), McKnight et al. (Reference McKnight, Choudhury and Kacmar2002), Huff and Kelley (Reference Huff and Kelley2003), and Goldberg et al. (Reference Goldberg, Johnson, Eber, Hogan, Ashton, Cloninger and Gough2006).Footnote 8
Notably, survey questions such as those used to build the propensity-to-trust scale or the WVS/GSS measures are abstract – they do not distinguish professional or transactional context. Glaeser et al. (Reference Glaeser, Laibson, Scheinkman and Soutter2000), broadly critique abstract measures, noting they may be good for measuring macro- or state-level differences but may fail to identify transaction-relevant cues which vary from person to person and even from context to context for the same person.
A response to this critique has been to examine trust within specific contexts. Sapienza and Zingales (Reference Sapienza and Zingales2009–2019) report levels of trust in a variety of people and institutions; in an ongoing annual survey. In contrast to the general trend for the GSS data, their financial trust index (FTI) exhibits a general pattern of increasing trust in the financial sector over the period since the financial crisis. This may well be more pertinent to financial market participation than the general sentiment captured by the GSS. The FTI also documents changes in trust over time across financial institutions such as Banks, Mutual Funds, and the overall Stock Market.Footnote 9 Guiso et al. (Reference Guiso, Sapienza and Zingales2008) look at trust in institutions, and Sapienza and Zingales (Reference Sapienza and Zingales2012) consider trust in individuals versus trust in banks. Asgharian et al. (Reference Asgharian, Liu and Lundtofte2017) contrast general trust as measured by the WVS and trust that is related to institutions.
We continue the development of more contextualized trust measures, with questions that explore trust in situations, trust in institutions, and trust of people in specific contexts. Our design is notable in that a general trust-in-people measure, constructed by averaging trust across all professional settings, performs similarly to the WVS/GSS measure. This feature of our design acts to validate the balance in spectrum of settings chosen, and further offers an opportunity to use the same data to construct either general or specific trust measures, which in turn affords perspective on the critique of general trust measures in Glaeser et al. (Reference Glaeser, Laibson, Scheinkman and Soutter2000). Differences among the types of people act to further validate both our survey design and the sample, for example we find uniformly lower levels of trust for car sales people than for doctors. As a final robustness check of our sample, we also examine trust situationally and generate results that accord with our predictions.
If trust and financial literacy each play a role in facilitating investment, a natural question is whether there is a relationship between the two. Although intuitively it might seem as although financial literacy could offset trust and reduce vulnerability to fraud, some recent research finds that highly educated wealthy people in peak savings years ahead of retirement may be particularly vulnerable to being scammed (Lee et al., Reference Lee, Cummings and Martin2019). High levels of trust, particularly by unsophisticated investors, may increase vulnerability to purchasing unsuitable investments and even to experiencing outright fraud (Hackethal et al., Reference Hackethal, Haliassos and Jappelli2012).Footnote 10 Individuals may be especially vulnerable as they approach retirement and assume increasing responsibility for managing more money than they have previously (Fisch et al., Reference Fisch, Lusardi and Hasler2020). Working with both attributes allows us to offer findings on whether and how they relate to each other. This is important both for understanding the most appropriate ways to enhance financial market participation and for addressing any related issues regarding investor protection.
A few other studies have looked at both trust and financial literacy. Agnew et al. (Reference Agnew, Szykman, Utkus and Young2012) explore the relationship between trust, 401(k) plan knowledge and plan participation using a question on trust in financial institutions.Footnote 11 Among those automatically enrolled, they find trust and understanding the employer's matching contribution policy are related to staying in the plan. Agnew et al. (Reference Agnew, Hung, Montgomery and Thorp2019) control for financial literacy and find that white-label DC investment options affiliated with highly trusted employers are more attractive to plan participants than other white-label options. Georgarakos and Inderst (Reference Georgarakos and Inderst2014) find that use of financial advice is related to both trust and financial capability.
Balloch et al. (Reference Balloch, Nicolae and Philip2015) use data from the American Life Panel (ALP) and find ‘stock market literacy’ is important for participation in equity markets, whereas trust further helps explain the level of market participation in equities. In comparison with these authors' binary measure of stock market participation, we construct a broader measure of financial market participation across several types of accounts.
Burke and Hung (Reference Burke and Hung2015) use the ALP to consider the role of trust in an area related to but distinct from market participation – the take-up of financial advice. They find that take-up of financial advice is positively correlated with trust and negatively correlated with financial literacy. However, they find that this is limited to environments where advice is voluntarily solicited. They additionally find that increased trust is related to better portfolio diversification.
Ricci and Caratelli (Reference Ricci and Caratelli2017) use a regional indicator of social capital contained in the Bank of Italy's Survey on Household Income and Wealth as a proxy for trust. They find financial literacy and the regional social capital measure are positively related to decisions to participate in voluntary pensions and to move deferred compensation balances to these pension accounts. However, given the limits of their proxy, they suggest more targeted survey work.Footnote 12 We respond to that suggestion here.
2. Data collection methods and survey design
Data collection and survey development occurred between late-2017 and mid-2018. We first developed and fielded an independent financial literacy survey, and tested trust questions with peers. We then integrated selected financial literacy questions with a large selection of questions targeting trust and aspects of financial life. Data were collected in weekly bursts, in order to monitor and validate survey collection incrementally. Toward the end of field work, we employed power analysis to determine a stopping point for field research.Footnote 13 Our final sample of 721 complete observations meets objectives derived from the power analysis.
2.1 Data collection methods
Our data collection environment consists of a survey developed and presented in the Qualtrics survey design tool. Our sample was engaged, surveyed, quality checked, and paid using the Mechanical Turk (MTurk) survey collection tool, including associated user-contributed scripts.Footnote 14 We limited participation to MTurk workers with Masters Qualification,Footnote 15 who were paid relatively well ($2.50 per completed survey),Footnote 16 and in a timely manner (within 7 days). Our survey incorporated an attention check question to help ensure respondents took care with completed responses.Footnote 17
Our survey consisted of several components. To evaluate financial literacy, we drew upon research described in the literature review and field-testing to generate a battery of ten financial literacy questions.Footnote 18 We incorporated two complementary, psychometrically validated measures of financial wellbeing developed by the CFPB.Footnote 19 We also developed three types of trust questions: (1) questions about trust in specific types of people {persons like yourself, financial advisors, reporters, government officials, employers, CEOs, doctors, and car sales people}; (2) a four-item measure of trust in the financial sector; and (3) a series of context-specific trust questions.Footnote 20
Our measure of financial market participation complements and expands on the Balloch et al. (Reference Balloch, Nicolae and Philip2015) binary ‘any-or-none’ measure of stock market participation. We provided subjects with a list of types of financial accounts that offer exposure to the financial markets, including retirement and brokerage accounts. We measure financial market participation by the number of account-types held, presently or in the past.Footnote 21 Our measure of financial market participation, like others, may have some drawbacks, including potential respondent confusion about the account categories. We also include two developed questions regarding preferences for financial market engagement, one related to tastes for working with a financial advisor, and another for a preference regarding the type of advisor, human or robo. Finally, we collect socio-economic and demographic data as controls.
3. General descriptive results
We report several descriptive results supporting the idea that trust is associated with greater financial engagement. Trust in people, broadly, along with trust in one's self, is correlated with greater financial engagement.Footnote 22 We find support for the idea that civic engagement and financial engagement are linked; we see greater financial market participation among those who vote in a higher percentage of presidential elections.Footnote 23 Related to delegation we find that trust in people and trust in financial advisors (narrowly) correlate with a greater preference for delegation. Related to the form of delegation we find that trust in one's self and trust in financial advisors are both correlated with declines in preference for robo advice.Footnote 24 We will revisit each of these findings in more detailed regressions later.
Our data yield several basic response patterns in support of the idea that respondents took the survey seriously. For example, respondents tended to generally trust bomb-sniffing dogs in airports but not leaving their bag with a stranger to use an airport restroom. As well, respondents were more likely to have faith in democracy in the United States than in Russia.
Table 1 offers summary statistics for our regression sample. It also compares our composite trust-in-people variable with a WVS/GSS type trust question. We find that the two measures have roughly identical means that are both just slightly above neutral (neither trust nor distrust). However, our composite measure has lower standard deviation.Footnote 25 Our respondents report a broader range of income, age, political, and educational backgrounds than is typically found in academic sample studies targeting trust in social and principal-agent contexts.Footnote 26
Table 1. Summary statistics for the regression sample and related samples

![]() [–], Question is intentionally placed in a negative frame.
[–], Question is intentionally placed in a negative frame.
−, Inverted scale: values increase in level of disagreement.
+, Variable is not directly employed in regressions but is included for descriptive purposes.
Although the composite trust-in-people measure performed very well, trust varied meaningfully across career-archetypes, for example a paired t-test strongly rejects the idea that trust responses for doctors and car sales people are equivalent. Similarly, financial advisors are significantly distinguishable from other person types by way of t-test comparisons. The only exceptions to the statistical distinctions in responses by person-type are between (1) doctors and persons-like-yourself and, (2) to a lesser extent, between CEOs and government officials.
Figure 1 highlights relationships between financial literacy and (1) general trust-in-people (top panel) and (2) financial advisors (bottom panel). We find no statistical relationship between financial literacy and general trust in people; we do find suggestive evidence of a mild decline in trust of financial advisors as financial literacy increases. This may be related to mistrust as described in Vohs et al. (Reference Vohs, Baumeister and Chin2007). However, variation is mild and bounded within the positive region of trust statements.

Figure 1. Patterns of trust and financial literacy. Data: Authors’ Mechanical Turk data collection. Sample of 721 individuals interviewed in spring and summer of 2018.
Level of trust is as follows:
5 Trust them a great deal
4 Tend to trust them
3 Neutral
2 Find it hard to trust them
1 Do not trust them at all.
We move next to exploring trust in the financial sector. We construct a composite measure of trust in Wall Street institutions and financial advisors that is increasing in trust and yields sample averages with a better than neutral sentiment overall.Footnote 27 The overall sentiment level is very consistent with that for financial advisors, when measured as a type of person (3.31 as compared to 3.38).
Beyond well-matched average values, we find a very clear positive correlation between reports of trust in the financial advisor person-type and in answers for our four-question battery targeting financial sector trust. This acts to cross validate both measures and lends credibility to our sample's ability to report attitudes consistently across different frames and contexts.
The results of our test of financial literacy are roughly in line with those reported in other studies, averaging below a grade of 70%. Standard deviations suggest a good amount of variation in scores across the sample, which is also roughly consistent with other survey results.
We find a non-linearity in account use related to both financial literacy and trust which is important to keep in mind for work in regression settings. The data suggest that although increases in the number of types of accounts held are generally associated with improvement along several other dimensions, those who hold the maximum number of types of accounts we can count, seven, have the highest overall trust-in-people scores and the lowest financial literacy scores of any group, including those holding no accounts. Those holding the maximum number of types of accounts consistently offer the highest trust ratings, across all types of other people. (This is the only group to offer a better than neutral average trust score for the car sales person type.) Those with the maximum number of types of accounts also have average financial literacy scores under 50%, whereas others' scores average over 70%.Footnote 28 Our data focus on account types; whereas we cannot know whether people are replicating the same portfolio within each type of account, the linking of high trust and low financial literacy to the highest observable diversification across types of accounts offers a potentially important caveat to the Burke and Hung (Reference Burke and Hung2015) finding that trust is related to better portfolio diversification.
Those holding no types of accounts have the second lowest financial literacy scores and the lowest trust scores in our group. This noted, we have no view as to the ideal number of types of accounts a person should hold. In fact, we believe differences in the number of account types are driven by financial literacy, trust, and preferences related to specific product characteristics.Footnote 29
Our survey population is relatively young, educated, and of more modest income than the United States as a whole. Median education is a 4-year college degree (Table 1). Eleven percent have more advanced degrees. The median age of a respondent is between 26 and 35; 48% of the sample is 36 or older. At the time of survey, median age for U.S. citizens was estimated to be 38 years (Fontenot, Semega, and Kollar, Reference Fontenot, Semega and Kollar2018). Median reported annual household income is between $25,000 and $50,000, lower than median household income in the United States.Footnote 30
The sample offers a look at financial market participation among a group that is primarily comprised of working-age adults; 5.4% report partial or full retirement.
The sample includes strong evidence of financial market participation – in particular, through self-directed retirement accounts. Indeed, 64% report experience with a DC plan, and 36% with an individual retirement account (IRA). Overall, 73% have experience with self-directed retirement accounts and, on average, with more than one type.
Table 2 compares results with our financial literacy questions to prior work that sampled both an MTurk survey group and group of Financial Industry Regulatory Authority (FINRA) registered professional advisors (see Fisch et al., Reference Fisch, Wilkinson-Ryan and Firth2016). Across like questions, respondents to our survey generally score somewhere between the prior MTurk and FINRA populations with a few exceptions. Our respondents understood the long-run relationship between risk and return much better, but did worse when attributing index fund performance to manager experience.
Table 2. Comparison of financial literacy question responses across three sample populations

FINRA column documents performance of professional advisors.
a Results taken from Fisch et al. (Reference Fisch, Wilkinson-Ryan and Firth2016), Table 3.
Figure 2 reports the bivariate relationships between financial literacy and our three dependent variable measures: financial market participation, preference for autonomy versus delegation in decision making, and preference for human, or robo advice. Below the average financial literacy score (6.9), increases in financial literacy are associated with declines in both the average number of types of accounts and variation surrounding that average. As financial literacy scores move above 6.9, the average number of types of accounts held increases while the variation surrounding that average continues to decline. In a series of binary probits we find evidence that this is largely driven by the propensity to hold brokerage and IRA accounts.

Figure 2. Financial literacy in the context of three dependent variables. Data: Authors’ Mechanical Turk data collection. Sample of 721 individuals interviewed in spring and summer of 2018.
The bivariate relationship between financial literacy and delegation is much more straightforward. Increases in financial literacy are correlated with greater preference for autonomy in decision-making. Finally, conditional on seeking advice, preferences for working with a human advisor rise and then fall, more modestly, as financial literacy improves.
Financial wellbeing is measured through reports on two items from a psychometrically validated battery from the CFPB regarding: (1) end of the month cash, and (2) concerns of depleting savings. Relating these two complementary measures to each other we find that the intensity of concern regarding savings sufficiency increases as the likelihood of having surplus funds each month declines, as would be expected. However, some reporting better cash positions also reported relatively high levels of concern.Footnote 31 In simple exploratory ordinary least squares regressions controlling for income, we find that those reporting less concern with savings adequacy, and those reporting a greater likelihood of leftover money at the end of the month have a greater number of types of accounts, on average.Footnote 32
We also collect data on respondents' use of checking accounts, homeownership, and defined benefit (DB) pensions. Eighty-eight percent have experience with a checking account, just under half with homeownership, and roughly one in five with a DB pension.
Figure 3 illustrates upward trends in financial literacy, trust, and financial market participation, by age. Mild declines in financial literacy scores among the oldest in our sample are consistent with findings in Agarwal et al. (Reference Agarwal, Driscoll, Gabaix and Laibson2009) who document a mild decline in mental function associated with financial management, beginning roughly in the mid-50s.

Figure 3. Financial literacy, trust, and number of types of accounts, by age. Data: Authors’ Mechanical Turk data collection. Sample of 721 individuals interviewed in spring and summer of 2018.
The continued increase in trust across all person-types by age is consistent with data from the GSS that document declines in trust over time. Finally, the observed decline in types of accounts for those aged 66 and older appears to reflect consolidation. Respondents in this age group are observed to be much more likely to hold DB claims, IRA and DC assets,Footnote 33 while being less likely to have holdings in college savings and brokerage-type accounts.
4. Regression analysis and results
Regressions target three related dependent variables. First, we consider the degree of financial market participation. Second, we consider the manner of market participation, in two ways – the preferred degree of delegation in portfolio allocation decisions and, preferences for working with a human advisor (as compared to a robo advisor).
4.1 Financial market participation
Focusing first on factors related to market participation, we find that the pattern of account holding in these data is skewed in a manner that suggests work with a negative binomial or a Poisson regression model. Figure 4 illustrates the distribution of this dependent variable. Given the high number of respondents who do not participate in any of the types of accounts with access to equity investments, the Poisson regression model is chosen for presented results.Footnote 34

Figure 4. Sample distribution of financial market participation. Data: Authors’ Mechanical Turk data collection. Sample of 721 individuals.
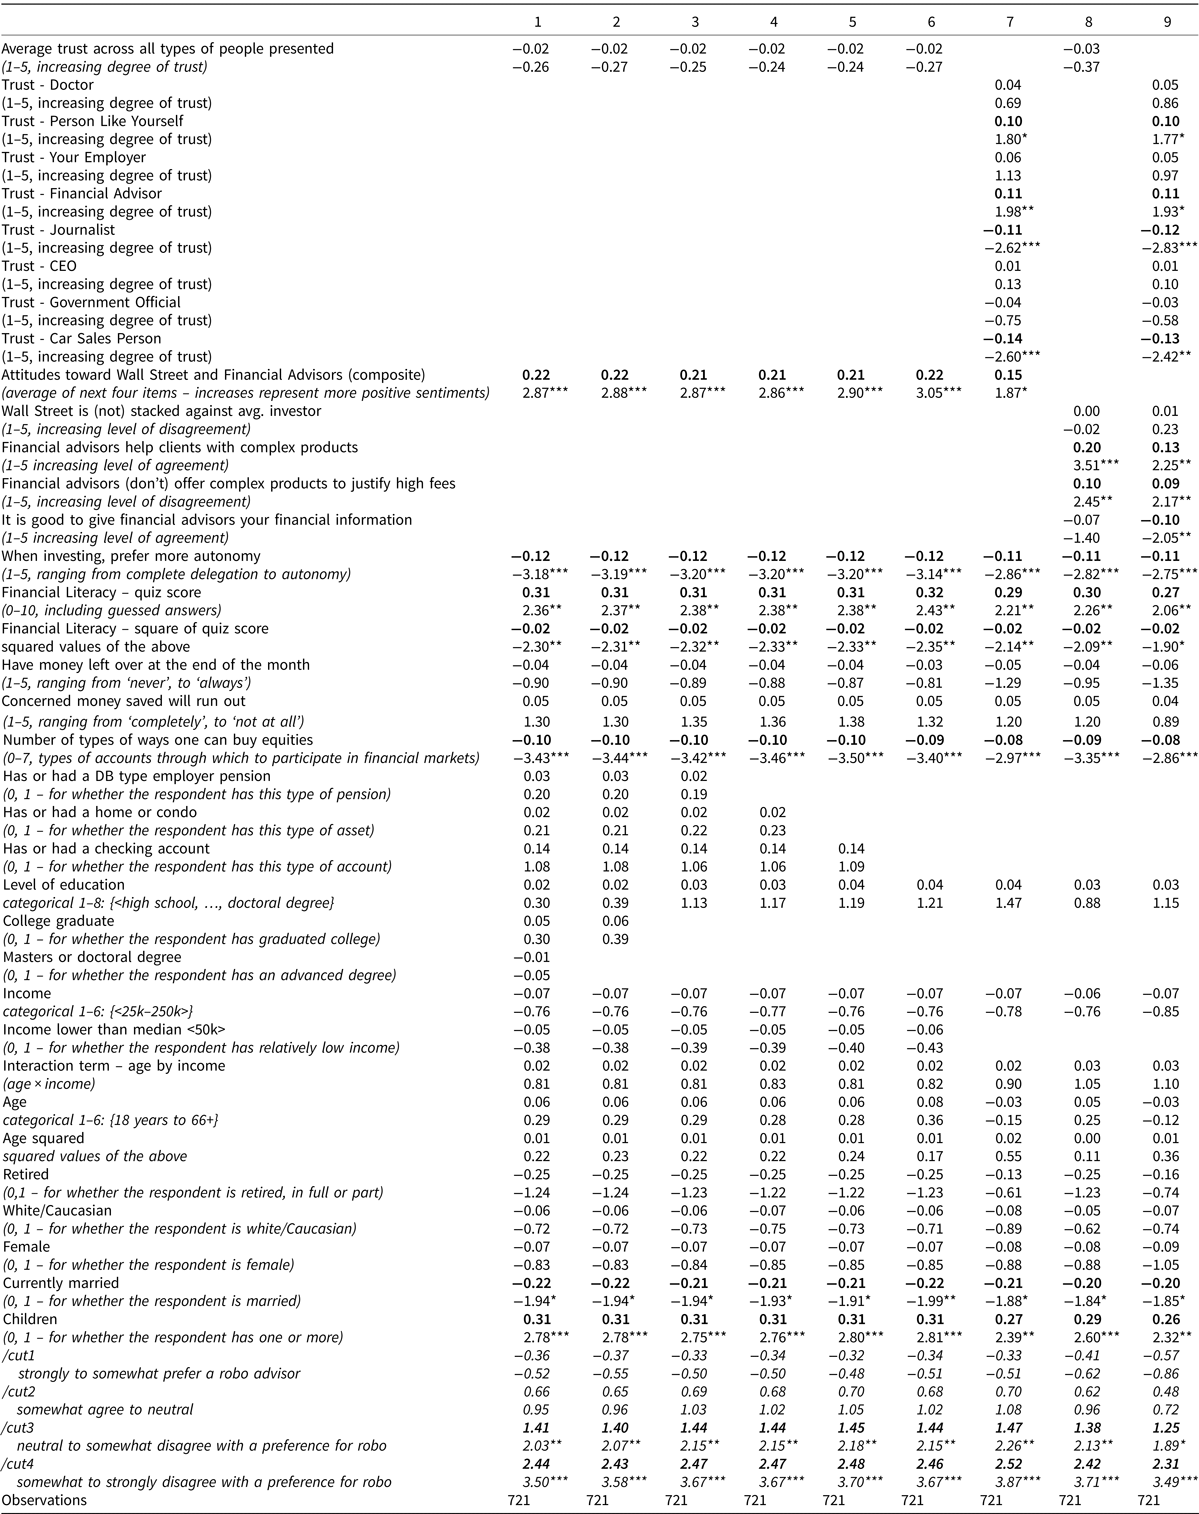
Working with the number of types of accounts in a Poisson regression setting, our composite measure of the average level of trust across all types of people (Table 3, top row) is consistently positively related to increases in the number of types of accounts held. When we distinguish among types of people, increased trust in the car sales person-type is identified as weakly more significant than other person-types. Recalling that this person-type has the lowest levels of trust, the finding suggests that broad trust is again important for financial market participation. Further support for this idea is found in binary probit regressions where increasing trust in the car sales person-type is correlated with an increased probability of holding (1) more than only a DC retirement account, and (2) a full-service brokerage account.Footnote 35 Binary probits offer evidence of a narrower form of trust as well – those holding only DC accounts demonstrate uniquely strong trust in employers.Footnote 36 We read this as evidence of an important role for employers in facilitating financial market participation among low-trust, low-participation people.
Table 3. Financial market participation, as measured by number of types of accounts

Robust z-statistics reported below point estimates; ***p < 0.01, **p < 0.05, *p < 0.1.
Note: Variation in specifications contrasts general trust and narrow trust measures, along with affording a sensitivity check of findings' robustness to insignificant regressors.
Turning to our composite measure of trust in the financial sector (Table 3, top of second panel), there is weak evidence that more positive sentiments toward Wall Street and financial advisors are associated with holding fewer types of accounts. When the composite score is deconstructed, the result appears driven by degree of disagreement with the survey question, ‘financial advisors offer complex products to justify high fees’. Although the coefficient is small, more positive attitudes regarding financial advisors are correlated with fewer types of accounts. This result is consistent with the idea that financial advisors may play a role in consolidating types of accounts. Supporting this idea, a pair of simple regressions across all seven types of accounts, and across just the four retirement accounts suggests that much of the decline is due to changes in retirement accounts.Footnote 37 A simple probit for discount brokerage accounts also carries a significant negative coefficient.Footnote 38
The degree of comfort for humans over robo advisors is further associated with a decrease in the number of types of accounts (Table 3, top of third panel). This finding is statistically stronger than those found in the second panel. The finding is consistent with the idea that preference for human advisors is associated with a narrower, more consolidated set of account-types. In supporting binary probit regressions, we find holdings of discount brokerage accounts, only brokerage accounts, or only retirement accounts to be driving this finding.Footnote 39
Given the curvilinear (u-shaped) relationship between financial literacy and market participation shown in Figure 2, we include a squared term in our regression specification for financial literacy. Both the linear and squared terms are strongly statistically significant (Table 3, third panel). Beginning with the linear term, we find that a four-point improvement in literacy score is associated with a decline of roughly one account type. The square term works in the opposite direction. At lower levels of financial literacy, the linear term dominates, past the average level of financial literacy (6.9), the positive squared term increasingly dominates, consistent with the relationship observed in Figure 2. When we deconstruct this dynamic using a battery of binary probits we find that two account type patterns are the likely drivers of the u-shaped result: first, patterns including both DC and IRA accounts and second, patterns including discount brokerage accounts.Footnote 40 In contrast, we observe that exclusive holding of only DC or only DC and IRA accounts diminishes in frequency as financial literacy improves, although these results are not statistically robust.
Figure 5 illustrates these patterns. The top panel of Figure 5 relates the estimated net impact of linear and squared financial literacy coefficients from binary probits for (1) both DC and IRA account types, and (2) discount brokerage accounts to the count data from the top panel of Figure 3.Footnote 41 The middle panel plots the marginal changes for these and compares them to the coefficients from Table 3 (column 9). Both the top and middle panels make it clear that (1) the marginal propensity to hold these types of accounts goes from negative to positive, (2) these dynamics help drive the broader relationship found in Table 3 regressions, and (3) propensities differ across financial products, with the discount brokerage dynamics being steepest. Finally, the bottom panel describes patterns in the data that while merely suggestive we find important to share; here we see that the propensity to hold only a DC or only {a DC and an IRA} appear to decline as financial literacy increases. In other words, the propensity to expand one's financial market participation beyond retirement accounts increases with financial literacy.

Figure 5. Dynamics for holding selected account types, controlling for financial literacy. Data: Authors’ Mechanical Turk data collection. Sample of 721 individuals.
Broadly, the three panels of Figure 5, and the binary probits upon which they are based suggest an evolution by which DC accounts introduce low trust low financial literacy individuals to financial market participation.Footnote 42 For example, we find employers, who benefit from higher than average trust, are an important conduit for financial market participation among those with low general levels of trust. Related to this we find that increases in trust for the least trusted type – car sales person are associated with increases in account types beyond the DC account. An important conduit appears to be IRAs which increase exposure to markets, advisors, and decision making.Footnote 43 However, trust is an important factor for transferring and preserving wealth from a DC account in an IRA. We find that use of IRAs among those who previously had a DC account is distinguished by higher trust in all types of people. We find this is driven by stronger trust in people like oneself, in financial advisors, in employers, and in the car sales person types.Footnote 44 These findings do not carry over for those who have never had DC accounts.Footnote 45 In sum, we find IRAs are an important financial steppingstone, and trust is important for stepping to the stone.
Although generally, as financial literacy and age increase, the likelihood of holding both DC and IRA, along with more types of accounts increases, we also find that different account types have product features that distinguish their use. For example, in binary probits we find that use of college savings accounts has no relationship with financial literacy and is strongly correlated with greater preferences for delegation, as well as with homeownership, higher income, being married, and more weakly correlated with education and being retired. Discount brokerage accounts also appear to work in ways more specific to product features, as noted earlier. In particular, age has an attenuating relationship with this type of account.Footnote 46 This result is consistent with findings when delegation is the dependent variable, a point we will return to. Finally, the use of full-service brokerage accounts is strongly positively correlated with trust in car sales people, education, being married, and being male. Differences in results for discount, full service and retirement type accounts are broadly consistent with Agnew et al. (Reference Agnew, Balduzzi and Sundén2003) and with Barber and Odean (Reference Barber and Odean2000).
Both CFPB measures of financial wellbeing are positively correlated with increased financial market participation. One, the measure related to having money at month's end, is statistically significant. This is consistent with budgeting and cashflow being important for financial market participation.Footnote 47
Experiences with other financial products, holding a checking account, owning a house, and DB pension participation are all strongly positively related to our financial market participation measure (Table 3, second panel, continued page).
The result for homeownership is strongest among these, across all specifications. Our result adds to findings in El-Attar and Poschke (Reference El- Attar and Poschke2011), who look at the intensive margin and find substitution across portfolio shares toward home equity for lower trust types. Here, we measure the extensive margin and find homeownership is associated with greater financial market participation. We interpret the two findings together to suggest that social engagement and trust in institutions are important for holding both types of assets (complementarity at the extensive margin) after which trust impacts portfolio allocations (substitution on the intensive margin). This pattern resonates with the extensive and intensive margin findings related to just equity markets in Guiso et al. (Reference Guiso, Sapienza and Zingales2008) and in Balloch et al. (Reference Balloch, Nicolae and Philip2015).
Education is also correlated with improved financial market participation, albeit with attenuation – observed by way of a negative coefficient for advanced degrees, or a squared term (Table 3, second panel, continued page). The coefficients associated with the squared term are small enough that the net effect of education is positive across the full measured scale.
Income and age are also positively related to increases in the number of account types. An interaction term, although not independently significant appears to impact the degree to which income is significant. This may be an artifact of the highly collinear relationship between age and income over working years. Although the coefficient for age is smaller than that for education, coefficients for age and the square of age follow the same pattern as did results for education.
Other demographic controls show that being white or female is associated with holding slightly fewer types of accounts on average. Being older, married, or retired is associated with holding a slightly greater number of types of accounts, although the statistical strength of results for marriage and retirement are more sensitive to other included regressors (Table 3, last panel).
4.2 Preferred degree of delegation
Having analyzed the relationship between trust, financial literacy, and financial market participation, the second set of regressions focuses on the degree of preference for delegating decision making.Footnote 48
Using our composite measure of trust in all types of people (top row, Table 4), we find, unsurprisingly, that delegation is positively related to trust. Breaking out this composite (subsequent rows of top panel), we find that increasing trust in ‘a person like yourself’ is correlated with a preference for greater autonomy, whereas increases in trust for employers and financial advisors is correlated with increased preference for delegating investment decisions. These results are consistent with the institutional landscape; both advisors and employers help steward investment decisions for many households. (In the case of employers, this takes place through the employers' role in sponsoring retirement plans.Footnote 49) Thus, these results suggest that people do employ trust and judgment when delegating financial decision-making tasks.
Table 4. Preferences over degree of delegation – (higher values signal a preference for more autonomy)

z-statistics in parentheses; ***p < 0.01, **p < 0.05, *p < 0.1
Note: Variation in specifications contrasts general trust and narrow trust measures, along with affording sensitivity checks of findings' robustness to insignificant regressors.
Consistent with findings for financial advisors in the top panel, positive attitudes toward financial markets and advisors are correlated with a greater affinity for delegation. In particular, agreement with the idea that financial advisors help clients contend with complex products is positively related to an increased preference for delegation (Table 4, second panel).
Comfort with robo advisors is also correlated with an increased preference for delegating decision making. This is consistent with the nature of robo products, as they embed a greater degree of delegation. This finding suggests people understand that aspect of the product type.
Working in the other direction, we find that increases in financial literacy and experience managing a checking account are each correlated with increased preferences for autonomy. The finding for financial literacy is consistent with the linear bivariate pattern seen in Figure 2 (middle panel). In some specifications increases in concern that money saved will run out is weakly related to preference for a more autonomous, hands-on approach.
Education and age are not correlated with preferences for delegation (Table 4, second panel). In some specifications, increases in income are associated with a greater preference for delegation. There is evidence that being white is associated with increased preference for delegation whereas being married is correlated with increased preference for autonomy.
Being retired is correlated with an increase in preference for delegation. A binary probit for discount brokerage holdings lends additional support to this idea older investors prefer delegation; we find a positive linear and an attenuating negative-squared relationship between age and holding a discount brokerage account. These findings suggest that concerns expressed in Fisch et al. (Reference Fisch, Lusardi and Hasler2020), Ryan et al. (Reference Ryan, Trumbull and Tufano2011), and Agarwal et al. (Reference Agarwal, Driscoll, Gabaix and Laibson2009) regarding executive function, aging, and cognitive decline are addressed through increased preference for delegation. Although Langevoort (Reference Langevoort1996) and Lee et al. (Reference Lee, Cummings and Martin2019) suggest principal agent concerns related to delegation, recent study by FINRA addressing older investor vulnerabilities, contribute to our positive interpretation of the value of delegation for this group (FINRA, 2020).
Finally, the bottom of Table 4 reports estimated step distances in our dependent variable, using the ordered probit regression estimator. Evidence here lends strong support for our choice of regression model; step distances differ meaningfully along the nodes of our delegation scale.
4.3 Preferences for robo or human advisors
The previous section investigated preferences for delegating, broadly construed. We now further consider preferences between delegating to human, as opposed to robo advisors.
Whether or how preferences for delegation relate to financial literacy and trust is not currently well understood. In fact, exposure to robo advice is still limited.Footnote 50 For this reason, we explicitly defined the term robo advisor when asking about it.Footnote 51 Results from the previous regression panel offered evidence that people understood using a robo advisor to be a form of delegation. Here, we measure which factors contribute to preferences for humans versus robo.
Beginning with our composite measure of trust-in-people (top row, Table 5), we find no meaningful result. However, this appears to be due to countervailing effects across types of people. Working with the separate person-types, we find differences in trust across types of people correspond to preferences for the form of delegation. Recall that trust in people like yourself (designed to be a proxy for one's self) was correlated with a preference for more autonomy. Now, when made to choose between human and robo delegation, the correlated preference is for human advice. Trust in financial advisors is also correlated with increased preference for human advisors. We note that these positive results are squarely targeted on proxies for the two actors in any investor–advisor relationship and do not extend to other highly trusted groups, such as doctors or employers. Increases in trust for journalists and car sales people, are correlated with preference for a robo advisor. These results do not have an obvious explanation; perhaps they relate to open-mindedness about new things and ideas.
Table 5. Degree of preference for a human rather than a robo advisor
z-statistics in parentheses; ***p < 0.01, **p < 0.05, *p < 0.1
Note: Variation in specifications contrasts general trust and narrow trust measures, along with affording sensitivity checks of findings' robustness to insignificant regressors.
Results for the composite measure of trust in financial markets and advisors show a strong correlation between positive attitudes and a preference for human advisors (Table 5, second panel). Breaking down that result into its components, agreement with the ‘advisors help’ question and disagreement with the ‘high fees’ question appear to be driving the affinity result. There is some statistically spottier evidence that those who think it good to give advisors financial information are more inclined to prefer autonomous robo advisor platforms, perhaps due to their reluctance to share such information with a human advisor.
Conditional on preferring more autonomy, one is more likely to prefer the robo platform to the human advisor when choosing a method for delegation (Table 5, top of panel three). Financial literacy is quite strongly correlated with preferences for either human or robo advisors. The positive, albeit attenuating, relationship is non-linear, and is again consistent with the bivariate evidence shown in Figure 3 (bottom panel). Starting at low levels of literacy, data show marginal increases in literacy are correlated with a greater preference for human advice, but the preference relationship attenuates mildly as financial literacy improves. These results are consistent with the idea that investors expect human advice to provide more coaching than robo advice.
Otherwise results show that preferences for robo advisors are correlated with holding fewer types of accounts (Table 5, last row, third panel). Control variables of note suggest those currently married are more inclined to prefer robo advisors, whereas those with children demonstrate a greater preference for human advisors.Footnote 52 The magnitude and statistical strength of children both outweigh the milder opposing preference for robo platforms among married respondents in our sample (Table 5, continued page). The result may reflect a perception that investing for education, tax, and estate planning and similar issues introduce complexities that are beyond the scope of some robo advisers. These last two results are consistent with preferences observed in the more generic analysis on delegation (Table 4).
As with Table 4, the bottom panel reports estimated step-distances using the ordered probit estimation method. Results are strongly non-linear across the preference scale. This affirms our choice of regression model for this dependent variable.
5. Conclusion
We find trust and financial literacy are both related to financial market participation in several ways. These findings generally support the idea that working with measures of both trust and financial literacy is important for explaining how, and the degree to which, people participate in financial markets to meet lifecycle wealth accumulation and preservation goals. As well, our study contributes to the understanding of how both more abstract and more narrowly construed measures of trust and financial market participation can each offer understanding of preferences. We find general measures help us see the positive linear relationship between trust and financial market participation, whereas narrow measures help us understand specific dynamics at play – in line with the Glaeser et al. (Reference Glaeser, Laibson, Scheinkman and Soutter2000) critique. For example, we find that degrees of trust of the least trusted type we ask about (car sales person) are highly correlated with the form and degree of financial market participation. At trust levels above neutral (positive trust) for the car sales person, financial market participation tends to be quite high by our measures, whereas below some minimum (distrust) for this type very little financial market participation is observed. Related, we find employers who, as a group benefit from high trust, are an important conduit for financial market participation among those with low general levels of trust. When looking at delegation preferences, we further find that a lack of relationship using a general measure of trust in people can obscure important countervailing effects across narrowly grouped types of people.
Additionally, our study highlights other patterns of preferences related to participation and delegation across measures of income, financial literacy, and age that contribute to understanding how people prefer to engage with financial markets in order to help meet their lifecycle goals. In particular, we find that financial literacy, unlike trust, does not display a positive linear relationship with financial market participation.
Both financial literacy and trust strongly affect the manner in which survey respondents prefer to engage with financial markets. Increasing levels of trust in others are positively related to the tendency to delegate decision making to professionals, whereas trust in people like oneself is correlated with a preference for more autonomous decision making. Those with higher levels of financial literacy also express greater preference for more autonomous decision making, however age and retirement attenuate this effect.
These findings, in combination, also highlight a potential for vulnerability. Because trust is correlated with financial participation and the tendency to delegate, financial professionals can potentially exploit investors through behaviors designed to cultivate trust. Our finding that those with the maximum number of types of accounts have the highest trust and lowest financial literacy may be important for future research to further explore.
When considering the difference between human and robo advisors, we find that increases in preferences for robo advice are related to increased preference for delegation suggesting that people understand robo products and use them in accordance with their interests. We also find that those with more trust in human financial advisors are more inclined to prefer humans. More financially literate people show comfort with greater levels of financial autonomy in decision making. When choosing a form of delegation, those with lower levels of financial literacy show a greater inclination for human rather than robo advice.
Broadly, the contribution of these findings can help researchers and practitioners understand how best to connect people with financial markets. Improvements in context and related communication may help people meet retirement and other lifecycle goals, and thereby contribute to financial well-being through increasing financial market participation. Our findings highlight that, because trust and financial literacy both impact market participation through separate mechanisms, regulators must be particularly sensitive to their differing roles.
Supplementary material
The supplementary material for this article can be found at https://doi.org/10.1017/S1474747221000226.
Acknowledgements
We thank Annamaria Lusardi, Andrea Hasler, John Driscoll, Sarah Holden, Peter Brady, Dan Schrass, Brian Scholl, Angela Hung, Melissa Knoll, Hector Ortiz, and participants at the Financial Literacy Seminar at the Global Financial Literacy Excellence Center (GFLEC) at the George Washington University School of Business and the University of Pennsylvania Law School Faculty Retreat for helpful comments and suggestions. This paper represents the authors’ views and not the views of the Investment Company Institute, its staff, or member firms.


