


1 Introduction
This paper investigates the prosodic properties of the informal register of conversational speech in Japanese, and how it compares to the formal register. Japanese was chosen as the language of study due to the large number of lexical and grammatical features used to mark both politeness and formality (Hinds Reference Hinds1976, Reference Hinds1978; Ide Reference Ide1982, Reference Ide1989; Makino Reference Makino1983, Cook Reference Cook1998, Sreetharan Reference Sreetharan2004), which made the process of assessing the level of formality in speech less subjective than in many other languages. In cross-linguistic terms (see e.g. Irvine Reference Irvine1979 for a general sociolinguistic discussion; Hinds Reference Hinds1976, Reference Hinds1978 for discussion specific to Japanese), formal speech can be defined as speech which is rigidly structured in terms of both what can be said and how it must be said, often occurs in formal social situations (such as meetings or presentations), and can be used to indicate the relative social positions of the speaker and listener in situations where the addressee has a higher social standing than the speaker (Irvine Reference Irvine1979: 776–779). These characteristics of formal speech do apply to Japanese, but different levels of formality in Japanese are also marked lexically in several ways, most notably verb endings, copular structure, and selection of formal vs. informal lemmas (Makino Reference Makino1983). This leads to several lexically – and at times grammatically – distinct speech registers corresponding to different levels of formality (Hinds Reference Hinds1976). (1) lists several short sentences in Japanese which illustrate the types of lexical and grammatical contrasts which mark formality in Japanese.
(1)


The examples in (1) show how e.g. the choice of verb form (1a), copular verb (1b), and the selection of formal vs. informal lemmas or the addition of sentence-final particles (1c) can change the perceived formality of the sentence. This is not an exhaustive list of examples of lexical or grammatical items which indicate level of formality in spoken Japanese, but they do illustrate how formality can be judged post-hoc in Japanese, which was important to the design of the current study and is discussed further in Section 3.2.
Previous examinations of speech register in terms of politeness or formality in Japanese tended to be from the point of view of pragmatics (Ide Reference Ide1982, Reference Ide1989; Makino Reference Makino1983, Matsumoto Reference Matsumoto1988, Pizziconi Reference Pizziconi2002), and these studies often focused more on contrasting politeness strategies in Japanese with those presented in more universal frameworks of politeness (Brown & Levinson Reference Brown and Levinson1987) than on any prosodic properties of different speech registers. For the purposes of this study these pragmatic approaches were of less interest than those that focus on the different acoustic aspects of politeness in Japanese, but one aspect of these pragmatic studies that is important to address is the relationship between politeness and formality in Japanese.
1.1 Formality and politeness in Japanese
Throughout this paper, and occasionally in the previous literature, the concepts of formality and politeness are often conflated, or treated as roughly equivalent in Japanese. It is not immediately obvious that it is justifiable to do so, as there is nothing in particular stopping formal speech from being either polite or impolite in many languages (Brown & Levinson Reference Brown, Levinson and Goody1978), and issues of formality are often ignored or minimized in general frameworks of politeness (such as Brown & Levinson Reference Brown and Levinson1987). However, pragmatic studies of politeness in Japanese (Ide Reference Ide1982, Reference Ide1989) have posited a close relationship between formal speech and polite speech in Japanese.
Although Ide (Reference Ide1982) was primarily concerned with women's speech in Japanese, that paper also proposed a series of rules which related the polite and formal registers of spoken Japanese. Specifically, one overriding rule was proposed: that speakers should ‘Be polite in a formal setting’ (Ide Reference Ide1982: 371). Notably, this rule applies only to conversational Japanese, and not strictly to written or scripted forms where informal and formal registers can sometimes combine in polite language. Ide (Reference Ide1982) proposes a relationship between formality and politeness wherein formal speech is always polite (based on the overriding rule), but informal speech can be either polite or ‘plain’ depending on context and lemma selection. Examples of this contrast in a sentence with otherwise identical meaning (after Ide Reference Ide1982) are given in (2).
(2)

The example in (2a) shows a typical formal, polite form of speech where formal forms of address (si rather than san for ‘Mr.’) and verb forms are used. (2b) shows an example of how some properties of the informal register (such as the sentence final particle yo) can enter polite speech, while (2c) shows a sentence which is entirely in the informal register, drops the polite form of address (san) and uses an informal form of the verb ‘to go’.
The critical observation from Ide (Reference Ide1982) is that in Japanese formality appears to be a property of politeness, and the two registers are closely related on a pragmatic level. Similarly, while speech containing aspects of the informal register is not always considered impolite, speech which contains entirely informal lemmas and grammatical forms will rarely if ever be considered polite (Ide Reference Ide1989: 226–229). Because of this close relationship between polite and formal speech in Japanese, previous work which focused primarily on politeness rather than formality is still highly relevant to the current study. Although the relationship between informal speech and politeness is slightly more nebulous, it is reasonable to expect similar results when studying the prosodic properties of formal speech as were seen when polite speech was investigated. Furthermore, because informal speech seems to span different politeness categories, it is possible that analysis of the prosody of informal speech will produce a broad range of values that overlaps somewhat with the data observed for formal/polite speech.
1.2 Studies of the prosodic properties of formality in Japanese
Previous examinations of formal/polite speech in Japanese (Loveday Reference Loveday1981, Ohara Reference Ohara, Pavlenko, Brackledge, Piller and Teutsch-Dwyer2001, Tsuji Reference Tsuji2004) have indicated that polite speech in Japanese is characterized by an increased f 0 as compared to an overall mean for both polite and non-polite speech, as predicted both by Brown & Levinson's (Reference Brown and Levinson1987: 267–268) proposal of increased pitch as a universal indicator of increased politeness, and Ohala and Gussenhoven's frequency code (Ohala Reference Ohala1984, Gussenhoven Reference Gussenhoven2002) which posits higher f 0 as a universal linguistic indicator of more formal and deferential speech. These studies largely focused on women's polite speech, and eschewed any attempt to examine informal speech alongside the formal examples, but there have been a few attempts at doing so.
Two previous studies of relevance here are Ofuka et al. (Reference Ofuka, McKeown, Waterman and Roach2000), an acoustic experiment regarding the prosodic cues to different levels of politeness in Japanese, and Ito (Reference Ito2002), a study of the effects of suprasegmentals (in this case f 0 and speech rate) on the perception of politeness in Japanese. Neither study is an exact parallel to the current one as both used elicited rather than conversational speech, but they can at least provide some initial insights into the possible prosodic properties of formality in Japanese.
Ofuka et al. (Reference Ofuka, McKeown, Waterman and Roach2000) involved eliciting a series of (read) utterances from speakers in a controlled laboratory setting, asking the subjects to deliver the utterances in both a ‘formal’ and then a ‘casual’ manner, and then using those recordings in a perceptual study to test the effects of different acoustic cues on a listener's perception of an utterance's politeness. The study was one of the first directly addressing the acoustic properties of casual versus formal speech, and the target features examined were narrow – only the speech rate of the final mora and the direction of f 0 movement (i.e. rise or fall in pitch) in the final mora were investigated.
The results of the study (Ofuka et al. Reference Ofuka, McKeown, Waterman and Roach2000: 213–215) were that – as foreshadowed by another study of the perception of politeness in Japanese, Ogino & Hong (Reference Ogino, Hong and Kunihiro1992) – both the direction of final f 0 movement and the speech rate of the final mora were used by listeners as indicators of the intended politeness of an utterance, where higher final f 0 and articulation rate indicated a more ‘casual’ utterance. From a production standpoint the results were somewhat ambiguous – though the majority of speakers had a higher f 0 in the less polite utterances, one showed the opposite pattern. Speech rate, however, was consistently higher in the less polite utterances. These findings are relevant to the current study, in that the possibility that f 0 and speech rate are both related to an utterance's level of formality was one of the hypotheses that this study sought to test (see Section 2 for further discussion). However, there are some aspects of Ofuka et al. (Reference Ofuka, McKeown, Waterman and Roach2000) that prevented it from being more of a foundation for the current study – firstly, only two sentences were tested, and both were questions, leading to a rather semantically narrow set of stimuli. Furthermore, the fact that the recorded stimuli were all read rather than spontaneous speech, and were also collected in a lab means that the current study analyzed a very different sort of speech stimuli, which may lead to contrasting results.
Ito (Reference Ito2002) differs from Ofuka et al. (Reference Ofuka, McKeown, Waterman and Roach2000) in several ways. Firstly, it made use of a speech corpus elicited at Chiba university (Aono et al. Reference Aono, Ichikawa, Koiso, Sato, Naka, Tutiya and Yagi1994) using the HCRC map task designed at the University of Edinburgh (Anderson et al. Reference Anderson, Bader, Bard, Boyle, Doherty, Garrod and Sotillo1991) wherein speakers give directions to different points on a map to listeners of varying social relations to the speaker, hopefully eliciting utterances of varying levels of politeness based on the relative social standings of the conversational partners. Although these recordings were still made based on an artificial task, they should be far more natural than the read speech used in Ofuka et al. (Reference Ofuka, McKeown, Waterman and Roach2000). The results of Ito (Reference Ito2002) however were somewhat inconsistent. The study examined the overall f 0 and articulation rates of two speakers in the corpus, and these two speakers appeared to use different strategies to indicate level of formality. While one speaker appeared to increase both f 0 and articulation rate when speaking to a listener of lower status, the other speaker did not follow these patterns. Additionally, a perception experiment was conducted based on the speech of the speaker from the corpus who showed changes in f 0 and articulation rate, but listeners were found to be unable to consistently predict the level of formality based on the acoustic cues found in a single word (in this case /wakaɻimaʃita/ ‘I understand’). Ito (Reference Ito2002) did nonetheless indicate a few points of relevance for the current study. One was that it does appear possible that speakers use increased f 0 and articulation rate to indicate formality, but also that speakers may not be entirely consistent, and that in general listeners may have difficulty using isolated cues to determine formality.
1.3 Studies of the phonetic properties of formality in other languages
There are several studies of the relationship between prosody and politeness in languages other than Japanese, such as Spanish, Mandarin, Korean, and English (see e.g. Álvarez & Blondet Reference Álvarez, Blondet, Herrera and Butragueño2003 for Venezuelan Spanish, Lin, Kwock-Ping & Fon Reference Lin, Kwock-Ping and Fon2006 for Mandarin, Hübscher, Borràs-Comes & Prieto Reference Hübscher, Borràs-Comes and Prieto2017 for Catalan, and Hidalgo Navarro & Cabedo Nebot, Reference Hidalgo Navarro and Nebot2014 for a further overview). These previous studies indicated a number of possible acoustic properties of polite speech in languages other than Japanese, such as increased f 0 height and variability in Venezuelan Spanish interrogatives (Álvarez & Blondet Reference Álvarez, Blondet, Herrera and Butragueño2003), and longer phrase-final durations in Mandarin (Lin et al. Reference Lin, Kwock-Ping and Fon2006). Of these, the studies which are most likely to be relevant to the current study are Winter & Grawunder (Reference Winter and Grawunder2012) – which investigated the relationship between acoustic factors and formality in Korean – and Hübscher et al. (Reference Hübscher, Borràs-Comes and Prieto2017), which was a similar study investigating Catalan Spanish. The reasons for their relevance are that, firstly, they were concerned with formality rather than strictly with politeness, which mirrored the current study. As the relationship between formality and politeness in other languages is not necessarily as clear as it is in Japanese, this is a critical point. Secondly, Winter & Grawunder (Reference Winter and Grawunder2012) appeared particularly relevant as it has been observed that there are some similarities in prosodic structure between Korean and Japanese, particularly at the level of the intonational and accentual phrases (see Venditti, Jun & Beckman Reference Venditti, Jun, Beckman, Morgan and Demuth2014, and various chapters in Kubozono Reference Kubozono2015), and so making comparisons between the prosody of the two languages is not entirely far-fetched.
Winter & Grawunder (Reference Winter and Grawunder2012) collected speech of different levels of formality via a role-playing task, where subjects were asked to either leave a message on a cell phone voice mail, or to make a direct request of someone in person. Both scenarios were used to produce examples of formal and informal speech. The acoustic properties – including mean, range, and SD of f 0 and intensity, harmonics, articulation rate, pause count, filler count, and breath intakes – of the different levels of formality were analyzed and compared using mixed effects regression models. Significant main effects were found for mean, SD, and range of f 0 (p < .01 for all), articulation rate (p < .05), and filler count (p < .001), wherein all were significantly higher in informal than in formal speech. Following this 2012 study of Korean, Lucien Brown, Bodo Winter, Kaori Idemaru and Sven Grawunder (Brown et al. Reference Brown, Winter, Idemaru and Grawunder2014) also conducted a perception experiment which tested the salience of the prosodic variables analyzed in Winter & Grawunder (Reference Winter and Grawunder2012) to Korean and English listeners’ perception of the honorific speech register in Korean. While their speech stimuli were read rather than spontaneous, Brown et al. (Reference Brown, Winter, Idemaru and Grawunder2014) did find that both Korean and, to a lesser extent, English speaking listeners were able to use prosodic cues to correctly identify speech to a status superior or inferior at a rate greater than chance. This result implies that certain prosodic properties of different levels of politeness/formality could be present cross-linguistically.
Hübscher et al. (Reference Hübscher, Borràs-Comes and Prieto2017), a study of Catalan Spanish, structured similarly to Winter & Grawunder (Reference Winter and Grawunder2012) – excepting that all speech data was formulated as requests – also found significantly higher mean f 0 in casual speech (p < .001). This result further contrasted the prediction of the frequency code (Ohala Reference Ohala1984, Gussenhoven Reference Gussenhoven2002) which states that higher f 0 should correlate with formal and deferential speech. Hübscher et al. (Reference Hübscher, Borràs-Comes and Prieto2017) also found that there was a higher pause rate, lower intensity, and slower speech rate in formal speech, which they termed ‘prosodic mitigation’. The similarity of these results to Winter & Grawunder (Reference Winter and Grawunder2012) indicated that this strategy of prosodic mitigation is used in multiple languages in the expression of formality, and that the relevant variables were worth investigating in the current study.
Although the results of Winter & Grawunder (Reference Winter and Grawunder2012) and Brown et al. (Reference Brown, Winter, Idemaru and Grawunder2014) were not necessarily enough by themselves to hypothesize that the same results would be seen in the current study, the observed similarity between the prosody of the two languages allowed them to serve as a point of reference. The similar results of Hübscher et al. (Reference Hübscher, Borràs-Comes and Prieto2017) do suggest some possible cross-linguistic patterns in the relationship between prosody and formality in speech, and the fact that many aspects of f 0 (mean, SD, and range) and intensity (SD and range) appeared to co-vary significantly with changes in formality in both Korean and Catalan indicated that it was worth investigating the relationship between these variables and formality in Japanese to a similar (or greater) level of depth. Additionally, the fact that many of the tested phonetic parameters were higher in informal speech was of interest, as this result could help better inform the hypotheses of the current study as they related to the expected relationship between prosody and formality. Comparing the results of this study of Japanese to Winter & Grawunder (Reference Winter and Grawunder2012) and Hübscher et al. (Reference Hübscher, Borràs-Comes and Prieto2017) can also provide some insight as to the possible presence of some of these phonetic cues to formality across multiple languages, as if the results are very similar it could indicate that there are cross-linguistic tendencies in how prosody relates to speech register.
2 Research questions and hypotheses
This study investigated two related research questions:
(i) Do speakers of Japanese make use of changes in prosody to help communicate their intended level of formality in conversation? and, if that was the case,
(ii) What specific differences in the prosody are used by speakers to distinguish different levels of formality?
These questions have been partially addressed by a pilot studyFootnote 1 (Sherr-Ziarko Reference Sherr-Ziarko2016) which found a significant relationship of mean f 0 and utterance duration to formality. The current study investigated questions (i) and (ii) using a corpus of conversational Japanese speech gathered in one-on-one interviews, and the formality of each utterance was judged based on a consistent set of criteria, discussed further in Section 3.2.
The results of the pilot study, together with the results from the previous cross-linguistic literature, led to two hypotheses: firstly, that speakers do use changes in prosody to express different levels of formality in speech, and secondly that differences in properties (including mean, SD, and range) of f 0, articulation rate, intensity, and pause frequency would co-vary significantly with the level of formality in speech. Each of these variables was expected to be higher in informal speech, excepting pause frequency which was predicted to be higher in formal speech. The first hypothesis has already seen some support from the results of the pilot study, and previous studies showing a relationship between prosody and politeness in Japanese (Ofuka et al. Reference Ofuka, McKeown, Waterman and Roach2000, Ito Reference Ito2002). This study tested the hypothesized relationship between prosody and formality on a much larger scale, and critically in conversational rather than read or elicited speech, hopefully leading to more robust results. The second hypothesis was based largely on the cross-linguistic results from Korean found in Winter & Grawunder (Reference Winter and Grawunder2012), as that study was the most methodologically similar to the current one, although the methodology for obtaining speech data from different levels of formality varied (see Section 3 for further discussion).
3 Data collection and annotation
As the goal of the experiment was primarily to examine the properties of conversational Japanese, the decision was made to conduct a corpus-based experiment. Although any speech recorded outside of natural conversation was likely to fall somewhat short of the ideal level of naturalness for this study, spontaneous speech gathered for a corpus was likely to come much closer to the desired speech registers than speech obtained in a lab. Additionally, speech corpus data has in the past produced significant results in phonetic studies where similar lab-based experiments did not (such as Gahl Reference Gahl2008 vs. Guion Reference Guion1995).
Initial investigations into possible corpora of spoken Japanese revealed two potentially viable sources: the Corpus of Spontaneous Japanese (CSJ; Maekawa Reference Maekawa2003), and the Chiba University three-way conversation corpus (Den & Enomoto Reference Den, Enomoto and Nishida2007). Both corpora were gathered in Japan, and contain entirely spontaneous speech. The CSJ contains mainly monologues, and presentations, while the Chiba corpus contains short conversations across three participants. Both corpora are very well annotated, with detailed segment meta-data and pitch tracking information, but both also have shortcomings.
The main shortcoming of the CSJ for this study was that it although it contains millions of words, it contained very little speech that could be considered informal, and essentially none that could be considered conversational. The Chiba corpus on the other hand contained entirely conversational speech of varying levels of formality, but unfortunately only consisted of roughly 30 minutes of recordings, which was not sufficient for the scope of this study. Because of the shortcomings of the available corpora, and in order to have greater control over the collection methods and content of the data, the decision was made to create a new small corpus of conversational Japanese speech.
3.1 Data collection methodology
The speech data for this study was collected at the NINJAL institute in Tachikawa-shi, Japan via one-on-one interviews between the experimenter and subjects. The interviewer was a non-native speaker of Japanese with a high-level of proficiency, and subjects were 10 native speakers of Japanese aged 31–45 years (five male, five female). The age of subjects was kept below 50 years in order to minimize any potential influence of the effects of age on f 0 (Harrington, Palethorpe & Watson Reference Harrington, Palethorpe and Watson2007), and all subjects were speakers of the Tokyo dialect of Japanese (born and raised in the Tokyo area up to age 18 years) in order to reduce any possible effects on f 0 from different dialects (Kubozono Reference Kubozono2012). Interviews were conducted in a lounge setting rather than a recording booth or lab in order to encourage a more natural, conversational style of speech. Recordings were single-channel mono, made at 48 kHz, 16 bit PCM and used a clip-on microphone.
The format of the interviews was similar to a sociolinguistic interview (Labov Reference Labov1972) but with less control of the topics discussed, and each subject was recorded for ~30 minutes. All interviews began with self-introductions from both the interviewer and the subject, which were generally quite formal, and then proceeded naturally to other topics as they arose, with the interviewer gradually modulating their speech register to a more informal level to encourage the subject to follow. In general, this resulted in a pattern where the first five minutes of the interview consisted mainly of formal speech, minutes 5–10 consisted of a mix of formal and informal speech, with subjects sometimes code-switching within utterances, and the remainder of the interview consisting of mostly informal speech. Although the topics discussed in the interviews were not entirely consistent from subject-to-subject, certain topics were consistently touched upon, and are listed in the appendix.
In total this resulted in ~5 hours of recorded speech for analysis.
3.2 Data annotation
To ensure analysis of the correct portions of the recorded data, the extended recordings were annotated as follows. As the target of the experiment was only utterances by the subjects, these targets had to be separated from the interviewer's speech. This was accomplished by manually labeling the intervals of the subjects' utterances in a Praat text grid. Interval labels were created for each of the subject's utterances, with the following exceptions:
• Isolated filler interjections (such as /eː/ or /aː/) were not included.
• Isolated laughter was not included, unless it occurred clause-internally.
The interval boundaries were placed either at clause boundaries in the case of uninterrupted utterances, or at turn-taking boundaries (the boundary between the end of the first speaker's turn and the start of the second speaker's) in the case of back-and-forth conversation containing fragments.
The number of lexical moras within each clause or fragment was manually counted in order to allow the calculation of articulation rate data. Pauses in speech were not included in the mora count, but were instead counted separately to allow for the analysis of pause frequency in different levels of formality.
The speech within each labeled interval was judged to be either formal, or informal. This judgment was initially made by the experimenter, and once all intervals were assessed, 16 linguistically naive native speakers of Tokyo Japanese (six male, 10 female, aged 20–31 years) were later asked to judge the formality of randomly selected intervals in order to confirm the judgments. In any cases where there were differences in judgments – which occurred in roughly 2.5% of intervals – the assessment of the native speaker was followed. Although any judgment of the level of formality of a given utterance is to some degree in the eye of the beholder, because the determination of levels of formality was very important to this study a consistent set of criteria to judge formality was established (Table 1).
Table 1 Criteria used in determining utterance formality.

The criteria in Table 1 were determined largely by previous examinations of lexical items and phonological forms indexical of different registers of formality in Japanese (Hinds Reference Hinds1976, Ide Reference Ide1982, Makino Reference Makino1983, Cook Reference Cook1998, Okamoto Reference Okamoto1999) and of observational evidence of spoken Japanese. Once all the speech data was labeled, it was then automatically segmented into separate .wav files (one per labeled interval). f 0 and intensity values were calculated for each .wav file at 10ms intervals using a Praat script, and these values were then used to calculate the means, SDs, and ranges for each recording. Articulation rate and pause frequency data was calculated using bash scripts. In total, this resulted in 2,497 utterances, of which 418 were formal, and 2,079 were informal. There were 1,230 utterances by female subjects and 1,267 by male subjects.
4 f 0 measurement and correction
As the measurement and analysis of f 0 was central to this study, it was important to be certain that the f 0 measurements were as accurate as possible. However, the initial measurements from Praat were not entirely reliable, due to pitch peak (and trough) estimation errors (i.e. pitch doubling or halving) (Keelan, Lai & Zechner Reference Keelan, Lai and Zechner2010), as can be seen in Figure 1. To help overcome this problem, an automated Matlab script to diagnose and fix pitch-doubling errors in f 0 vectors was developed.

Figure 1 An f 0 vector showing a pitch-doubling error. The x-axis shows points at 10 ms intervals, while the y-axis shows f 0 values at each point in Hz.
In order to ensure that f 0 was accurately analyzed, the following method was used to correct pitch-doubling errors. Similar to the method used by Xu (Reference Xu2013), pitch peak/trough estimation errors were diagnosed and corrected by examining the absolute value of the first differences of the vector, and searching for changes that fall outside of an expected range of tolerance. After calculating the first differences and testing a Matlab script which attempted to diagnose pitch-tracking errors, and testing it on a number of f 0 vectors, a threshold of three times the mean of the absolute value (i.e. with positive and negative differences treated the same) of the first differences was arrived at. Because the script checked the absolute value of the first differences rather than only looking for an increase or decrease, the script served to diagnose pitch halving and well as doubling errors.
After testing for errors, the vector was then corrected by adjusting the values between two changes in the slope of the vector outside of the set level of tolerance by the difference between the f 0 value at the peak of the error and the point immediately after the end of the error. The script will avoid correcting extremely long errors (defined as lasting for more than 15% of the total length of the vector); this is because most of these sudden drops or increases in f 0 followed by an extended portion of the vector that appears normal generally result from the fact that undefined f 0 values given by the Praat pitch tracking are ignored, and therefore any gaps in voicing are not represented in the vector. This leads to there being apparently sudden changes in the f 0 vector which are actually correct. Figure 2 shows an example of a f 0 vector which has been corrected by the Matlab script. With those fixed f 0 vectors created, it was possible to move on to the next step of analyzing the data.
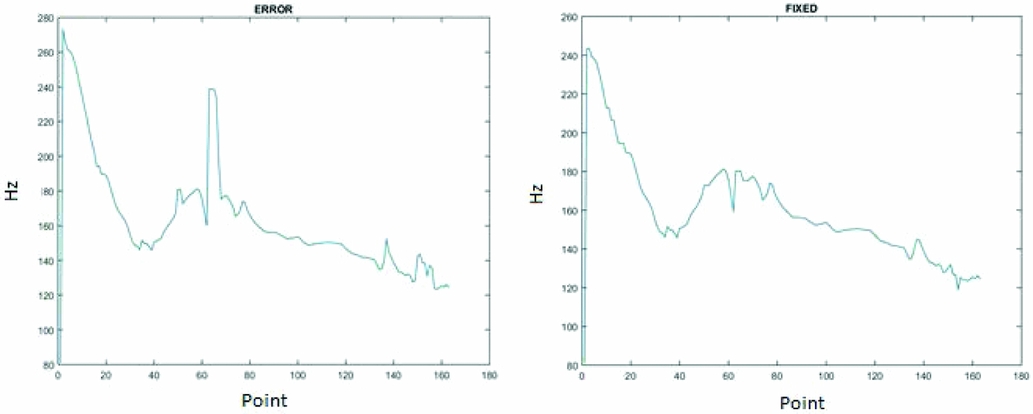
Figure 2 f 0 vectors with a pitch-doubling error (on the left) and after automatic correction (on the right).
5 Data analysis
The variables analyzed in this study were the mean, SD, and range of both f 0, and intensity, as well as articulation rate, and pause frequency. f 0 range was calculated as equal tempered semitones relative to the minimum and maximum pitch (12 * log2(maxf0/minf0)), and intensity range was calculated as the difference between the minimum and maximum dB of the recording. As discussed in Section 2, the hypothesis the study tested is that f 0, intensity, and articulation rate are significantly higher in informal speech than in formal speech, while pause frequency is higher in formal speech. Table 2 shows a summary of all these variables broken down by level of formality.
Table 2 Descriptive statistics of all the variables examined in this study. f 0 range is measured in equal tempered semitones (cents (c)), articulation rate in moras per second (m/s) and pause frequency measures the number of pauses per utterance.

5.1 Statistical methods
The statistical analyses in this study were conducted using linear mixed effects regression models (Bates et al., Reference Bates, Maechler, Bolker and Walker2015) in R (R Core Team, Reference Core Team2017), as the variables listed in Table 2 lack independence within subjects. The models used (except where otherwise noted) are constructed as shown in (3):
(3) [dependent variable] ~ formality + gender + formality * gender + (1 + formality|subject)
This model can be read as follows: a dependent variable as a function of the fixed factors of formality and gender, as well as the possible interaction of formality and gender. It also includes random intercepts and slopes (of formality) for each individual speaker in the corpus. Full results of all the modelling analyses described in this section are found in Table 3 – results reported include slope estimates and standard errors for the main effect of formality, p-values (if significant) for the main effect, and t-values for the fixed effects in the models.
Table 3 Summary of modeling results for the variables in this chapter. Estimate is an estimate of the overall slope of the change in the linear model based on the fixed factor, with the variance caused by the random effects taken into account. Values for interaction terms are not reported as none were significant according to model comparison.

5.2 Articulation rate
It is immediately apparent from Table 2 that the mean articulation rate of informal speech was quite a bit higher than that of formal speech. Model comparison using a likelihood-ratio test of a linear mixed-effects model in R, as in (3), showed a significant relationship between articulation rate and formality, with no significant effect of gender, or interaction between formality and gender. (χ2(2) = 23.649, p < .001, rate changes by −1.37 moras/second ± 0.2 moras/second standard error in formal speech.)
This initial finding agreed with the results of the pilot study, and of previous acoustic studies of Japanese informal speech (Ofuka et al. Reference Ofuka, McKeown, Waterman and Roach2000, Ito Reference Ito2002) as well as the results of Winter & Grawunder (Reference Winter and Grawunder2012) for Korean. However, there was one caveat to this seemingly straightforward analysis that must be mentioned. Figure 3 shows a density plot of articulation rates in both formal and informal speech.

Figure 3 Density plot of articulation rate in informal and formal speech.
The basic shape of this plot is as hypothesized – the mean articulation rate for informal speech was higher, and values were clustered more towards the higher end of the curve. However, the fact that formal speech was more widely distributed (as evidenced by the higher SD in Table 2), and reached a lower minimum raised the question of whether something else was causing this wider distribution. Specifically, if pause frequency is, as hypothesized, higher in formal speech, then it is possible that it was acting as a confound. To test this, both pause frequency and the interaction of pause frequency × formality were added to the mixed effects model to test if formality remained a significant factor.
Although analysis of such a model does show a significant relationship between pause frequency and articulation rate (i.e. more or less pausing correlates with differences in articulation rate), the interaction term was non-significant.
5.3 Pause frequency
The analysis of articulation rate, as well as the mean values in Table 2 showed some initial evidence that subjects paused more frequently in formal speech. Modelling analysis shows a significant relationship between pause frequency and formality, with no significant effect of gender or the interaction term. (χ2(2) = 19.03, p < .001, pause frequency changes by + .48 pauses/utterance ± .08 standard error in formal speech.) Based on the analysis of articulation rate in Section 5.2 it did not appear that the two variables were confounded, and so the results appeared to show that subjects paused more frequently in formal speech, following Winter & Grawunder (Reference Winter and Grawunder2012) and Hübscher et al. (Reference Hübscher, Borràs-Comes and Prieto2017).
5.4 Intensity
Intensity was calculated for each recording at 10 ms intervals using Praat, and the mean, SD, and range of intensity was calculated from each of those vectors. Intensity was measured in dB SPL (a lognormal scale of power) and was not further scaled as any incidental changes in intensity were of interest to the study. Intensity range was calculated as the difference between the maximum and minimum intensities in the recording. While the results of the analyses of articulation rate and pause frequency largely corresponded to the results from Winter & Grawunder (Reference Winter and Grawunder2012) for Korean, the results in Japanese for variables related to intensity were somewhat different. Both mean intensity (χ2(2) = 19.234, p < .001, intensity changes by –2.2 dB ± 0.3 dB standard error in formal speech) and intensity range (χ2(2) = 16.417, p < .001, intensity range changes by –1.8 dB ± 0.3 dB standard error in formal speech) show a significant relationship with formality, while there is no significant effect of SD. There are no significant interactions between gender and any aspect of intensity.
5.5 f 0
f 0 was calculated at 10 ms intervals of each recording in Praat, and then corrected via the Matlab script described in Section 4. f 0 range was calculated as equal tempered semi-tones (i.e. 1/12th of an octave) relative to the maximum and minimum pitch of each recording. Based on the values in Table 2 f 0 also appeared to be a potentially significant cue to the formal vs. informal contrast, but there were some issues with the data that are important to note. Figure 4 shows a density plot of mean f 0 for each gender.

Figure 4 Density plot of mean f 0 for male and female speakers.
It is readily apparent that f 0 is not normally distributed, particularly for male speakers, who appear to have two separate peaks of density. Although it is possible that this data would still be interpretable in a linear mixed effects model with the inclusion of sufficient random factors to normalize the residuals (Bates et al. Reference Bates, Maechler, Bolker and Walker2015), it is in general better statistical practice to either normalize the data, or (in the case of binary data as in the current study) make use of generalized linear mixed effects models (see Bolker et al. Reference Bolker, Brooks, Clark, Geange, Poulsen, Stevens and White2009 for some discussion). Although there is disagreement surrounding the appropriateness of a strictly logarithmic scale for f 0 as it relates to human pitch perception (see e.g. Zwicker Reference Zwicker1961, Moore & Glasberg Reference Moore and Glasberg1983, Nolan Reference Nolan2003), because log transforming f 0 has some experimental basis (Fujisaki & Hirose Reference Fujisaki and Hirose1984, Henton Reference Henton1989, Nolan Reference Nolan2003) and is statistically motivated in this case, the mean f 0 values were log10 transformed for analysis. This was not an issue for the SD of f 0, or for f 0 range as both of those variables were normally distributed (and range was already on a logarithmic scale).
The results of the analysis showed a significant effect of mean f 0 (χ2(2) = 35.49, p < .001, estimate –0.04 ± 0.03), SD of f 0 (χ2(1) = 23.04, p < .001, SD changes by –9.09 Hz ± 1.24 Hz standard error in formal speech), and f 0 range (χ2(2) = 12.18, p < .001, f 0 range changes by –2.01 semitones ± 0.57 semitones standard error in formal speech). There were no significant interaction terms with gender.
While the results described in this section provided strong statistical support for the hypotheses described in Section 2, it is still possible to provide further depth to the analysis of f 0, and particularly f 0 range. In order to do so, a functional data analysis was adopted.
6 Functional data analysis
Functional data analysis refers to a methodology whereby continuous functions (in this case orthogonal polynomials) are fitted to vectors, and the coefficients of the fitted polynomials are related to linguistic variables (Grabe et al. Reference Grabe, Kochanski and Coleman2007, Ramsay Reference Ramsay2006). This was done by using the polyfit function in Matlab to initially fit cubic functions to f 0 vectors.
First, the pitch tracking data which had been fixed by the script described in Section 4 was taken, and the vectors were normalized using the operation in (4), and then normalized for time (where y is the original f 0 vector, and yn is the normalized vector, centered on 0).
(4)
$yn = \frac{y}{{mean( y ) - 1}}$

In order to further determine the goodness of fit of the function, the sum of the squared differences between the fitted function and the normalized data vector was calculated using the operation in (5) (where yf is the fitted function).
(5)
$d = \frac{{\mathop \sum \nolimits_ {{( {yf - yn} )}^2}}}{{length( {yn} )}}$

However, an examination of how the resulting functions fitted to some of the longer utterances revealed an issue with this initial approach. When a cubic function was fitted to each utterance, the mean d – as in (5) – was 0.097. For reference, Figure 5 shows an example of a fitted cubic function for a random utterance from the data with a d equaling approximately 0.1. As can be seen clearly from Figure 5, with a d of 0.1, the fitted function was essentially meaningless, fitting to almost no part of the original vector. An average difference of this magnitude meant that there was little chance of obtaining any meaningful data.

Figure 5 An example of a fitted function (indicated by the dashed line) with a d of 0.1.
Closer examination of the fitted functions compared to the f 0 contours made it apparent that a d of around 0.02–0.04 was ideal for the function to fit accurately and smooth out some of the jagged movement of the vector not fixed by the script described in Section 4. Figure 6 shows an example of such a function.
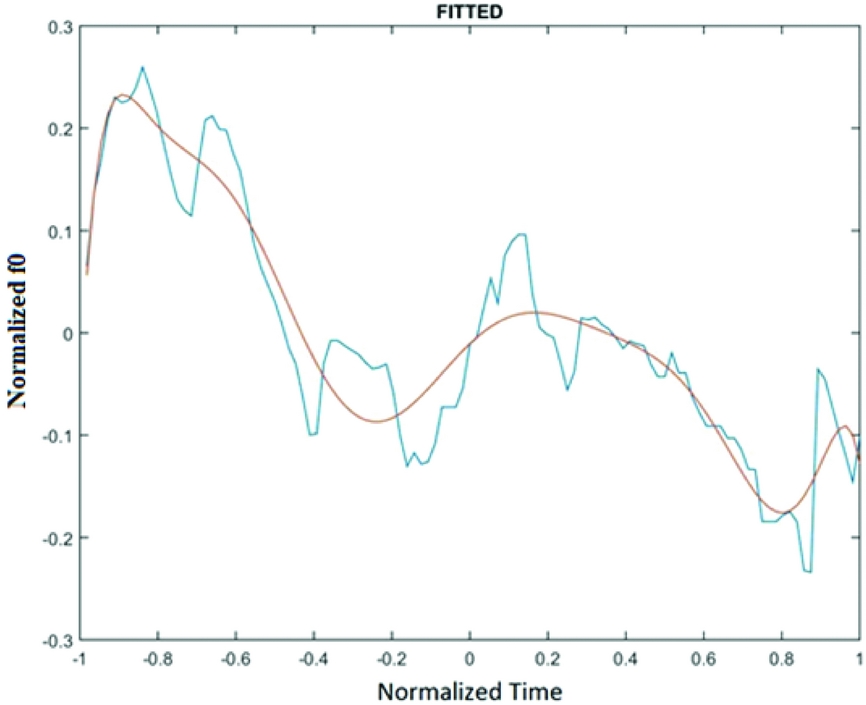
Figure 6 A fitted function with a d of ~0.02. The smooth (brown) line indicates the fitted function, while the jagged (blue) line represents the normalized f 0 vector.
The function in Figure 6 fits the vector reasonably well, and also appears to smooth out some small, rapid jumps and drops in f 0 that would not be detected as errors by the script in Section 4. In order to achieve a d of 0.02–0.04 for all utterances, another function was written in Matlab which began by attempting to fit a pintic (5 degree) function to each vector, tested the goodness of fit of the function after fitting, and then either increased the degree (up to a 25 degree polynomial, beyond which little goodness of fit is gained) if it was not a good enough fit, or decreased the degree if it was possible to lose some coefficients while maintaining accuracy (down to a cubic polynomial at lowest). However, with such a large number of possible coefficients it is difficult to relate each one to a linguistic variable, so in addition to taking the longer fitted functions an additional method was adopted.
The fitted functions were each broken down into trough-to-trough sections to be analyzed. In other words, after fitting, the fitted function was divided into the following segments:
• From the start of the vector to the first trough.
• The interval between each trough and the next.
• From the final trough to the end of the vector.
In terms of the relationship of these trough-to-trough sections to the actual prosody, each section analyzed was roughly equivalent to one accentual phrase in Japanese (Beckman & Pierrehumbert Reference Beckman and Pierrehumbert1986, Pierrehumbert & Beckman Reference Pierrehumbert and Beckman1988, Kubozono Reference Kubozono1993). An accentual phrase in (Tokyo) Japanese is characterized by an initial lowering of the pitch, followed by a rise in pitch up to a ‘pitch accent’,Footnote 2 after which there may be a fall in pitch dependent upon the location of the pitch-accent (Pierrehumbert & Beckman Reference Pierrehumbert and Beckman1988). Since the point at which pitch begins rising generally marks the beginning of the accentual phrase, the functions analyzed – which start at pitch troughs – should correspond approximately to the accentual phrase structure of the utterance.
Once the portions of the initial fitted function were broken down, cubic polynomials were then fitted to each of those portions of the original (normalized) f 0 contour that matched the extracted portions of the fitted function, and the orthogonalized coefficients of these new cubic polynomials were analyzed. This resulted in, on average, an excellent function fit, with a mean d of the cubic functions obtained using this method of 0.019. The four orthogonalized coefficients of those functions can be interpreted as follows (Grabe et al. Reference Grabe, Kochanski and Coleman2007):
(i) Coefficient 1 maps to the S-shaped ‘wiggle’ of the function, i.e. how much it moves up and down. Given that this method analyzed from trough-to-trough, this coefficient is unlikely to be high.
(ii) Coefficient 2 corresponds to the breadth of curvature of the function, or how sharply the f 0 rises towards and falls from the peak. This is broadly equivalent to pitch dynamism (Henton Reference Henton1989).
(iii) Coefficient 3 corresponds to the slope of the function, or how steeply the f 0 rises or falls overall. This relates to the height of the peak of the vector.
(iv) Coefficient 4 (the intercept) corresponds to the average height of the function, (i.e. the mean f 0).
In total, this resulted in 28,841 sets of coefficients. To avoid skewing the data with poorly fitted functions, any function with a d greater than 0.04 was removed from the data set, resulting in 27,118 total coefficient sets to be analyzed. A comparison of the average peak shape of the average functions (obtained by taking the mean of each of the four coefficients for informal and formal speech) can be seen in Figure 7, and a list of the mean orthogonalized coefficients can be seen in Table 4. The average peak shapes seen in Figure 7 should be approximately equivalent to the average f 0 contour of an accentual phrase in each level of formality.
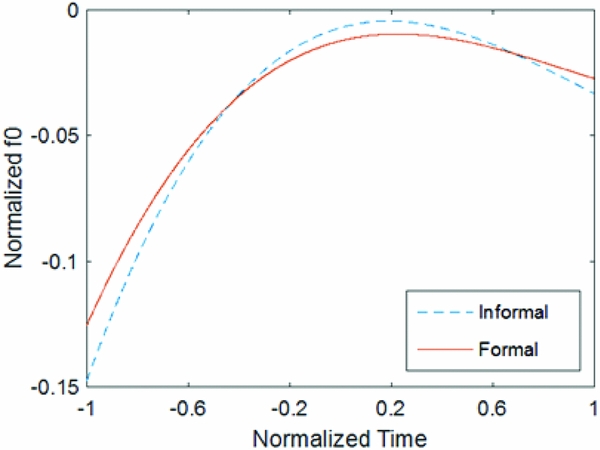
Figure 7 Average peak shape of the fitted functions for informal and formal speech. This is equivalent to the average shape of one accentual phrase in Japanese.
Table 4 List of mean orthogonalized function coefficients.

All four coefficients are significantly different in formal and informal speech in a generalized logistic mixed-effects model.
There are a few visually apparent differences between the average peaks for formal and informal speech. The function representing an accentual phrase in informal speech appears to start lower, and peak higher (related to coefficient 3), while also rising and falling more sharply (coefficient 2). The shape of this function indicates both that the initial pitch lowering observed in accentual phrases in Tokyo Japanese (Pierrehumbert & Beckman Reference Pierrehumbert and Beckman1988) is more pronounced in informal speech, and that informal accentual phrases appear to have greater pitch dynamism (Henton Reference Henton1989).
In order to test the statistical validity of these observations, each coefficient was used as a fixed factor in a binomial generalized linear mixed effects model (GLMM) as shown in (6). All four coefficients were combined in the model, and random intercepts and slopes for each coefficient were taken for the random factor of speaker. A summary of model comparison results for each coefficient is shown in Table 5.
(6) formality ~ coeff1 + coeff2 + coeff3 + coeff4 + (1 + coeff1 + coeff2 + coeff3 + coeff4|speaker)
Table 5 Results of model comparison for the generalized linear mixed effects model in (6).

The results of model comparison showed that all coefficients were significantly different in informal and formal speech. The visual observation of the lower start point and higher peak of the average informal accentual phrase was shown statistically by the significant difference in coefficients 3 and 4 between speech registers (both significantly higher in informal speech). The significance of coefficient 2 meant that f 0 rose to and fell from the peak more sharply in informal speech which was indicative of greater pitch dynamism in the accentual phrase, an attested indicator of greater overall pitch range (Henton Reference Henton1989, Reference Henton1995). As the functions were normalized for time, no conclusions can be drawn regarding whether the differences in breadth of curvature is related to the actual lengths of accentual phrases in Japanese. The significance of coefficient 1 is somewhat harder to relate to Figure 7 due to the lack of S-shape in the two functions, but the higher value in informal speech could indicate a greater level of flexibility in the f 0 contour of an informal accentual phrase in Japanese.
7 Discussion
There are several points that arise given the differences and similarities in results seen between this study and previous studies of the prosodic properties of formality and politeness in Japanese (Loveday Reference Loveday1981, Ofuka et al. Reference Ofuka, McKeown, Waterman and Roach2000, Ohara Reference Ohara, Pavlenko, Brackledge, Piller and Teutsch-Dwyer2001, Ito Reference Ito2002, Tsuji Reference Tsuji2004), as well as to Winter & Grawunder's (Reference Winter and Grawunder2012) study of Korean and Hübscher et al.’s (Reference Hübscher, Borràs-Comes and Prieto2017) study of Catalan.
7.1 f 0 and formality in Japanese
To recap, this study showed that in Japanese conversational speech the mean, SD, and range of f 0 are all significantly higher in informal speech. This result contrasted with much of the previous literature on the relationship between prosody and formality in Japanese – which had found either mixed results when analyzing f 0 (Ofuka et al. Reference Ofuka, McKeown, Waterman and Roach2000, Ito Reference Ito2002) or that f 0 was higher in polite (formal) speech (Loveday Reference Loveday1981, Ohara Reference Ohara, Pavlenko, Brackledge, Piller and Teutsch-Dwyer2001, Reference Ohara, Okamoto and Smith2004; Tsuji Reference Tsuji2004) – and also going against the predictions of the frequency code (Ohala Reference Ohala1984) that higher f 0 should be a universal linguistic property of polite speech. Conversely, the results largely mirrored those of cross-linguistic studies of Korean (Winter & Grawunder Reference Winter and Grawunder2012) and Catalan (Hübscher et al. Reference Hübscher, Borràs-Comes and Prieto2017), indicating some potential cross-linguistic tendencies (if not necessarily universals) in how phonetic parameters such as f 0 or intensity are used in the expression of formality.
The contrast of the current study with the results of previous related studies of Japanese are somewhat surprising, but can likely be explained by methodological differences. While the current study judged formality post-hoc based on the presence of lexical items or grammatical structures indexical of different levels of formality, previous work judged utterance formality based on either the relative social status of whomever the speaker was addressing (in the case of Ito Reference Ito2002) or instructed to role-play as if they were addressing (Ofuka et al. Reference Ofuka, McKeown, Waterman and Roach2000, Tsuji Reference Tsuji2004). Loveday (Reference Loveday1981) is in some ways most similar to the current study in that it evaluated politeness based on the inclusion of certain ‘politeness formulae’, or specific words or phrases judged to be particularly polite, although the speech was read rather than spontaneous, and there are known differences between the phonetic parameters of read and spontaneous speech in Japanese (Nakamura, Iwano & Furui Reference Nakamura, Iwano and Furui2007). These methodological differences make it difficult to directly compare the current study to previous work on the subject in Japanese, and although the differences in results do cast doubt on the validity of some previous findings, they do not necessarily invalidate them as it is possible that prosody relates to formality differently in different types of speech (i.e. read vs. elicited vs. conversational).
Another point of interest is the potential cross-linguistic validity of the results of this study. The results of this study concerning f 0 measures were extremely similar to those of Winter & Grawunder (Reference Winter and Grawunder2012) for Korean, and Hübscher et al. (Reference Hübscher, Borràs-Comes and Prieto2017) for Catalan Spanish. Those two studies, along with the current study, contribute to a growing body of evidence against previous claims that high pitch correlating with polite or formal speech is a linguistic universal (Ohala Reference Ohala1984, Brown & Levinson Reference Brown and Levinson1987, Gussenhoven Reference Gussenhoven2002). Hübscher et al. (Reference Hübscher, Borràs-Comes and Prieto2017) in particular notes that the similarities in how prosody is used to encode formality may simply be ascribed to similarities between the cultural interpretations of formality and politeness, noting a case where speakers of German from different cultural contexts (Germany and Austria) use prosody to express paralinguistic information in different ways (Grawunder, Oertel & Schwartze Reference Grawunder, Oertel and Schwarze2014). Interestingly however, Japanese is also posited as a contrastive example, where high pitch may be interpreted as a sign of submissiveness (Hübscher et al. Reference Hübscher, Borràs-Comes and Prieto2017: 155) meaning that the fact that this study also found higher f 0 in informal speech suggests that the issue may be more multi-faceted. This does not invalidate Hübscher et al.’s (Reference Hübscher, Borràs-Comes and Prieto2017) observation, but it does show that the explanation may be somewhat reductive. These cultural interpretations may not be entirely static, and variation in speech context (conversational speech, in the case of the current study) may produce unexpected variation in results where prosody is concerned.
In addition to the previously discussed measures of f 0, this study also conducted a functional data analysis of f 0 at the approximate level of the accentual phrase. While the analysis of this study was focused primarily on the suprasegmental level (i.e. overall differences in prosody rather than differences at the level of individual segments) which makes the results difficult to interpret in terms of the structure of Japanese, the functional data analysis does allow us to see some ways in which the results are connected to the prosodic structure at the accentual phrase level. As was previously noted, Tokyo Japanese is characterized by an accentual phrase structure where there is an initial lowering of f 0, followed by a rise to a pitch accent, and finishing with a (possible) final drop in f 0 (Pierrehumbert & Beckman Reference Pierrehumbert and Beckman1988). The results of the functional data analysis indicated essentially that the properties of the accentual phrase were exacerbated in informal speech; there was a lower initial start, a higher rise, and a deeper final drop in f 0, which indicated an overall increase in pitch dynamism (Henton Reference Henton1995) in informal speech in Japanese. While this study is limited to showing this difference at the level of the accentual phrase, it is reasonable to expect that similar results of increased pitch dynamism could be seen in other structural contexts, such as for example increased phrase-final f 0 movement, as was seen in informal speech in Ofuka et al. (Reference Ofuka, McKeown, Waterman and Roach2000). It would be useful in future research to investigate similar phenomena in further distinct contexts, which would allow the results to be more easily interpreted in terms of the specific structure of Japanese.
7.2 Other phonetic parameters and formality in Japanese
Aside from differences in f 0, this study also found increased intensity (mean and range), increased articulation rate, and decreased pause rate in informal speech. These results again pattern rather closely with those seen in Winter & Grawunder (Reference Winter and Grawunder2012) and Hübscher et al. (Reference Hübscher, Borràs-Comes and Prieto2017), although in the case of intensity there were some differences with Winter & Grawunder (Reference Winter and Grawunder2012) in that the SD of intensity was not significant in Japanese, and there were no observed interactions with gender in the current study. The overall results, however, pointed to the possibility that Japanese speakers may also be engaging in what Hübscher et al. (Reference Hübscher, Borràs-Comes and Prieto2017) termed ‘prosodic mitigation’ in formal speech, meaning that formal speech had a more ‘subdued’ profile – slower, quieter, and more hesitant. In empirical terms, for the data investigated in this study a subdued prosody appeared to be realized both by more a generally more measured pace of speech (lower articulation rate, more pausing) and by a slightly greater degree of flexibility in how speech is paced (higher SD of articulation rate and pause rate in formal speech).
8 Conclusion
Overall, this study has demonstrated a significant relationship between prosody and formality in conversational Japanese and provided further evidence against the universality of increased f 0 as a universal marker of politeness and formality (Ohala Reference Ohala1984). It is difficult to draw any definite conclusions about the cross-linguistic nature of the results, but the similarity of the results of this investigation of Japanese to those of similar studies of the unrelated languages of Korean and Catalan Spanish does imply that certain strategies may be used by speakers of many different languages and that the question is worth investigating in further languages and contexts.
This study also leaves open some questions on the more specific nature of how prosody is used by speakers to express different levels of formality in conversation, as the rather large segments that were analyzed (full sentences rather than phrases, words, or moras) precluded a close investigation of exactly how prosody was changing at the segmental level. A more fine-grain investigation could help illuminate further whether the changes in prosody observed in this study are more closely connected to the phonological and morphological structure of Japanese. This study also examined speech data exclusively from speakers of Tokyo Japanese, but an investigation of how the changes in f 0 seen in this study interact with the pitch accent systems of different dialects could also help provide a better understanding of how the prosodic expression of formality is connected to the overall prosodic structure of Japanese.
Acknowledgements
I would like to thank Professor John Coleman for his support, and advice regarding the applications of functional data analysis. I would also like to thank Professor Kikuo Maekawa of the National Institute of Japanese Language and Linguistics (NINJAL) for his invaluable support in participant recruitment and data collection for the corpus used in this study, and for assisting with organizing a research visit to Japan. Thanks also to Dr. Hanae Koiso of NINJAL for her advice on corpus structure and interview format. Finally I would like to thank the editor Amalia Arvaniti, and the anonymous reviewers for providing extensive feedback that helped improve this paper by leaps and bounds.


