


I. Introduction
Wine is a highly differentiated product in the agri-food sector due to the strong links between quality, varieties, vintages, regions of origin (Charters and Pettigrew, Reference Charters and Pettigrew2007), and the corresponding price variations (Chandra and Moschini, Reference Chandra and Moschini2022). In such diverse markets, consumers face difficulties in fully evaluating product quality (Akerlof, Reference Akerlof1970). For wine, it is widely acknowledged that consumers use certain extrinsic features on wine labels, such as country and/or region of origin, grape variety, brand, and price, to evaluate product quality (Jaeger et al., Reference Jaeger, Mielby, Heymann, Jia and Frøst2013; Lockshin and Corsi, Reference Lockshin and Corsi2012; Mueller and Szolnoki, Reference Mueller and Szolnoki2010; Sáenz-Navajas et al., Reference Sáenz-Navajas, Campo, Sutan, Ballester and Valentin2013). However, the general inability to taste wine prior to purchasing means that consumers are forced to rely on imperfect information when evaluating quality. Consumers often rely on sensory quality assessments, including expert ratings, awards, competition results, and tasting notes, to bridge the information gap (Ribeiro et al., Reference Ribeiro, Corsi, Lockshin, Louviere and Loose2020).
The literature on the impact of expert ratings on the wine market is extensive, and many studies emphasize the influence of such ratings on consumer willingness to pay (Neuninger et al., Reference Neuninger, Mather and Duncan2016; Schäufele et al., Reference Schäufele, Herrmann and Szolnoki2016), wine selection (Goodman, Reference Goodman2009; Lockshin et al., Reference Lockshin, Jarvis, d’Hauteville and Perrouty2006), and regional or winery reputation (Penagos-Londoño et al., Reference Penagos-Londoño, Ruiz-Moreno, Sellers-Rubio, Del Barrio-García and Casado-Díaz2023). Expert ratings drive wineries’ success by influencing consumer sales and prices. Multiple studies support this claim (Oczkowski and Doucouliagos, Reference Oczkowski and Doucouliagos2015; Schamel and Anderson, Reference Schamel and Anderson2003; Schamel and Ros, Reference Schamel and Ros2021), at least for high-rated “superstar” wines (Castriota et al., Reference Castriota, Corsi, Frumento and Ruggeri2022). Demand for highly rated wines among wine producers has increased, causing an inflation of prices (Kotonya et al., Reference Kotonya, De Cristofaro and De Cristofaro2018). Considering this, significant scrutiny has arisen regarding the validity of expert wine ratings as sensory evaluations are profoundly subjective, reflecting the taste preferences of just one individual (Oczkowski and Pawsey, Reference Oczkowski and Pawsey2019).
Consumers, on the other hand, have easy access to the opinions of their peers and have become increasingly active in rating and reviewing wines. Thus, they no longer need to rely only on individual wine experts. Anderson and Magrunder (Reference Anderson and Magruder2012) highlighted the importance of consumer opinions and social learning in shaping product beliefs and, hence, purchase decisions for experiential goods such as wine. With the rapid growth of online communities and marketplaces (e.g., Vivino and Cellartracker), ordinary consumers can share their wine experience and knowledge through reviews and ratings. Consumer opinions and aggregated wine ratings are accessible to peer users. For example, Vivino, the world’s most downloaded wine app, which has developed into an online marketplace, claims that you can “check out honest reviews … add your rating and help other Vivino users choose the right wine!” When consumers use aggregated ratings from their peers, a form of social influence occurs, i.e., people are influenced by group behavior and tend to comply and conform (see Cialdini and Goldstein, Reference Cialdini and Goldstein2004 for a review). Therefore, online consumer ratings and reviews can play a crucial role in promoting brand loyalty and have a notable influence on consumers’ purchase decisions (Gavilan et al., Reference Gavilan, Avello and Martinez-Navarro2018).
Average ratings in a five-star rating system are easily accessible information cues that facilitate consumers’ information processing and reduce cognitive effort while providing high information quality (Chen, Reference Chen2017). In addition to average ratings, the number of ratings and reviews a product receives is important for online purchases. The number of reviews provides social proof and generates trust (Gavilan et al., Reference Gavilan, Avello and Martinez-Navarro2018; Lee et al., Reference Lee, Park and Han2011). It is interesting to note that average rating scores interact with the number of reviews. One might assume that a high number of reviews would make an average review score a reliable number. However, Gavilan et al. (Reference Gavilan, Avello and Martinez-Navarro2018) and Hong and Pittman (Reference Hong and Pittman2020) found that this is only true for “good” ratings.
Consumer ratings for hotels (see Hu and Yang, Reference Hu and Yang2021 for a meta-analysis), restaurants (Bilgihan et al., Reference Bilgihan, Seo and Choi2018; Tian et al., Reference Tian, Lu and McIntosh2021; Yan et al., Reference Yan, Wang and Chau2015), or review websites, such as Amazon and Yelp (see Floyd et al., Reference Floyd, Freling, Alhoqail, Cho and Freling2014 and Hong et al., Reference Hong, Xu, Wang and Fan2017 for a meta-analysis), have already gained a lot of interest in the scientific literature. Instead, research on consumer ratings on wine platforms such as vivino.com or cellartracker.com is still developing (e.g., Kopsacheilis et al., Reference Kopsacheilis, Analytis, Kaushik, Herzog, Bahrami and Deroy2023; Mazzoli and Palumbo, Reference Mazzoli and Palumbo2022).
Oczkowski and Pawsey (Reference Oczkowski and Pawsey2019) found a gap between consumer and expert ratings and pointed to diverging sensory preferences. Moreover, their study provides evidence for a correlation between consumer ratings and wine prices. A common explanation given is the fact that consumers use prices as an indicator of quality, and according to this subconscious influence, higher-priced wines receive higher consumer ratings (Gokcekus and Nottebaum, Reference Gokcekus and Nottebaum2011; Oczkowski and Pawsey, Reference Oczkowski and Pawsey2019). In contrast, the study by Kotonya (Reference Kotonya, De Cristofaro and De Cristofaro2018) gives little evidence for a strong relationship between prices and consumer ratings. Nevertheless, both Kotonya’s (Reference Kotonya, De Cristofaro and De Cristofaro2018) and Oczkowski and Pawsey’s (Reference Oczkowski and Pawsey2019) results suggest that expert opinions and online wine community reviews are related and often comparable. Such results have also been confirmed by a recent market experiment run by U.S. wine critic Ester Mobley on Vivino users from California in 2022. Indeed, Mobley’s wine evaluations turned out to be remarkably like those of app users except for high-priced luxury wines (above €200), which were indeed rated significantly higher on Vivino (Mobley, Reference Mobley2022). Similarly, Bazen et al.’s (Reference Bazen, Cardebat and Dubois2023) hedonic analysis of French wines on Vivino found community ratings to have a greater impact on wine price than experts, except for top-end wines.
Our study will add to the knowledge of online consumer ratings in two ways. First, we explore factors influencing consumer rating itself. A rating model will examine the so-called “community effect” or the impact of the number of ratings. Second, we study the effects of wine attributes on price to find out if there is a consistency between the factors affecting consumer ratings and those affecting prices. Thus, a hedonic price analysis with the same determinants as for the ratings model is carried out. Indeed, to the best of our knowledge, these aspects are still unexplored by the academic literature. Particularly, we formulated the following research questions (RQs):
RQ1: How do consumer ratings respond to the influence of the community effect while accounting for essential wine characteristics?
RQ2: What is the impact of wine attributes on wine prices and are those effects consistent with the factors affecting consumer ratings?
We expect that individual consumer ratings are influenced by how often a wine has been rated, i.e., the more popular a wine becomes among consumers (expressed by the number of ratings), the higher the wine will be rated. We control for both Geographical Indication (GI) and brand effects. The literature on GIs has shown that more restrictive GI rules lead on average to a greater perceived quality. Specifically, Protected Designation of Origin (PDO) tend to be valued more than Protected Geographical Indication (PGI) (Caracciolo and Furno, Reference Caracciolo and Furno2020). The wine brand literature has shown that the quality performance of co-op brands is generally lower relative to privately owned brands (Pennerstorfer and Weiss, Reference Pennerstorfer and Weiss2013; Schamel, Reference Schamel2015) although exceptions may exist (Frick, Reference Frick2017; Schamel, Reference Schamel2014).
Hedonic pricing models assume that wine price is a combination of implicit prices of wine attributes and thus reveal consumer preferences (Outreville and Le Fur, Reference Outreville and Le Fur2020). Wine price formation is the result of both consumer preferences (Ling and Lockshin, Reference Ling and Lockshin2003; Oczkowski and Doucouliagos, Reference Oczkowski and Doucouliagos2015) and production costs based on vintage, geographical origin, and certification. On the other hand, consumer preferences mostly reflect the evaluation of a wine and perceptions its attributes. Signals like observed product prices can affect such perceived value, leading to higher ratings (e.g., Almenberg and Dreber, Reference Almenberg and Dreber2011), but perceived values of single attributes may not necessarily correspond to estimated implicit prices. This may happen due to consumers’ lack of knowledge and awareness of production and/or certification characteristics, as previous research has observed (e.g., Costanigro et al., Reference Costanigro, Scozzafava and Casini2019; Jover et al., Reference Jover, Montes and Fuentes2004; Teuber, Reference Teuber2011).
II. Materials and methods
a. Dataset description
We obtained the data from Vivino.com, the main online wine community in Italy (Mastroberardino et al., Reference Mastroberardino, Calabrese, Cortese and Petracca2020). Currently, it lists over 17 million wines from all over the world rated over 279 million times and is the world’s most downloaded wine app, growing from about 27 million users in 2018 to 42 million in 2020 to over 66 million in 2023Footnote 1. In April 2022, we collected 1,747 observations of vintage wines from Trentino–Alto Adige (TAA) with at least 25 ratings and a price quote, meaning that they were available directly from Vivino or through external online shops. For a vintage wine with less than 25 ratings, no unique rating is available but only an average over all vintages of the same wine. If the same wine has more than 25 ratings over several vintages, it may appear multiple times in the data. The price quotes are either directly from Vivino or average online prices from external shops.Footnote 2
In the paper, we analyze wines from TAA in northern Italy, which is known for the strength of their cooperative wine producers (Schamel, Reference Schamel2014; Weinwirtschaft, 2022), with a volume share of about 70% (Raiffeisenverband, 2022). Combined, the two provinces produce 1.3 billion hectoliters of wine, 83.7% of which is PDO and 15.2% is PGI.Footnote 3 We have information on wine names (wname), producer brand names (producer), vintages (vintage), average ratings received from Vivino users (rating), the number of ratings for each vintage wine (nratings), the price per bottle (price), as well as wine attributes such as variety (variety), and the GI of the wine.
In Table 1, we summarize the descriptive statistics, including information on producer brands and if the wine is from a cooperative (co-op) or investor-owned firm (IOF). Note that producer brand information is highly fragmented: only 20 of 138 producer brands in the sample have 29 or more wines in the sample. Our sample identifies 44 distinct varieties and blends. The main varieties grown in Trentino (TN) and Alto Adige (AA) are Lagrein (2.1% TN/10% AA), Pinot Noir (3.5%/10%), Merlot (5.4%/3%), Schiava (2.3%/9%), Cabernets (2.4%/3%),Footnote 4 Pinot Grigio (29%/12%), Gewürztraminer (4%/11%), Pinot Blanc (0.7%/10%), Chardonnay (27%/11%), Sauvignon Blanc (1.2%/8%), and Müller-Thurgau (9.3%/3%). Teroldego (6.3%) is only grown in Trentino. Together, these varieties account for about 75% of the sample (Table 1). Regarding GIs, most wines are PDO, with a notable percentage from Alto Adige PDO (roughly 70%), and 11% are PGI wines from the Vigneti delle Dolomiti. Vintages declared on the label range from 2003 to 2021, with 80% of them from 2010 to 2019.
Table 1. Sample descriptive statistics

Wine prices in €/bottle (price) reveal great variations across the sample and a highly skewed distribution, ranging from a minimum of €4.1/bottle to a maximum of €280/bottle (price mean = 23.4; std. dev. = 22.89). The price distribution is plausibly connected to the presence of champagne-style sparkling wines and aged reds. The rating variable has a close-to-normal but slightly kurtotic distribution (Figure 1, top). The mean rating is 3.92 (with a low std. dev. = 0.25), which is much higher than the 3.6 average for all wines reported on Vivino (Vivino, 2020). The nratings variable has a mean of 197.3 (with a high std. dev. = 642.8) and mainly reflects how popular the wine is among Vivino users. While it may also be related to how much of it was produced (rarity) and for how long it has been listed on the platform (recency), the lure to taste and rate rare wines and the growing number of users should counteract any negative bias caused by the rarity and recency of vintages.

Figure 1. Distribution of rating and nratings.
In Figure 2, we graph the average Vivino rating against the quantiles of nratings represented as log(nratings). Interestingly, the average Vivino rating tends to gradually increase as wines are reviewed by more users, and there is also less variability in the ratings assigned. This observation suggests that, on average, wines that are popular among platform users (having more ratings) tend to get slightly higher ratings. Moreover, it indicates that as the wine accumulates an increasing number of reviews, new ratings are less likely to deviate from the crowd’s opinion.

Figure 2. Average Vivino rating and standard deviation for each quantile of log(nratings).
b. Empirical models specification
To address RQ1, given the remarkable price differentiation in the wine market (Costanigro et al., Reference Costanigro, McCluskey and Mittelhammer2007), we estimate regression models with the Vivino rating as the dependent variable (DV) for three distinct price ranges. Price ranges are retrieved from quantiles of the price-per-bottle distribution at 25% (€12.5/bottle or lower; model 1), 50–75% (from €12.5 to €26/bottle; model 2), and above 75% (and above €26/bottle; model 3; see priceord in Table 1). The latter quantile is truncated at €100/bottle. Hence, we exclude a very small share of expensive wines in our sample (24 out of 1,747), which, based on existing knowledge (e.g., Gonen et al., Reference Gonen, Tavor and Spiegel2021; Mobley, Reference Mobley2022), should be treated separately. Thus, 1,723 observations are eligible for the analysis.
We use the information on the number of ratings, grape variety, GI, vintage, and producer brands as regressors. As previously specified, the original variable rating is continuous and is expressed on a scale from 1 to 5. Since the distribution of nratings is not normal, the variable was logged. Varietal effects are captured by a categorical dummy variable. We control for and collinearity effect from blends by including two dummy variables for white wine blends (white blend) and red/rosé wine blends (red/rosé blend). Since GIs strongly correlate with grape varieties causing collinearity issues, the GI information is aggregated. The wines in our sample are either PDO (mostly Alto Adige DOC) or PGI (Vigneti delle Dolomiti IGT). Hence, we include a dummy variable, PDO, being 1 for PDO and 0 for PGI (Table 1).
The 2020/21 vintage and the 2015 and older vintages (selected as reference categories) and their respective dummies refer to multiple vintages because they have relatively few observations. Controlling for single producers was not possible due to the sample fragmentation. Thus, we include 20 producer brands with more than 29 wines (brand30), aggregating all others together as the reference category.
We thus estimate the regression models shown in equation (1) with the Vivino rating as the DV and the regressors as discussed for three price quantiles (Wooldridge, Reference Wooldridge2015):
 \begin{align}& logratin{g_{price{\text{ }}range{\text{ }}i}} = {\text{ }}{\beta _0} + {\text{ }}{\beta _1}lognrat + {\text{ }}\mathop \sum \limits_{n = 1}^5 {\beta _{2{\text{ }}}}{V_{vintage}} + {\text{ }}\mathop \sum \limits_{e = 1}^{14} {\beta _{3{\text{ }}}}{J_{variety}}\nonumber \\ & \qquad\qquad\qquad\qquad\quad + {\beta _{4{\text{ }}}}PDO + {\text{ }}\mathop \sum \limits_{f = 1}^{20} {\beta _{5{\text{ }}}}{P_{brand\, 30}} + {\text{ }}{\varepsilon _i}\end{align} $V{\text{ }}$ and $J{\text{ }}$ are vectors of marginal effects due to specific vintages and grape varieties, respectively. Similarly, $P{\text{ }}$ is a vector including indicators for producer brands having 30 or more wines in the sample. White’s test was conducted to detect heteroscedasticity (Wooldridge, Reference Wooldridge2015). In the case of a significant White test result, robust estimation was applied to handle heteroscedasticity. Furthermore, we run the Ramsey RESET test to detect model specification issues and calculate the variance inflation factor (VIF) to check for multicollinearity (Hair et al., Reference Hair, Black, Babin and Anderson2019). Finally, endogeneity was assessed using the Hausman specification test. A significant coefficient for the residuals in the Hausman test indicates endogeneity.
To tackle RQ2, following Caracciolo et al. (Reference Caracciolo, D’Amico, Di Vita, Pomarici, Dal Bianco and Cembalo2016) and Fedoseev et al. (Reference Fedoseev, Fedoseeva and Herrmann2022), we estimate a hedonic quantile model (HQM) through conditional quantile regression shown in equation (2), as implicit prices vary significantly over different market price percentiles. This technique is widely used for robust estimations. It allows assessing the impact of the regressors on a specific quantile of y distribution, conditional to the value of the regressors in the model. Being a one-stage HQM, we restrict variables to wine-related features without incorporating producer-specific factors such as the reputation of the producer or quantity sold, as recommended by Oczkowski (Reference Oczkowski2022). Specifically, we used the Stata sqreg function with 1,000 bootstraps to simultaneously estimate four quantiles of the price distribution: 25% (q25), 50% (q50), 75% (q75), and 90% (q90). The selected quantiles reflect the price ranges considered for the linear regressions on ratings. As in the study by Fedoseev et al. (Reference Fedoseev, Fedoseeva and Herrmann2022), the DV was the logarithm of the price-per-bottle of each wine, and the same pool of regressors included in the rating regression models was used except for lognrat.
 \begin{equation}logpric{e_i} = {\text{ }}{\beta _0} + {\text{ }}\mathop \sum \limits_{n = 1}^5 {\beta _{1{\text{ }}}}{V_{vintage}} + {\text{ }}\mathop \sum \limits_{e = 1}^{14} {\beta _{2{\text{ }}}}{J_{variety}} + {\beta _{3{\text{ }}}}PDO + {\text{ }}\mathop \sum \limits_{f = 1}^{20} {\beta _{4{\text{ }}}}{P_{brand\, 30}} + {\text{ }}{\varepsilon _i}\end{equation}
We exclude information on consumer ratings from this model (rating and nratings) since the current dataset considers the aggregated average rating a wine receives after its listing on Vivino until data collection and the prices at the time of data collection (April 2022). Therefore, a dynamic analysis of prices as consumer ratings change is not possible. Moreover, wine prices and quality perception are closely connected (Priilaid and Hall, Reference Priilaid and Hall2016), and Vivino users usually know the price when rating a wine. Figure 3 supports this relationship, showing how the average consumer rating increases as more expensive wines are considered. Thus, potential reverse causality effects can arise when trying to explain wine prices through consumers’ ratings on Vivino.

Figure 3. Mean rating and standard deviation by price quantile.
Homogeneity among quantile coefficients was tested with the null hypothesis (H0) being q(25) = q(50) = q(75) = q(90): statistically significant p-values at 5% indicate that the null hypothesis is rejected and that coefficients significantly differ among the estimated quantiles. Lastly, price effects in % are calculated for the categorical regressors based on Halvorsen and Palmquist (Reference Halvorsen and Palmquist1980) as (eβ − 1) × 100, where β is the estimated regression coefficient for the regressor considered.
III. Results
a. Regression models on community ratings
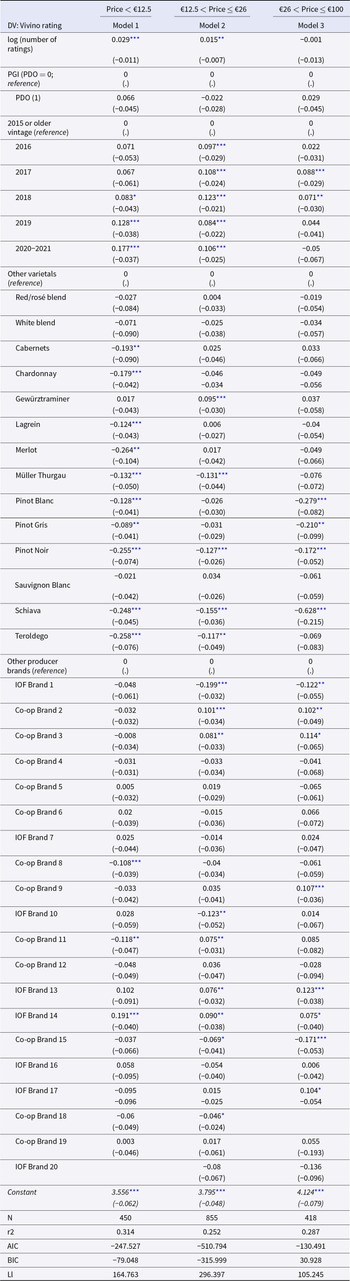
Table 2 reports the regression results for equation (1) for the three price quantiles considered (DV = lograting). The R2 value varies from 0.25 (second quantile) to 0.31 (first quantile). Ramsey’s test is not significant for all models, indicating that there are no omitted variables. Similarly, the VIFs for all models are below the common critical threshold of 10 (Hair et al., Reference Hair, Black, Babin and Anderson2019; Table 2), and the insignificant effect from the Hausman test indicates that no endogeneity is present. The number of ratings (lognrat) has a small but positive effect in model 1 and 2 (i.e., for wine priced below €12.5 and in the €12.5–€26 range), while its coefficient is insignificant in model 3 (i.e., for high-priced wines). Similarly, co-op branded wines tend to receive significantly lower ratings in model 1 but show better performances than private (IOF-branded) wines in model 2. No significant effect appears for more expensive wines. The PDO certification does not lead to significantly higher wine evaluations compared to PGI in any of the price ranges. Diversely, a vintage effect is present in all the models. As expected, newer vintages tend to collect increasingly higher ratings in models 1 and 2. On the contrary, older vintages are particularly appreciated in the middle and top price ranges (models 2 and 3).
Table 2. Regression models on consumer ratings for the three price ranges

Note: Estimated coefficient and (standard error). Ll = Loglikelihood. VIF values (min–max): Model 1 = 1.05–3.48; Model 2 = 1.02–2.07; Model 3 = 1.06–3.72. AIC = Akaike’s information criterion; BIC = Bajesian information criterion.
* p < 0.10; **p < 0.05; ***p < 0.01.
Finally, different varieties show heterogeneous effects. Gewürztraminer is the most appreciated among Vivino users, receiving greater average ratings compared to other varieties in the middle price range (model 2). Pinot Noir, as well as the local varieties Schiava, Teroldego, and Müller Thurgau, tend to be consistently less appreciated. Moreover, other varieties show isolated negative effects at one price point (i.e., Lagrein, Chardonnay, Cabernets, and Merlot) or at the two distribution extremes (e.g., Pinot Blanc and Pinot Gris). Lastly, producer performance is remarkably diverse. No co-op brand received greater average ratings in the lowest price segment, where some even perform significantly worse (e.g., Co-op Brand 8), while one winery (IOF Brand 14) seems to outperform competitors. Nevertheless, many co-op branded bottles in the middle price range are strongly appreciated by the Vivino community, recording even greater ratings for high-priced bottles.
b. Hedonic quantile regression on price
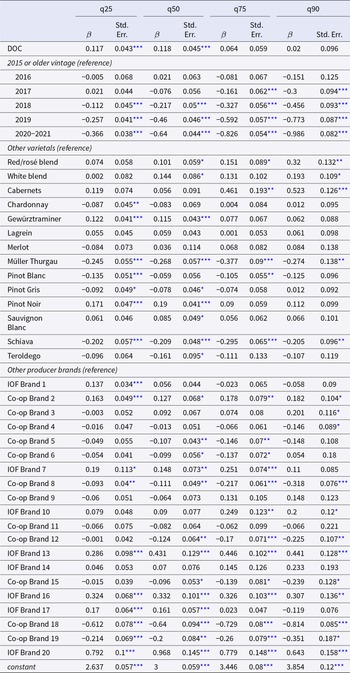
Estimates of the HQR model regarding RQ2 are presented in Table 3, while Table 4 summarizes the estimated price effects in % and the results of the homogeneity test among coefficients of the same regressor in different price quantiles. Overall, several estimates appear to be heterogeneous among price quantiles (Table 4). The HQR model reveals that the GI effect is generally positive for all quantiles. PDO wines obtain significantly greater prices compared to PGI wines only in the first two quantiles (q25 and q50). As expected, younger vintages obtain lower average prices compared to 2015 or older vintages at all price points (between-vintages effect), with a negative peak in the upper price quantiles (q75 and q90). The price discount of younger bottles against older vintages reaches −62.7% for high-priced wines but shrinks up a half in the first price quantile (Table 4). Moreover, the “old vintage” effect is most evident up to 2018 bottles, i.e., 4-year-old wines, while the price premium obtained from 2017 and earlier is mostly comparable. The test for equality of coefficients is significant for all vintage dummies, suggesting that the same vintage receives a significantly different price premium at different price quantiles.
Table 3. Hedonic quantile regression on price-per-bottle (DV)

Note: n = 1,723. Pseudo R2 q25 = 0.23; q50 = 0.27; q75 = 0.29; q90 = 0.31.
* p < 0.10; **p < 0.05; ***p < 0.01.
The DV is the logarithm of price-per-bottle. The 25% quantile (q25) corresponds to 12.5 €/bottle; the 50% (q50) to 16.9 €/bottle; the 75% (q75) to 26.5 €/bottle; and the 90% (q90) to 39.9 €/bottle. VIF values (min–max): 1.34–6.09.
Table 4. Price effects (%) and heterogeneity among estimated quantiles coefficients

Note: n = 1,723.
* p < 0.10; **p < 0.05; ***p < 0.01. Dark gray cells are significant at p < 0.05; light gray cells are significant at p < 0.10. Price effects in % are calculated for the categorical regressors based on Halvorsen and Palmquist (Reference Halvorsen and Palmquist1980) as (eβ − 1) × 100, where β is the estimated regression coefficient for the regressor considered.
aH0: [q25] = [q50] = [q75] = [q90]
In contrast, the performance of varietals in terms of price-per-bottle seems highly heterogeneous between different grape varieties but mostly homogeneous among different price segments. Bottles from the autochthonous Schiava, Müller Thurgau, and Pinot Blanc record a consistently lower price compared to other varieties across all quantiles. Pinot Blanc exhibits lower value discounts in the first and third price quantiles (13% and 10%), respectively, as shown in Table 4. On the contrary, Pinot Noir, red/rosé blends, and Gewürztraminer bottles benefit from price premia in the market. Gewürztraminer and Pinot Noir get relatively high price premia at low and medium price points, i.e., q25 and q50 (referring to Table 4). Cabernets have a significant but heterogeneous pricing, with a 60%–70% premium among high-priced bottles (q75 and q90; Table 4). Red and blends show similar behavior in the upper part of the price distribution (q90).
Looking at producer effects, the price-performance among co-op brands differs but appears essentially negative. Only one co-op brand obtains about 20% higher prices in all the quantiles, but it is mostly significant at q25 and q75, while the bottles from many other cooperatives are consistently sold at lower prices.
IV. Discussion and conclusions
This paper provides a first analysis of consumer ratings and how they respond to community effects (i.e., how often a wine has been rated) while accounting for essential wine attributes. We examine recent data for TAA wines obtained from Vivino.com. As a main result of this paper, we show that a small but significant online community effect on perceived quality exists, related to a wine’s popularity among users of the Vivino community.
The regressions on Vivino ratings (RQ1) reveal that the factors affecting them seem to change depending on prices. Specifically, wines with a greater number of reviews received higher average ratings in the price ranges up to €26/bottle, while the number of reviews is no longer relevant for higher-end wines. This aligns with findings from Thrane’s hypothetical survey experiment (2019), showing that positive peer reviews can affect consumer purchase choices for low- and medium-priced red wines, while peer opinions are not significant for premium wines, for which other reputational aspects seem to be more important. For instance, rarity may play a role in the most expensive bottles, which are usually older (Gonen et al., Reference Gonen, Tavor and Spiegel2021). Further research focusing on higher-end bottles is needed to explore the dynamics of reputation and community effects in this peculiar market segment, for example, by including expert evaluations as an instrument for product quality.
The descriptive analysis of average Vivino ratings by lognrat quantile unveils another interesting trait of the community effect that can be defined as “e-community subjective norm,” i.e., the social pressure coming from peer opinions (Ajzen, Reference Ajzen1991). Indeed, Figure 2 shows that ratings tend to be increasingly consistent as the number of evaluations increases. Thus, Vivino users may perceive the average rating of a wine judged by many users as an “established opinion” for which they would need more expertise or a strong motivation to deviate from (as suggested by Cialdini and Goldstein, Reference Cialdini and Goldstein2004). Analyzing point data on single reviewers, their ratings on the same wine, and their profile could help shed light on how pre-existing consumer opinions affect future ones. Moreover, it is reasonable to believe that the community’s opinion may affect wine purchase decisions ex-ante, both positively and negatively (as in Thrane, Reference Thrane2019). Indeed, highly rated wines may have more ratings because more people buy them due to their high popularity. On the contrary, wines “unanimously” rated lower may attract fewer consumers, and their number of ratings should stop increasing, reaching a plateau. Monitoring the relationship between average wine ratings and the number of ratings over time would help reveal whether this hypothesis holds and estimate the extent of the community’s impact on actual purchase behavior.
Furthermore, the common belief that co-op wines are perceived as lower quality does not seem to hold for the TAA cooperative brands analyzed, at least after consumers have tasted the product. Results also confirm that varietals and brands that are highly appreciated by Vivino users also receive a greater price premium from the market. Thus, price may be a good indicator of perceived consumer quality and preferences in this respect independently from how and when wine quality is evaluated. Diversely, vintage and GI effects differ between estimated implicit prices and consumers’ ratings, suggesting that similar attributes may have a different relevance based on the evaluation context considered.
When ratings are analysed, our model shows that PDO wines are not rated higher than PGIs for all price segments, suggesting GI rules and their restrictiveness do not impact how Vivino users perceive regional wine quality after consumption. Still, we cannot exclude a positive GI-label effect on consumers’ ratings associated with the presence or absence of a GI label. Indeed, both PDO and PGI can be considered premium wines (Caracciolo et al., Reference Caracciolo, Di Vita, Lanfranchi and D’Amico2015; Di Vita et al., Reference Di Vita, Caracciolo, Brun and D’Amico2019).
As for vintages, consumers seem to appreciate younger bottles more than old ones, especially at lower price points. Even in the €12.5–€26 segment, all vintages report significantly greater ratings than 2015 or older bottles. The preference for younger wines is reduced above €26, where still some positive effects emerge for 2017 and 2018 bottles. This may be due to the regional orientation toward white wine production, accounting from 60% to 70% of the wine produced in South TyrolFootnote 5 and Trentino.Footnote 6 Thus, TAA whites are more popular on the market and may be more appreciated than regional reds, which are usually the ones being aged (Gonen, Reference Gonen, Tavor and Spiegel2021).
Overall, grape varieties do not seem to play a key role in determining average ratings. A positive exception is Gewürztraminer, which receives significantly higher ratings in the middle price segment. Gewürztraminer is a key variety for Alto Adige having grown in importance and now represents the second most important variety in the region.Footnote 7 Schiava and Müller Thurgau exhibit negative effects in determining average Vivino ratings.
Finally, most of the significant producer effects belong to co-op bottles although with heterogeneous performance among brands and different price ranges. Thus, our findings reveal that the long-told story of co-ops wine being perceived as lower quality (Caracciolo and Furno, Reference Caracciolo and Furno2020) may no longer be true, or at least, not for all TAA co-op brands. The importance of wine cooperatives in TAA and the Italian wine industry calls for additional analysis exploring co-op wine reputation and performance compared to other managerial and ownership forms. Our results should be further validated considering a broader range of wines covering more price points and co-op brands nationwide.
When comparing the ratings (RQ1) and hedonic quantile (RQ2) regression results, several differences emerge. First, the PDO label delivers a significant price premium compared to the PGI up to the 50% price quantile, even if consumers do not seem to rate PDO bottles higher than PGI ones. However, the PDO price premium becomes insignificant for higher-priced wines above the 50% price quantile, which may be due to individual and producer-related reputation effects that a wine has accumulated over time (Schamel and Ros, Reference Schamel and Ros2021). Still, the premium observed for PDO labels in the first half of the price distribution indicates that they may be effective higher-quality signals compared to PGI ones in these segments, perhaps prior to tasting the product. Indeed, the economic value of such labels is either strongly cost- or knowledge-related (e.g., Costanigro et. al., Reference Costanigro, Scozzafava and Casini2019; Jover et al., Reference Jover, Montes and Fuentes2004; Teuber, Reference Teuber2011).
Vintage-specific performances show a strong heterogeneity across price quantiles, supporting the assumption that different price ranges should be analyzed separately. As expected, younger bottles get increasingly less expensive compared to older vintages, and such penalization significantly rises with price. This result is not surprising as aging wines imply greater production costs. Still, it contrasts with consumers’ greater perceived value for younger wines, especially for bottles up to €26. Such discrepancies can be due to their actual suitability to enhance wine characteristics through aging, which strongly depends on multiple factors (García-Alcaraz et al., Reference García-Alcaraz, Montalvo, Cámara, de la Parte, Jiménez-Macías and Blanco-Fernández2020), including regional characteristics and grape varieties, noting that TAA wine production is mostly white wine.
Similarly, production cost-related effects may apply to the misalignment emerging between implicit prices of some varietals (e.g., Pinot Noir) and community ratings. Still, most varietal price effects are consistent with consumer preferences (see, e.g., Gewürztraminer, Schiava, and Müller Thurgau). A limitation of this study in this respect is the inclusion of only two production areas, i.e., Trentino and Alto Adige. Performing the same analysis on national data would allow a better evaluation of the performance of local vs international varieties. This is particularly relevant for international varieties, which are cultivated across Italy and may thus produce wines with different organoleptic characteristics based on soil and climate conditions. For example, the price heterogeneity of Cabernet-based wines and their remarkable premium among high-end bottles should be further explored. Moreover, extending the dataset would allow to include additional regressors representing, among others, single GIs. Similarly to varieties, implicit prices for winery brands tend to align with those on consumer ratings with a few exceptions. Nevertheless, our results should be interpreted cautiously as the sample contains only wines self-selected by Vivino users and not all wines produced by a given producer brand are present in the dataset.
To conclude, sample descriptives provide some evidence of TAA wines having a stronger quality reputation than average wines on Vivino as their mean rating is above Vivino’s overall average (Vivino, 2020). We further confirm that average ratings increase as bottles get more expensive and that price is an important quality signal leading to the creation of distinct market segments within the product category, in line with previous findings (Gokcekus and Nottebaum Reference Gokcekus and Nottebaum2011; Oczkowski and Pawsey Reference Oczkowski and Pawsey2019). Further analysis could unveil whether this effect can be explained by a price-related bias in quality evaluation (Costanigro et. al., Reference Costanigro, Scozzafava and Casini2019; Jover et al., Reference Jover, Montes and Fuentes2004; Teuber, Reference Teuber2011) or by superior wine quality.
The results of this analysis represent an important starting point to better understand wine value perception based on two ways of capturing it hedonic prices and consumer ratings, which have been little explored but may contain useful insights to practitioners and academics.
Acknowledgments
The authors would like to thank the anonymous reviewers for their constructive comments, which contributed significantly to improving the quality of the manuscript. In addition, they extend their gratitude to the participants of the 4th Alliance for Research on Wine & Hospitality Management Workshop, particularly Prof. Olivier Gergaud and the paper discussant Luigi Palumbo, for providing valuable insights. This work has been developed in the framework of and supported by the AGRICOMPET PRIMA project.
Competing interests
None.


 Open access