


INTRODUCTION
Why We Need a China Innovation Capacity Growth Index
In the final chapter of China's Innovation Challenge, Lewin, Kenney, and Murmann (Reference Lewin, Kenney and Murmann2016) concluded that at present one could not predict whether China will overcome the middle-income trap by catching up with the innovation capacity of the most economically advanced nations such as the United States. To get a better reading on whether optimistic or pessimistic scenarios articulated in the book would likely turn out to be true, we argued that it was necessary to construct a China Innovation Capacity Growth Index (CICGI), which needs to be tracked over time. By tracking a set of indicators over time, we can get a systematic account of how China's innovation capacity is developing. In this article, we present data showing how China's innovation capacity has changed by comparing the indices from 2015 and 2020. The recommendation is to construct the index every few years and thereby obtain a reading on whether China's innovation capacity is growing, stagnating, or decreasing. In the supplementary Technical Appendix, we describe in detail the justification for the various indicators and the data sources used for the indicators.
THE EIGHT FACTOR INDEX
The main goal of the CICGI is to provide a lean and intuitive index that takes on the most pressing aspects of an economy's innovation system and is tailored to the specifics of China's innovation challenge. The index therefore includes only eight indicators, some of which are in line with measures chosen by established innovation indices, while others are more specifically tailored to China and its unique characteristics as identified by Lewin, Kenney, and Murmann (Reference Lewin, Kenney and Murmann2016). Whereas popular innovation indices provide a more comprehensive, less issue-oriented tool and first and foremost serve to benchmark against other economies, the CICGI aims to draw attention to unique issues in China's innovation system that might go unnoticed in more standardized indices. The CICGI can thus be seen as a tool to complement traditional innovation indices such as the Global Innovation Index (GII) or the Global Competitiveness Report (GCR). Given the index's lean setup as well as its focus on China, the eight indicators are also selected for data consistency between the editions and, therefore, enable comparison over time. While the CICGI does account for measures that are not covered by other larger indices, we validated its findings in line with popular innovation indices while drawing attention to specific strengths and weaknesses in Chinese innovation capacity. Therefore, the CICGI is a suitable measure for gaining a focused overview of China's innovation capacity growth in past years and going forward.
The eight indicators included in the CICGI are: (1) Share of new-to-world innovations, (2) Chinese articles in leading international journals, (3) Intellectual property (IP) system effectiveness, (4) Share of resources flowing to non-state-owned enterprises, (5) Ease of starting a business, (6) Level of financing for start-ups and small- and medium-sized enterprises, (7) Institutionalized trust, and (8) Autonomy of Chinese universities. Whereas the majority of indicators are intuitive in their meaning and represent well-known measures for innovation capacity, some of them, given their tailoring to specific characteristics of the Chinese economy, are briefly introduced below. For more extensive information on each of the indicators included in the index, we refer the reader to our supplementary Technical Appendix.
Intellectual property (IP) system effectiveness, other than share of new-to-world innovation, does not measure IP output, yet considers the perceived level of protection of an economy's inventions. It is measured as an equally weighted average of three survey questions[Footnote 1] to produce the CICGI's rank. Given China's historically bad reputation in IP protection, this indicator is included in the CICGI to appropriately track China's success in building trust among its inventors.
The two indicators share of resources flowing to non-state-owned enterprises and level of financing for start-ups and small- and medium-sized enterprises are included to reflect and track the privileges for state-owned enterprises (SOEs) as well as bigger companies in the Chinese economy, which can restrict the growth of new and innovative firms.
Institutionalized trust measures the level of perceived corruption, given that weaknesses in China's infrastructure and procedural transparency have in the past led to high levels of corruption. With low levels of perceived corruption, appropriate allocation of resources is expected.
Lastly, autonomy of Chinese universities is included given the importance of universities for fostering innovation and administrative involvement of the Chinese government therein. The underlying assumption concludes that with increasing autonomy, the universities’ innovation output and quality are likely to increase and be better aligned with the private sector's needs. While these indicators might not be traditional measures in innovation capacity, they represent structural hurdles in China's innovation system due to its historical preference of SOEs and bigger companies, political influence on universities, as well as low confidence in the system of protection for IP.
The eight indicators of the CICGI do not yield a composite indicator,[Footnote 2] rather, each is to be taken into account on its own. Each indicator is scored from 0 to 100, with a higher score representing a better indicator performance. Conclusions can be drawn from the CICGI by comparing an indicator's score between different editions.
COMPARING 2015 AND 2020
The following section illustrates each of the CICGI's indicators’ performance between 2015 and 2020 as well as summarizes the overall findings.
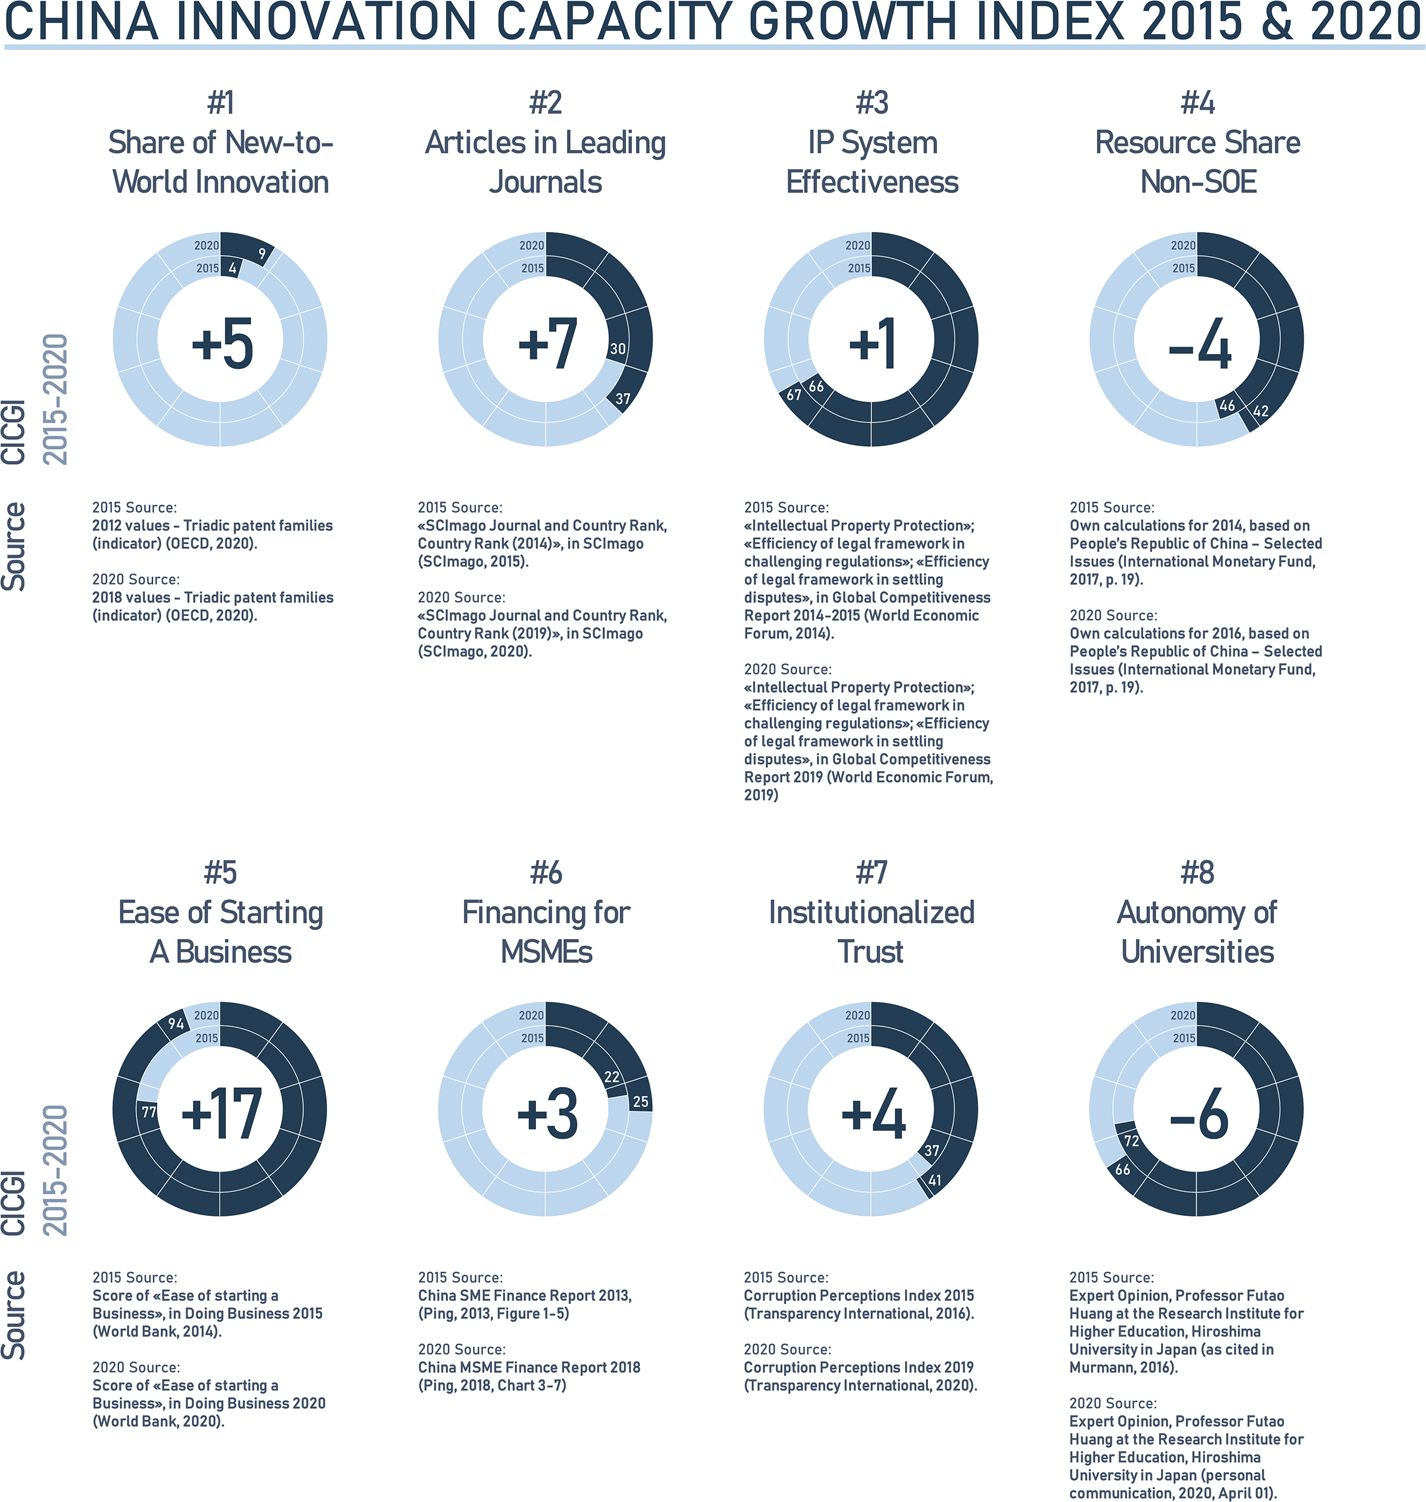
Regarding indicator #1, comparing the first edition CICGI score to the second edition score, the CICGI finds a significant increase of around 5 percentage points in China's global share of triadic patents filed from 2015 to 2020 (OECD, 2020). In the first edition CICGI, China was attributed 3.6% (2012 data, based on OECD, 2020) of triadic inventions filed by inventors residing in China, whereas in the second edition this has increased to 9.3% (2018 data, based on OECD, 2020). In six years, China has been able to more than double its global share of inventions. The World Intellectual Property Organization (WIPO) (2020) furthermore suggests that China in 2019 has become the top filer of international patents, with the Chinese company Huawei Technologies surpassing the number of international patents filed by any other company. This suggests China is successfully investing in new-to-world innovation.
Indicator #2, Chinese articles in leading international journals, shows China's h-index in relation to the top-performing economy of the index. The h-index accounts for both scientific productivity as well as impact by addressing number of citations of a country's publication activity. Both in 2014 as well as in 2019, the top-performing country was the United States. While in 2014 China's h-index was 30% of that of the United States (Mester, Reference Mester2016), China has increased this to 37% in 2019 (Scimago Lab, 2020), suggesting that China is catching up in producing scientifically relevant articles. Looking merely at the Chinese h-index, it has improved from 495 (2014) to 884 (2019). This can be partially related to the steep increase in publication activity in China, as for example in 2016, China for the first time accounted for more S&E (science and engineering) articles than the United States.
In indicator #3, Intellectual property system effectiveness, the perceived quality of a patent system is measured using three indicators from the GCR. The indicator's scores remain stable between the two editions, with a difference of only one CICGI score point: In the first edition CICGI a score of 66 is reported (based on Schwab & Sala-i-Martin, Reference Schwab and Sala-i-Martin2014), whereas in the second edition a score of 67 is reported (based on Schwab, Reference Schwab2019). The slight change in the overall score is impacted by the increase in perceived efficiency of the legal framework in challenging regulations, indicating that companies are increasingly able to challenge government actions and thus protect inventions.
Indicator #4, Share of resources flowing to non-state-owned enterprises, is based on IMF data to assess whether access by non-SOEs to financing is improving or decreasing by assessing the share of debt held by non-SOEs. The score of the 2015 CICGI is 46 (2014 data, based on IMF, 2017) whereas the more recent value for the second edition CICGI is a value of 42 (2016 data, based on IMF, 2017). This indicates that non-SOEs have less access to financing than SOEs in 2020 compared to 2015. Additional examination will determine whether it is in the interest of the PRC to allow further privatization and thus whether the share of resources flowing to SOEs will be an effective measure for China's innovation capacity.
Indicator #5, Ease of starting a business, covers another aspect regarding the potential to commercialize on inventions, using the World Bank Doing Business report. In the 2015 edition, China's CICGI score lies at 77 (2014 data, based on World Bank, 2014). The 2020 CICGI sets the ease of starting a business at 94 (2020 data, based on World Bank, 2020a).[Footnote 3] One reform contributing to the increase in performance is the full integration of the obtaining of company seals into Beijing's one-stop-shop concept for starting businesses (World Bank, 2020b). One more reason for the improvement comes from Li Keqiang, China's premier, who recognizes the Doing Business indicators as a core component of China's reform strategies (World Bank, 2020b).
Indicator #6, Level of financing for start-ups and small- and medium-sized enterprises, covers the access of smaller companies to finance. The CICGI score is created using the percentage of generalized MSE (medium-sized enterprises) loans to total loans of major banking financial institutions. The 2015 CICGI includes a score of 22 (2013 Data, based on Ping, Reference Ping2013), whereas the 2020 CICGI shows a score of 25 (2018 data, based on Ping, Reference Ping2018). This indicates a positive development in the access to financing for MSMEs (micro-, small-, and medium-sized enterprises), encouraging the MSMEs to unleash their innovation capacity.
Indicator #7, Institutionalized trust, tracks the level of trust in Chinese society, an important catalyst for effective innovation, using the Corruption Perception Index (CPI). A CICGI score of 37 (2015 data, based on Transparency International, 2016) is identified in the first edition, while the more recent CICGI edition reports a score of 43 (2019 data, based on Transparency International, 2020). Therefore, a slight increase in China's perceived corruption is noted. The 2019 CPI report names two hurdles in battling corruption within the PRC, and more generally the Asia Pacific region: the restricted participation in public affairs and decision making, as well as restrictions on free speech (Transparency International, 2020). Despite various policies and campaigns having been put into place in recent years, the country's level of corruption is still perceived above the global average (Transparency International, 2020).
Indicator #8, Autonomy of Chinese universities, measures the universities’ capability of matching market needs autonomously from the Chinese state for the best possibilities of producing innovation. The indicator is evaluated for both editions by expert Professor Futao Huang, resulting in a 2015 CICGI score of 72 (2016 data, based on Futao Huang, personal communication, 2016) and a 2020 CICGI score of 66 (2020 data, based on Futao Huang, personal communication, 2020, April 01) based on the OECD instrument to measure autonomy of universities in different countries. With the observed decrease in indicator #8, Autonomy of Chinese universities, a worse performance of China's universities in matching curriculums with market needs is expected. Furthermore, Professor Huang stresses differences in autonomy between more and less socially and academically renowned universities. His assessment attributes more autonomy to more renowned universities (Futao Huang, personal communication, 2020, April 01).
CONCLUSION
To summarize the CICGI's findings between the two editions, China experienced innovation capacity growth between 2015 and 2020 in six out of eight indicators, indicating an overall positive development of China's innovation capacity. The most significant improvement is reported in indicator #5, ease of starting a business, where China is approaching the efficient frontier. On the other hand, the CICGI notes a decrease in both metrics of resource share to non-SOEs and autonomy of universities. It will be interesting to see if the Chinese government will explicitly try to improve these areas again in the coming years. All in all, the CICGI clearly indicates China has been increasing innovation capability over the past five years.
Two reviewers suggested that in the future the Chinese innovation system may change and some indicators may not be as useful as they have been in the past to track improvements in the Chinese innovation system. We are open to replacing some indicators in the CICGI in future editions if we become convinced there are more relevant indicators, given changes to the Chinese economy and society. For example, indicator #5, ease of starting a business, may lose its diagnostic value as China reaches the global frontier on that indicator. In that case one could make room for another indicator that tracks a more relevant bottleneck in China's innovation system. We hope that our short article will lead to a productive debate among scholars on what small set of indicators will be best able to track the growth of China's innovation capacity. We have presented those that we deem most relevant today.

Target article
China Innovation Capacity Growth Index 2015 and 2020
Related commentaries (2)
Commentary on ‘China Innovation Capacity Growth Index 2015 and 2020’
Measuring China's Innovation Capacity: An Important Unmeasurable Factor and a New Contextual Factor