


Challenges associated with the measurement of complex phenomena pervade social science research. That said, some phenomena seem as though they should be reasonably straightforward to measure, especially given the availability of apparently reliable, government-provided data.
The state of the US manufacturing sector would seem to fall into this category. The US Bureau of Labor Statistics (BLS), which has a mandate to provide ‘gold-standard data’ that are ‘accurate, objective, relevant, timely, and accessible’ (www.bls.gov), provides extensive data that can be used to gain insights into various aspects of US economic activity. Data are readily available, for example, to facilitate delving into historical issues of productivity and employment in the US manufacturing sector.
As shown in Figure 1 of Contractor (Reference Contractor2021, in this issue), prior to the current pandemic, US manufacturing output was nearly as high as it has ever been. On the other hand, Figure 2 of the same commentary tells a different story about employment. In December 2019, employment in the US manufacturing sector was estimated at 12,866,000[Footnote 1]; this is approximately the same level as December 1941 (12,876,000), when the US population was about 40% of its current size. There has been a precipitous drop since the start of the 21st century. The loss of approximately 4.4 million manufacturing jobs (17,284,000 in January 2000 to 12,866,000 in December 2019) represents more people than the population of any US city other than New York; a further 613,000 manufacturing jobs had also been lost as of November 2020. These job losses have affected a wide swathe of industries, in contrast to the more industry-specific (e.g., steel, automotive assembly) job losses of the 1980s, and have occurred simultaneously with an increase in the working-age population in the US (unlike, e.g., Japan, where lower manufacturing-sector employment has been coincident with a shrinking labor force).
This fall in manufacturing-sector employment is fully consistent with the US economy's well-documented shift toward services. However, it has substantial implications for the standard of living, especially for lower-skilled employees. For generations of US workers, manufacturing jobs provided the basis for the expectation that each generation would be better off than the previous one. This had much to do with attractive wage rates for work that was difficult but that did not require higher education or deep technical expertise. Working in US automotive assembly plants or steel mills, for example, was demanding, but offered financial security for employees and their families. Arguably more important, and quite specific to the US, were the non-wage benefits, typified by the comprehensive health insurance and pension benefits that have long been available to employees in US auto assembly plants. Often-adversarial relationships between the companies and trade unions contributed a great deal to what became intergenerational upward mobility. Many of these jobs are now gone.
What explains the decades-long decline in employment in the US manufacturing sector? Contractor (Reference Contractor2021) raises several potential causal mechanisms: globalization and the offshoring of manufacturing jobs, increases in productivity that have been enabled by automation and other technological advances (e.g., information and communications technology), and a power shift between industrial labor unions and companies. It seems clear that all have contributed, but there is little agreement regarding their relative importance. Many economists, for example, place the blame primarily on automation, while many other scholars and commentators attribute manufacturing job losses to globalization and offshoring, with a particular emphasis on China. In a notable turnaround from his earlier work, Krugman (Reference Krugman2018) highlights the impact – unforeseen in the 1990s – that China's swift development into an export-focused market economy and a manufacturing powerhouse has had on employment in the US manufacturing sector.
However, the complexity of any national economy – especially one as embedded in the global economy as the US – makes causal inferences regarding individual mechanisms extremely difficult to justify. One major issue is associated with the data that are used to understand complex phenomena. Averages mask a great deal of important detail, and nationally aggregated macroeconomic data hide nuances associated with categories such as industry and location. For example, job losses in one state that are offset by increases in another create no change in national data. However, there is often a ‘stickiness’ associated with home states. During the severe downturn in the US automotive industry of the 1980s, surprisingly large numbers of former automotive assembly workers chose to remain in the ‘rust belt’, rather than relocating to distant states to seek employment in other industries (e.g., the then-expanding oil industry in Texas), despite very limited job options at home. In addition to family ties and psychic distance[Footnote 2], such downturns in dominant local industries often depress the real estate market, saddling workers with unsellable houses and effectively anchoring them in place. National data hide much of the story.
Assumptions also matter. Discussing the particularly severe impact on lower-skilled US workers, resulting from the unforeseen interaction of hyper-globalization and the rapid increase in the participation of developing economies – especially China – in global manufacturing and trade, Krugman (Reference Krugman2018: 9) notes,
The 90s consensus, however, focused almost entirely on Heckscher-Ohlin-type analysis, asking how the growth of trade had affected the incomes of broad labor classes, as opposed to workers in particular industries and communities. This was, I now believe, a major mistake – one in which I shared.
Stratifying data by location is relatively straightforward. Teasing out industry effects can be much more complicated. Houseman (Reference Houseman2018: 2) provides compelling arguments with respect to the importance of considering industry-level data for understanding the state of US manufacturing, noting that what appears to be strong growth in aggregate productivity is ‘driven by a relatively small sector – computers and electronic products, which account for only about 13 percent of value-added in manufacturing’. In addition to driving the aggregate data, this industry represents an outlier in other key dimensions, making it extremely influential. For example, while real output in the manufacturing sector, apart from the computer industry, increased by approximately 45% during 1977–2016, the corresponding figure for the computer industry itself was 19,257% (Houseman, Reference Houseman2018: 11). This period has also seen much of the production in the computer industry shift from the US to Asia. Confounding matters even further is the fact that productivity in the computer sector is treated rather specifically in US government statistics, and is more reflective of developments in computing strength than of automation in production processes (see Houseman, Bartik, & Sturgeon [Reference Houseman, Bartik, Sturgeon, Houseman and Mandel2015] for more detail).
Houseman (Reference Houseman2018) demonstrates the huge impact that the computer industry has on US aggregate statistics pertaining to both output and productivity, and how this distorts the interpretation of seemingly clear data. The danger of excessive aggregation comes into sharp focus when considering manufacturing employment growth rates. Table 1 provides a stark example, considering the difference between the private and manufacturing sectors.
Table 1. Difference in employment growth rates (private – manufacturing), 1977–2016
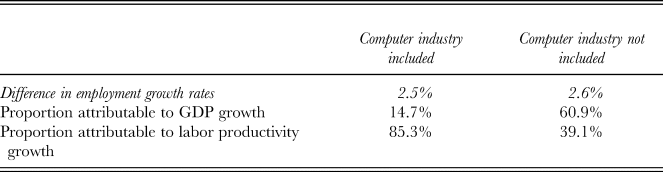
Note: Adapted from Houseman (Reference Houseman2018: 39).
While the overall difference in employment growth rates does not change much, whether or not the computer industry is included, the apparent explanatory mechanisms are very different. For the more aggregated data, the driver appears to be labor productivity growth. However, when the computer industry is excluded, the driver is GDP growth. Considering 2007–2016, separating out the computer industry reveals that the approximately 1.9% difference in employment growth rates is completely attributable to GDP growth. The upshot of the combination of measurement-related anomalies and excessive aggregation of the data is that ‘there is no prima facie evidence that productivity growth is entirely or primarily responsible for the relative or absolute decline in manufacturing employment’ (Houseman, Reference Houseman2018: 14).
To complicate matters even further, measures of labor productivity growth are driven by more than solely automation. Outsourcing – both foreign and domestic – provides a clear example. Labor productivity measures improve when outsourced labor costs are lower than the comparable in-house labor costs. This is generally the intention associated with outsourcing, and is important, especially as labor-intensive activities are arguably more likely to be subject to offshoring to countries that offer lower labor costs. The fine-slicing of global value chains (e.g., Buckley & Strange, Reference Buckley and Strange2015) – while very understandable from a business perspective – is thus not well-captured in US national-level productivity statistics (Houseman, Reference Houseman2018), meaning that straightforward explanations for the forces that are driving the decline in employment levels in the US manufacturing sector are unlikely to reflect the complex reality.
It seems difficult to completely dismiss the idea that trade has played a role in the steep drop in employment in the US manufacturing sector, especially in light of the sharp rise in imports from China since its accession to the WTO in 2001. Krugman (Reference Krugman2018: 8) notes that the rapid change in the US trade deficit ‘explains more than half of the roughly 20 percent decline in manufacturing employment between 1997 and 2005’. Whether the imports are the output of foreign firms or of US firms that have offshored their production is important to US-based multinationals, but probably matters very little to US workers whose manufacturing jobs have disappeared. Former automotive and steel production employees probably do not care much about the nuances of what has created fundamental shifts in the US and other western economies, but we academics should – and do – care about such details. This necessitates a very deep understanding of the available data, which has characteristics that are far from obvious. We also need to bear in mind that aggregate data mask great deal of specific information, some of which is necessary to develop deeper insights, and that causal attributions are extremely difficult in a complex system.

Target article
A Decline in US Manufacturing Because of Globalization and China? Don't Believe This Fake News
Related commentaries (1)
The Decline of US Manufacturing: Issues of Measurement