Hostname: page-component-78c5997874-94fs2 Total loading time: 0 Render date: 2024-11-19T09:18:17.023Z Has data issue: false hasContentIssue false

Deciphering the Complex Mineralogy of River Sand Deposits through Clustering and Quantification of Hyperspectral X-Ray Maps

Published online by Cambridge University Press:  14 April 2020

Aaron Torpy*
Affiliation:
CSIRO Mineral Resources, Clayton, VIC, Australia
Nicholas C. Wilson
Affiliation:
CSIRO Mineral Resources, Clayton, VIC, Australia
Colin M. MacRae
Affiliation:
CSIRO Mineral Resources, Clayton, VIC, Australia
Mark I. Pownceby
Affiliation:
CSIRO Mineral Resources, Clayton, VIC, Australia
Pradip K. Biswas
Affiliation:
Institute of Mining, Mineralogy and Metallurgy (IMMM), Bangladesh Council of Scientific and Industrial Research (BCSIR), Joypurhat, Bangladesh Department of Geology and Mining, University of Rajshahi, Rajshahi, Bangladesh
Md Aminur Rahman
Affiliation:
CSIRO Mineral Resources, Clayton, VIC, Australia Institute of Mining, Mineralogy and Metallurgy (IMMM), Bangladesh Council of Scientific and Industrial Research (BCSIR), Joypurhat, Bangladesh RMIT University, Melbourne, VIC, Australia
Mohammad N. Zaman
Affiliation:
Institute of Mining, Mineralogy and Metallurgy (IMMM), Bangladesh Council of Scientific and Industrial Research (BCSIR), Joypurhat, Bangladesh
*
*Author for correspondence: Aaron Torpy, E-mail: aaron.torpy@csiro.au
Get access

Abstract

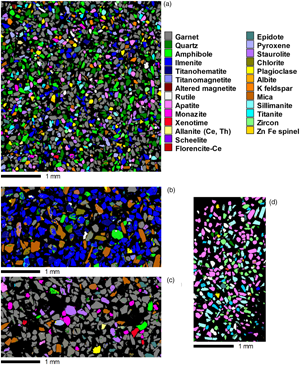
Alluvial mineral sands rank among the most complex subjects for mineral characterization due to the diverse range of minerals present in the sediments, which may collectively contain a daunting number of elements (>20) in major or minor concentrations (>1 wt%). To comprehensively characterize the phase abundance and chemistry of these complex mineral specimens, a method was developed using hyperspectral x-ray and cathodoluminescence mapping in an electron probe microanalyser (EPMA), coupled with automated cluster analysis and quantitative analysis of clustered x-ray spectra. This method proved successful in identifying and quantifying over 40 phases from mineral sand specimens, including unexpected phases with low modal abundance (<0.1%). The standard-based quantification method measured compositions in agreement with expected stoichiometry, with elemental detection limits in the range of <10–1,000 ppm, depending on phase abundance, and proved reliable even for challenging mineral species, such as the multi-rare earth element (REE) bearing mineral xenotime [(Y,REE)PO4] for which 24 elements were analyzed, including 12 overlapped REEs. The mineral identification procedure was also capable of characterizing mineral groups that exhibit significant compositional variability due to the substitution of multiple elements, such as garnets (Mg, Ca, Fe, Mn, Cr), pyroxenes (Mg, Ca, Fe), and amphiboles (Na, Mg, Ca, Fe, Al).

Type
Australian Microbeam Analysis Society Special Section AMAS XV 2019
Copyright
Copyright © Microscopy Society of America 2020

Access options

Get access to the full version of this content by using one of the access options below. (Log in options will check for institutional or personal access. Content may require purchase if you do not have access.)

References

Ball, GH & Hall, DJ (1965). Isodata, A Novel Method of Data Analysis and Pattern Classification. Menlo Park, CA: Stanford Research Institute.Google Scholar
Barbarand, J & Pagel, M (2001). Cathodoluminescence study of apatite crystals. Am Mineral 86(4), 473484.CrossRefGoogle Scholar
Bastin, GF & Heijligers, HJM (1991). Nonconductive specimens in the electron probe microanalyzer—a hitherto poorly discussed problem. In Electron Probe Quantitation, Heinrich, KFJ & Newbury, DE (Eds.), pp. 163175. Boston, MA: Springer US.CrossRefGoogle Scholar
Bastin, GF & Heijligers, HJM (1992 a). Present and future of light element analysis with electron beam instruments. Microbeam Anal 1(2), 6173.Google Scholar
Bastin, GF & Heijligers, HJM (1992 b). Quantitative EPMA of the ultra-light elements boron through oxygen. In Electron Microbeam Analysis, Boekestein, A & Pavićević, MK (Eds.), pp. 1936. Vienna: Springer.CrossRefGoogle Scholar
Biswas, PK, Ahmed, SS, Pownceby, MI, Haque, N, Alam, S, Zaman, MN & Rahman, MA (2018). Heavy mineral resource potential of Tista river sands, Northern Bangladesh. Appl Earth Sci 127(3), 94105.CrossRefGoogle Scholar
Boag, A, Hughes, A, Wilson, N, Torpy, A, MacRae, C, Glenn, A & Muster, T (2009). How complex is the microstructure of AA2024-T3? Corros Sci 51(8), 15651568.CrossRefGoogle Scholar
Bright, DS & Newbury, DE (1991). Concentration histogram imaging: A scatter diagram technique for viewing two or three related images. Anal Chem 63(4), 243A250A.Google Scholar
Castaing, R (1952). Application des Sondes Electroniques a une methode d'analyse ponctuelle chimique et cristallographique. Thesis. Universite de Paris.Google Scholar
Coleman, JM (1969). Brahmaputra river: Channel processes and sedimentation. Sediment Geol 3(2), 129239.CrossRefGoogle Scholar
Currie, LA (1968). Limits for qualitative detection and quantitative determination. Application to radiochemistry. Anal Chem 40(3), 586593.CrossRefGoogle Scholar
Deer, WA, Howie, RA & Zussman, J (1992). An Introduction to the Rock Forming Minerals. Harlow, UK: Pearson.Google Scholar
Delle Piane, C, Almqvist, BSG, MacRae, CM, Torpy, A, Mory, AJ & Dewhurst, DN (2015). Texture and diagenesis of Ordovician shale from the Canning Basin, Western Australia: Implications for elastic anisotropy and geomechanical properties. Mar Petrol Geol 59, 5671.CrossRefGoogle Scholar
Donovan, JJ, Lowers, HA & Rusk, BG (2011). Improved electron probe microanalysis of trace elements in quartz. Am Mineral 96(2–3), 274282.CrossRefGoogle Scholar
Fukunaga, K (1972). Introduction to Statistical Pattern Recognition. New York: Academic Press.Google Scholar
Gaft, M, Reisfeld, R & Panczer, G (2005). Luminescence Spectroscopy of Minerals and Materials. Berlin, Heidelberg, New York: Springer-Verlag.Google Scholar
Goldstein, J, Williams, D & Cliff, G (1986). Quantitative X-ray analysis. In Principles of analytical electron microscopy, Goldstein, J, Joy, DC & Romig, AD Jr. (Eds.), pp. 155217. New York: Springer.CrossRefGoogle Scholar
Grant, PR & White, SH (1978). Cathodoluminescence and microstructure of quartz overgrowths on quartz. Scanning Electron Microsc 1, 789794.Google Scholar
Grey, IE, MacRae, CM, Mumme, WG & Pring, A (2010). Townendite, Na8ZrSi6O18, a new uranium-bearing lovozerite group mineral from the Iliímaussaq alkaline complex, Southern Greenland. Am Mineral 95(4), 646650.CrossRefGoogle Scholar
Harrowfield, IR, MacRae, CM & Wilson, NC (1993). Chemical imaging in electron microprobes. Microbeam Anal 2, 547548.Google Scholar
Henke, BL, Lee, P, Tanaka, TJ, Shimabukuro, RL & Fujikawa, BK (1982). Low-energy x-ray interaction coefficients: Photoabsorption, scattering, and reflection: E = 100–2000 eV Z = 1–94. At Data Nucl Data Tables 27(1), 1144.CrossRefGoogle Scholar
Islam, MF (2016). The Teesta River and its basin area. In Water Use and Poverty Reduction, Islam, MF (Ed.), pp. 1343. Tokyo: Springer Japan.Google Scholar
Jercinovic, M, Williams, M, Allaz, J & Donovan, J (2012). Trace analysis in EPMA. In IOP Conference Series: Materials Science and Engineering, 15–19 May 2011, Angers, France, p. 012012. IOP Publishing.Google Scholar
Kalceff, MAS & Phillips, MR (1995). Cathodoluminescence microcharacterization of the defect structure of quartz. Phys Rev B 52(5), 31223134.CrossRefGoogle ScholarPubMed
Khalil, GM (1990). Floods in Bangladesh: A question of disciplining the rivers. Nat Hazards 3(4), 379401.CrossRefGoogle Scholar
Kotula, PG, Keenan, MR & Michael, JR (2003). Automated analysis of SEM X-ray spectral images: A powerful new microanalysis tool. Microsc Microanal 9(1), 117.CrossRefGoogle ScholarPubMed
Kuisma-Kursula, P (2000). Accuracy, precision and detection limits of SEM–WDS, SEM–EDS and PIXE in the multi-elemental analysis of medieval glass. X-Ray Spectrom 29(1), 111118.3.0.CO;2-W>CrossRefGoogle Scholar
Leeman, WP, MacRae, CM, Wilson, NC, Torpy, A, Lee, C-TA, Student, JJ, Thomas, JB & Vicenzi, EP (2012). A study of cathodoluminescence and trace element compositional zoning in natural quartz from volcanic rocks: Mapping titanium content in quartz. Microsc Microanal 18(6), 13221341.CrossRefGoogle ScholarPubMed
Leeman, WP, Vicenzi, EP, MacRae, CM, Wilson, NC, Torpy, A & Lee, CT (2008). Systematics of cathodoluminescence and trace element compositional zoning in natural quartz from volcanic rocks: Ti mapping in Quartz. Microsc Microanal 14(S2), 3839.CrossRefGoogle Scholar
Legge, GJF & Hammond, I (1979). Total quantitative recording of elemental maps and spectra with a scanning microprobe. J Microsc 117(2), 201210.CrossRefGoogle Scholar
Lenz, C, Nasdala, L, Talla, D, Hauzenberger, C, Seitz, R & Kolitsch, U (2015). Laser-induced REE3+ photoluminescence of selected accessory minerals—an “advantageous artefact” in Raman spectroscopy. Chem Geol 415, 116.CrossRefGoogle Scholar
Love, G, Cox, MGC & Scott, VD (1974). Electron probe microanalysis using oxygen x-rays: I. Mass absorption coefficients. J Phys D 7(15), 21312141.CrossRefGoogle Scholar
MacQueen, J (1967). Some methods for classification and analysis of multivariate observations. In Proceedings of the Fifth Berkeley Symposium on Mathematical Statistics and Probability, Oakland, CA, USA, pp. 281–297.Google Scholar
MacRae, C, Wilson, N, Torpy, A & Rose, T (2015). Chlorine microanalysis—Stand back and light the blue touch paper. In AMAS XIII—13th Biennial Australian Microbeam Analysis Symposium, Hobart, Australia, February 9–15, pp. 142–143.Google Scholar
MacRae, CM & Wilson, NC (2008). Luminescence database I—minerals and materials. Microsc Microanal 14(2), 184204.CrossRefGoogle ScholarPubMed
MacRae, CM, Wilson, NC, Johnson, SA, Phillips, PL & Otsuki, M (2005). Hyperspectral mapping—combining cathodoluminescence and X-ray collection in an electron microprobe. Microsc Res Tech 67(5), 271277.CrossRefGoogle Scholar
Newbury, DE & Ritchie, NW (2015). Performing elemental microanalysis with high accuracy and high precision by scanning electron microscopy/silicon drift detector energy-dispersive X-ray spectrometry (SEM/SDD-EDS). J Mater Sci 50(2), 493518.CrossRefGoogle Scholar
Niculae, A, Bechteler, A, Eckhardt, R, Hermenau, K, Liebel, A, Lutz, G, Soltau, H & Strüder, L (2016). Novel silicon drift detector devices for ultra-fast, high-resolution X-ray spectroscopy. Microsc Microanal 22(S3), 4041.CrossRefGoogle Scholar
Pouchou, J-L & Pichoir, F (1991). Quantitative analysis of homogeneous or stratified microvolumes applying the model “PAP”. In Electron probe quantitation, Heinrich, KFJ & Newbury, DE (Eds.), pp. 3175. Boston, MA: Springer.CrossRefGoogle Scholar
Pownceby, MI, MacRae, CM & Wilson, NC (2007). Mineral characterisation by EPMA mapping. Miner Eng 20(5), 444451.CrossRefGoogle Scholar
Pownceby, MI, Sparrow, GJ, Aral, H, Smith, LK & Bruckard, WJ (2015). Recovery and processing of zircon from Murray Basin mineral sand deposits. Miner Process Extr Metall 124(4), 240253.CrossRefGoogle Scholar
Rahman, A, Haque, N, Pownceby, MI, Bruckard, WJ & Zaman, MN (2016). A preliminary techno-economic evaluation of the processing of valuable heavy mineral sands from the Brahmaputra River Basin. In Proceedings of the 1st International Conference on Engineering Materials and Metallurgical Engineering, Dhaka, Bangladesh, Gafur MA (Ed.).Google Scholar
Ritchie, NWM, Newbury, DE & Davis, JM (2012). EDS measurements of X-ray intensity at WDS precision and accuracy using a silicon drift detector. Microsc Microanal 18(4), 892904.CrossRefGoogle ScholarPubMed
Ritchie, NWM, Newbury, DE, Lowers, H & Mengason, M (2018). Exploring the limits of EDS microanalysis: rare earth element analyses. IOP Conf Series 304, 012013.CrossRefGoogle Scholar
Schamber, F (1973). A new technique for deconvolution of complex X-ray energy spectra. In Proceedings of 8th National Conference on Electron Probe Analysis. New Orleans: Electron Probe Analysis Society of America.Google Scholar
Statham, PJ (2006). Pile-up correction for improved accuracy and speed of X-ray analysis. Microchim Acta 155(1), 289294.CrossRefGoogle Scholar
Stevens-Kalceff, MA (2009). Cathodoluminescence microcharacterization of point defects in α-quartz. Mineral Mag 73(4), 585605.CrossRefGoogle Scholar
Torpy, A, MacRae, CM, Wilson, NC & Clout, J (2014). Quantitative analysis of vanadium in titanomagnetite ore using hyperspectral X-ray mapping. In Proceedings of the 23rd Australian Conference on Microscopy and Microanalysis/International Conference on Nanoscience and Nanotechnology (ACMM23/ICONN2014), Adelaide, South Australia.Google Scholar
Torpy, A, Wilson, NC & MacRae, CM (2008). Hyperspectral mapping in a FEG-EPMA. In Proceedings of the 20th Australian Conference on Microscopy and Microanalysis (ACMM-20)/4th Congress of the International Union of Microbeam Analysis Societies (IUMAS-IV), Perth, Western Australia, Griffin BJ (Ed.), pp. 54–55.Google Scholar
Torpy, A, Wilson, NC, Townend, R & MacRae, CM (2009). Analysis of trace elements in complex mineral ores by EPMA mapping. In Proceedings of the 10th Symposium of the Australian Microbeam Analysis Society (AMAS-X), Adelaide, South Australia.Google Scholar
Vekemans, B, Janssens, K, Vincze, L, Aerts, A, Adams, F & Hertogen, J (1997). Automated segmentation of μ-XRF image sets. X-Ray Spectrom 26(6), 333346.3.0.CO;2-D>CrossRefGoogle Scholar
Ward, JHJ (1963). Hierarchical grouping to optimize an objective function. J Am Stat Assoc 58(301), 236244.CrossRefGoogle Scholar
Wark, DA & Watson, EB (2006). TitaniQ: a titanium-in-quartz geothermometer. Contrib Mineral Petrol 152(6), 743754.CrossRefGoogle Scholar
Wilson, N & MacRae, C (2005). An automated hybrid clustering technique applied to spectral data sets. Microsc Microanal 11(S02), 434435.CrossRefGoogle Scholar
Wilson, N, MacRae, C & Torpy, A (2008). Analysis of combined multi-signal hyperspectral datasets using a clustering algorithm and visualisation tools. Microsc Microanal 14(2), 764765.CrossRefGoogle Scholar
Wilson, NC, MacRae, CM, Torpy, A, Davidson, CJ & Vicenzi, EP (2012). Hyperspectral cathodoluminescence examination of defects in a carbonado diamond. Microsc Microanal 18(6), 13031312.CrossRefGoogle Scholar
Zaluzec, N, Kirkland, E, Isaacson, M, Hunt, J, Fiori, C & Egerton, R (1991). EMSA/MAS standard format for spectral data exchange. EMSA Bull 21, 3541.Google Scholar
Zaman, MM, Rajib, M, Kabir, MZ, Deeba, F, Rana, SM, Hossain, SM, Latif, SA & Rasul, MG (2016). Presence of uranium and thorium in zircon assemblages separated from beach sands of Cox's Bazar, Bangladesh. J Sci Technol Environ Inform 3(01), 161169.CrossRefGoogle Scholar
Zschornack, GH (2007). Handbook of X-Ray Data. Berlin: Springer-Verlag.Google Scholar