


Introduction
Atom probe tomography (APT) is a useful technique for measuring local composition on a nanometer scale. The method relies on identifying, by time-of-flight mass spectroscopy, and positioning individual atoms that have been ionized by field evaporation from the tip of a needle-shaped specimen (Miller & Forbes, Reference Miller and Forbes2014). The specimen is held at a high DC potential and field evaporation is initiated by either a voltage pulse or a laser pulse that also serves as the start signal for the time-of-flight measurement. The detector consists of a channel plate, which turns the incoming ion to an electron burst, and a delay-line for positioning the electron burst. The x- and y-coordinates are obtained from timing signals from two crossed delay-lines, and commonly a third delay-line (at 45°) is used for redundancy (Jagutzki et al., Reference Jagutzki, Cerezo, Czasch, Dorner, Hattas, Huang, Mergel, Spillmann, Ullmann-Pfleger, Weber, Schmidt-Bocking and Smith2002). The position of the atom in the specimen is calculated from the impact position on the detector using a reconstruction algorithm, basically assuming a point-projection, with some further modifications (Gault et al., Reference Gault, Moody, Cairney and Ringer2012). The detection efficiency is mainly governed by the open area ratio of the channel plate, but the pulse handling electronics and algorithms also have an influence, which varies, depending on the design of the instrument, and today it ranges from ~37 to ~80% for the commercially available ones (Prosa et al., Reference Prosa, Geiser, Lawrence, Olsen and Larson2014; Martin et al., Reference Martin, London, Jenkins, Hopkin, Douglas, Styman, Bagot and Moody2017). The most common type of channel plate has an open area ratio of about 60%, but channel plates with 90% have become available in recent years (Matoba et al., Reference Matoba, Takahashi, Io, Koizumi and Shiromaru2012). Many instruments are equipped with a so-called reflectron for improved mass resolution when using voltage pulsing, which typically decreases the detection efficiency further, as it consists of a wire mesh, with a transmission below unity, that the ions pass twice.
Obviously, it is desirable to have as high a detection efficiency as practical, to obtain a reconstruction that resembles the real material as closely as possible. The uncertainty in composition originating from counting statistics becomes smaller as the detection efficiency is increased, and thereby it becomes possible to determine the composition of very small features in the microstructure. In some cases, though, the accuracy of concentration measurements is significantly reduced, for example when analyzing carbides (Thuvander et al., Reference Thuvander, Weidow, Angseryd, Falk, Liu, Sonestedt, Stiller and Andrén2011), nitrides (Tang et al., Reference Tang, Gault, Ringer and Cairney2010), silicides (Kinno et al., Reference Kinno, Akutsu, Tomita, Kawanaka, Sonehara, Hokazono, Renaud, Martin, Benbalagh, Sallé and Takeno2012), or semiconductors (Müller et al., Reference Müller, Gault, Smith and Grovenor2011). In the case of carbides, the main reason why the measured carbon concentration is usually too low is the limited capability of the detector system to register all ions from the same pulse, resulting in losses due to detector pile-up. The ions have a strong tendency of being field evaporated in groups, which results in several ions hitting the detector in close proximity to each other and within a very short time span. The fraction of carbon ions in these multiple hit events is higher than expected from the concentration, leading to a preferential loss of C in the analysis. In the case of cementite (Fe3C), however, the measured C concentration is often too high, but in this case the deviation has also been attributed to preferential loss of Fe ions (Marceau et al., Reference Marceau, Choi and Raabe2013). Another element that is strongly affected by multiple events is boron (Da Costa et al., Reference Da Costa, Wang, Duguay, Bostel, Blavette and Deconihout2012; Meisenkothen et al., Reference Meisenkothen, Steel, Prosa, Henry and Prakash Kolli2015). The dead-time of the detector, together with the efficiency of the process to resolve multiple hits, are the factors governing the severity of the effect.
In some cases, it is possible to use only isotopes of low, and known, abundance for quantification, as the probability is low that more than one such ion from a single pulse hits the detector. This has been demonstrated for the analysis of carbides, using the 13C isotope (Thuvander et al., Reference Thuvander, Weidow, Angseryd, Falk, Liu, Sonestedt, Stiller and Andrén2011). An elegant statistical correction method for determining isotope abundance ratios, even in the presence of detector pile-up effects, was developed by Stephan et al. (Reference Stephan, Heck, Isheim and Lewis2015), but it is not straightforward to implement this method for analyses containing multiple phases and elements. For the older 1D atom probe technique, a correction method based on measurement of the time difference of detected pairs was presented by Rolander & Andrén (Reference Rolander and Andrén1989), but this method cannot easily be applied to 3D APT. To some extent it is possible to decrease the fraction of multiple events by changing the analysis conditions. When using laser pulsing, the fraction decreases slightly if the laser pulse energy is increased, as shown for Ti(C, N) (Angseryd et al., Reference Angseryd, Liu, Andrén, Gerstl and Thuvander2011) and Ti–Si–N (Tang et al., Reference Tang, Gault, Ringer and Cairney2010).
Yao et al. (Reference Yao, Gault, Cairney and Ringer2012) have investigated the nature of the detected multiple events. It was shown that the C ions comprising a multiple hit were typically separated by <5 nm, when analyzing a low-alloyed steel, and similar results have also been observed for WC (Thuvander et al., Reference Thuvander, Kvist, Johnson, Weidow and Andrén2013). Yao et al. also observed a strong crystallographic dependence on the positions of C ions from multiple events. The influence of crystallography on the field evaporation behavior of an Al-alloy was also studied by De Geuser and co-workers. They concluded that the multiple events were caused by correlated evaporation, particularly at low-indexed poles (De Geuser et al., Reference De Geuser, Gault, Bostel and Vurpillot2007). The possibility of extracting information from the multiple hit events has been investigated in detail by Saxey, who also observed molecular dissociation among the multiple hit events in GaN (Saxey, Reference Saxey2011).
The number of multiple hits and the number of ions detected in multiple hit events increase as the detection efficiency increases (Thuvander et al., Reference Thuvander, Kvist, Johnson, Weidow and Andrén2013; Peng et al., Reference Peng, Vurpillot, Choi, Li, Raabe and Gault2018). Therefore, the negative effects of multiple events can be mitigated by decreasing the detection efficiency. This was demonstrated by Thuvander et al. when they inserted a fine-meshed grid in the flight path of the instrument, giving a detection efficiency of only 5%, and thereby the measured concentration of C in WC increased from 48.2 to 49.8 at.%, while the fraction of multiple events decreased from 47 to 9% (Thuvander et al., Reference Thuvander, Kvist, Johnson, Weidow and Andrén2013). In that case, a large grain of WC was analyzed, so the decrease in the number of detected atoms had a negligible influence on the precision of the measured C concentration. In the current paper, the possibility of using the same approach for increasing the measured C concentration in APT analysis of small secondary MC carbides is explored. An increased C concentration, from 26 to 35%, was also observed when comparing two types of instruments with a detection efficiency of 52 and 37%, respectively (Martin et al., Reference Martin, London, Jenkins, Hopkin, Douglas, Styman, Bagot and Moody2017). In their study, small precipitates of M2C were analyzed. The motivation for improving the quantitative measurement of C in steel carbides is to both be able to determine the type of carbide, and measure any sub-stoichiometry, which is very challenging. Another area where minimizing the effect of detector pile-up is important, is for determining the isotopic ratio in meteoritic nanodiamonds (Heck et al., Reference Heck, Stadermann, Isheim, Auciello, Daulton, Davis, Elam, Floss, Hiller, Larson, Lewis, Mane, Pellin, Savina, Seidman and Stephan2014; Lewis et al., Reference Lewis, Isheim, Floss and Seidman2015).
Materials and Methods
Two tool steels, A and B, were analyzed in this study. Steel A had the composition 0.3Si–1.7Cr–1.1Mn–2.7Mo–1.1V–0.4C and steel B 0.3Si–2.6Cr–0.8Mn–2.2Mo–0.9V–0.4C (wt%). After austenization, the steels were tempered to form secondary carbides. Steel A was tempered according to the scheme 2 × 2 h at 630°C plus 30 h at 650°C, in order to form relatively large secondary carbides. Steel B was tempered 2 × 2 h at 625°C to form small secondary carbides. The secondary carbides can principally be MC (based on VC) and M2C (based on Mo2C), but no separation into two populations was observed in the APT analyses, and it is assumed that all analyzed secondary carbides are MC, containing roughly the same amount of V and Mo, with a small addition of Cr. In this type of steel, M2C typically has a much higher Mo/V ratio than was observed for the carbides in this study (Andersson, Reference Andersson2011), and also the measured C concentration should be lower, below 33 at.% due to detector pile-up. The C concentration of binary VC at 600–700°C can be in the range of about 45–47 at.%, from the binary phase diagram (Toth, Reference Toth1971).
A standard Si(Sb) sample [a so-called pre-sharpened microtip (PSM) array] from CAMECA was used for checking the influence of using a grid-local electrode (GLE) on the detector hit map (also called desorption or evaporation maps), and also for demonstrating the effect of detection rate on the evaporation field.
The steels were ground to a thickness of 0.3 mm, and blanks with dimensions of 0.3 × 0.3 × 15 mm3 were cut using a low-speed saw. Needle-shaped specimens for APT were prepared using the standard two-step electropolishing method (Miller & Forbes, Reference Miller and Forbes2014). In the first step a neck was formed using a floating layer electrolyte consisting of 10% perchloric acid in 20% glycerol and 70% methanol on top of Galden®. In the second step, the whole blank was electropolished in 2% perchloric acid in 2-butoxyethanol until the blank parted at the position of the neck, resulting in an automatic turn-off of the current, giving two needle-shaped specimens. Finally, the specimens were electropolished using short pulses (2 ms) in the second electrolyte, in order to remove any residue at the surface. In all electropolishing steps the voltage was 18–20 V.
The instrument used was a LEAP 3000X HR (Imago Scientific Instruments, Madison, WI, USA). As the specimens are prone to fracturing during voltage pulsing, presumably because of the presence of carbides, the analyses were performed in laser pulsing mode with a laser pulse energy of 0.30 nJ, with the temperature set at 50 K. The pulse frequency was 200 kHz. The influence of using laser mode instead of voltage mode is usually to decrease the fraction of multiple events (Thuvander et al., Reference Thuvander, Weidow, Angseryd, Falk, Liu, Sonestedt, Stiller and Andrén2011, Reference Thuvander, Kvist, Johnson, Weidow and Andrén2013), although the fraction of multiples can be high also for laser mode (Tang et al., Reference Tang, Gault, Ringer and Cairney2010; Angseryd et al., Reference Angseryd, Liu, Andrén, Gerstl and Thuvander2011; Peng et al., Reference Peng, Choi, Li, Gault and Raabe2017).
In order to vary the detection efficiency, two different types of local electrode assemblies were used. First, a normal local electrode (NLE) was used, giving the normal detection efficiency of 37%, specified by the supplier. Second, a GLE assembly was used, where a fine grid (mesh) was mounted at the exit side of the assembly (the so-called puck). The mesh has an open area of 14%, giving a detection efficiency of only 5%. The GLE used to analyze steel A is identical to the one used in a previous study (Thuvander et al., Reference Thuvander, Kvist, Johnson, Weidow and Andrén2013). This local electrode had a hole with a diameter of 400 µm, and is here designated GLE400, whereas the standard hole has a diameter of 40 µm. Steel B was analyzed with a GLE with the standard 40 µm hole (making it possible to use array samples) and is here designated GLE40. The use of two different hole sizes for the GLE is believed to have minimal influence on the compositional results, although the voltage has to be increased when using a larger hole (Kelly et al., Reference Kelly, Camus, Larson, Holzman and Bajikar1996).
The detection rate when using the NLE and the GLEs was 0.002 and 0.001 (ions per pulse), respectively. This means that the actual evaporation rate at the specimen was 3–4 times higher when using the grid with the lower detection efficiency. A higher evaporation rate usually gives a small increase in evaporation field, as demonstrated in Figure 1, which shows the voltage (field) increase as a function of evaporation rate for a PSM. Although the rate was increased by a factor of 8 (from 0.005 to 0.04), the voltage only increased by 2.5%, in general agreement with early work by Tsong (Reference Tsong1978). This difference in field is not expected to give a significant change in the field evaporation behavior or the occurrence of multiple events (Peng et al., Reference Peng, Choi, Li, Gault and Raabe2017). For Ti–Si–N thin films, Tang et al. (Reference Tang, Gault, Ringer and Cairney2010) observed a slight increase in the fraction of multiple events when increasing the detection rate by a factor of four, so in the current study the desired decrease in the fraction of multiple events by using a GLE will likely be slightly underestimated.

Fig. 1. Effect of evaporation rate on the voltage (evaporation field), from analyses of Si(Sb) standard PSM sample.
IVAS 3.6 software (Cameca Inc., Madison, WI, USA) was used for the reconstructions and for evaluating the data. The composition of the carbides was studied using iso-concentration surfaces (isosurfaces). In order to generate the isosurfaces, voxel sizes of 1.0 × 1.0 × 1.0 nm3 and 1.5 × 1.5 × 1.5 nm3 were used for analyses obtained with an NLE and the GLE assemblies, respectively. The larger voxel size had to be used to obtain reasonably smooth isosurfaces as the atom density becomes low when the detection efficiency is reduced from 37 to 5%. In both cases the delocalization distances were 3.0 nm in the x–y plane and 2.0 nm in the z direction. In order to evaluate multiple events, epos-files from IVAS were imported into software developed at GPM (University of Rouen, France).
Results and Discussion
First, the influence of using a GLE on the detector hit map was studied by analyzing a standard PSM sample. A comparison is shown in Figure 2. It is clear that the grid does not cause any severe image distortions and the (001)-pole is easily recognized in both images.
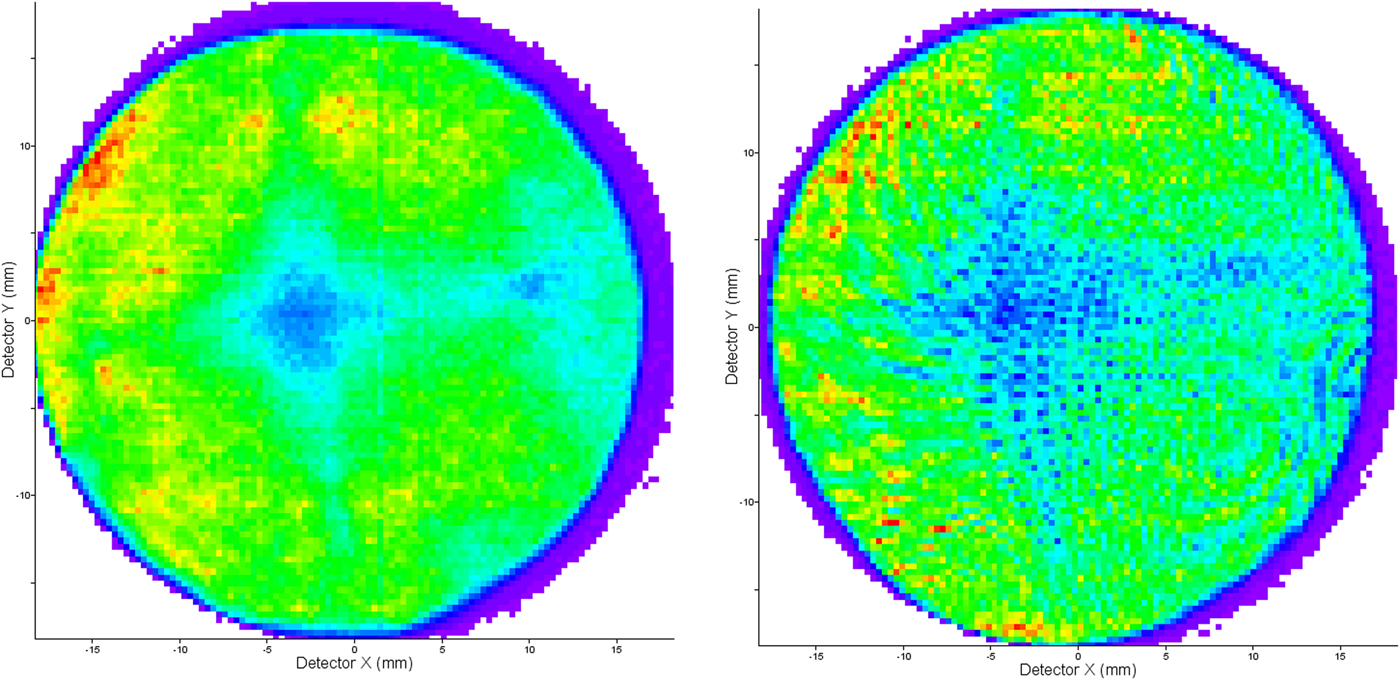
Fig. 2. Detector hit maps from two analyses of Si(Sb) using an NLE assembly (left) and the GLE40 assembly (right).
Steels A and B were analyzed using both an NLE (giving a detection efficiency ~37%) and a GLE (~5%). For steel A, the total fraction of multiple events was 4.2 and 3.0% for the NLE and the GLE400, respectively, whereas for steel B the corresponding numbers were 2.4 and 1.6% for the NLE and the GLE40, respectively. The decrease is relatively small, as the volume fraction of carbides is relatively small, and the atoms from the matrix evaporate mainly as individual ions (singles). However, the relative fraction of multiples decreased with about 30%. The fraction of multiples, if only considering C, was much higher than the values above for all ions. For the NLE, 68 and 66% of the C originated from multiple events for steels A and B, respectively. For the GLE, on the other hand, this fraction was reduced to 29% for both steels.
The mass spectra were typical for analysis of carbide containing steel, with significant peaks from molecular C ions. In Figure 3, mass spectra from the carbides, extracted from the total volume using isosurfaces, are presented. There is not enough signals to deconvolute the presumed overlap between C2+ and C42+ (and there is no sign of any C22+). The carbides could possibly contain some nitrogen, but as there is no peak at 7 Da and the peak at 14 Da (which is an overlap with Si2+) is small, the N content is regarded negligible. It can also be seen that the mass spectrum quality was not affected by the type of local electrode used.

Fig. 3. Mass spectra from carbides in steel B acquired using an NLE (top) and the GLE40 (bottom).
Reconstructions of steels A and B, showing isosurfaces generated with a threshold of C + Mo + V = 30 at.%, are presented in Figures 4 and 5, respectively. As expected, the carbides in steel A are larger but fewer, because of coarsening. The sizes and shapes of the carbides vary quite significantly, but there seems to be no difference caused by the use of the grid. However, the interfaces are rougher in the analyses performed with the grid, despite the use of larger voxels. This is clearly a consequence of the lower density of atoms caused by the decreased detection efficiency.

Fig. 4. Reconstructions of steel A, from analyses with an NLE assembly and the GLE400 assembly, showing carbides by isosurfaces using a threshold of C + Mo + V = 30 at.%.
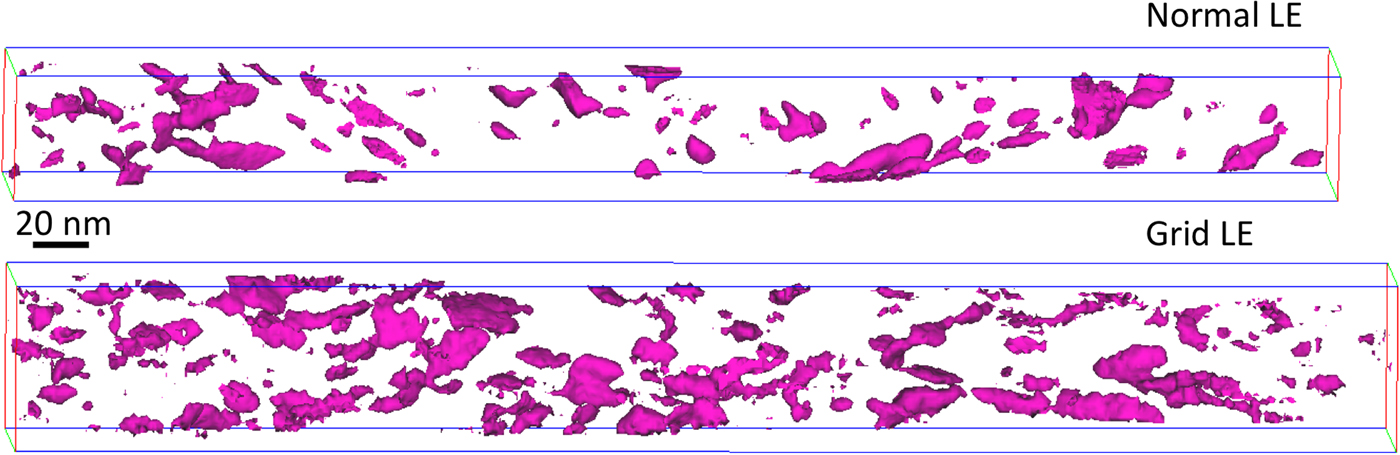
Fig. 5. Reconstructions of steel B, from analyses with an NLE assembly and the GLE40 assembly, showing carbides by isosurfaces using a threshold of C + Mo + V = 30 at.%.
The large difference in atomic density, resulting from the difference in detection efficiency, is illustrated in Figures 6 and 7, which present slices of 0.5 nm thickness, showing all detected Fe and C atoms (each molecular C ion, viz. C2+, C3+, and C32+, is represented by one single dot). The atom density of the carbides is much lower than the density of the matrix, due to strong local magnification effects (Miller & Hetherington, Reference Miller and Hetherington1991), in turn caused by the higher evaporation field of the carbides (Thuvander et al., Reference Thuvander, Weidow, Angseryd, Falk, Liu, Sonestedt, Stiller and Andrén2011; Leitner et al., Reference Leitner, Stiller, Andren and Danoix2004).
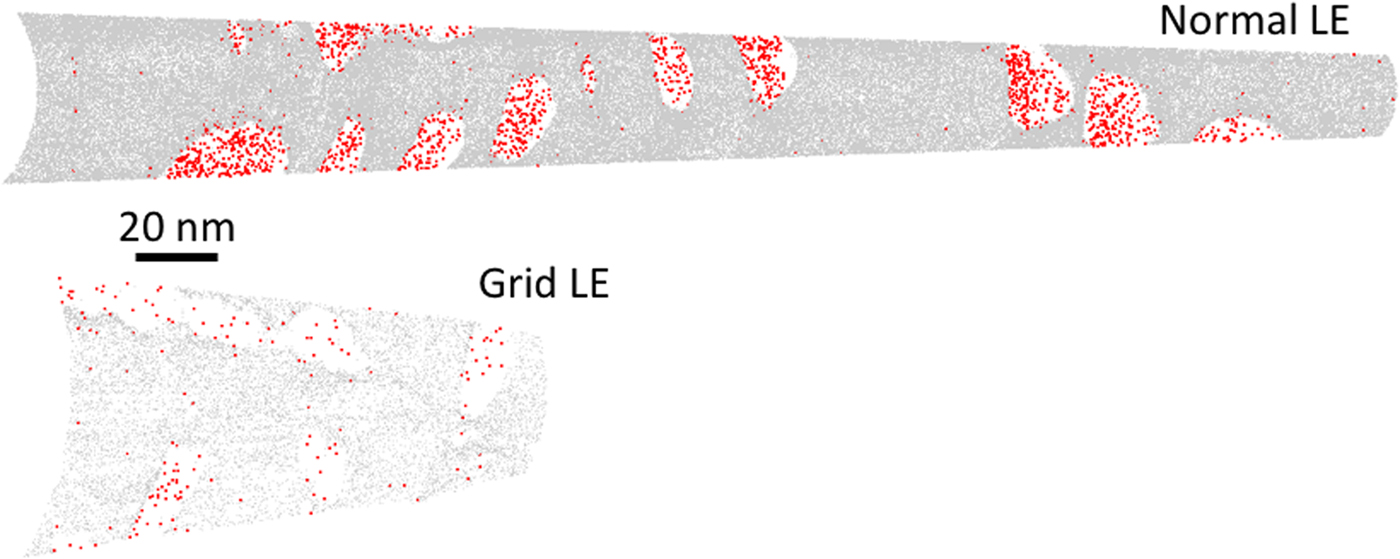
Fig. 6. Atom maps showing all detected Fe (gray) and C (double size, red) atoms in slices of thickness 0.5 nm, of steel A.
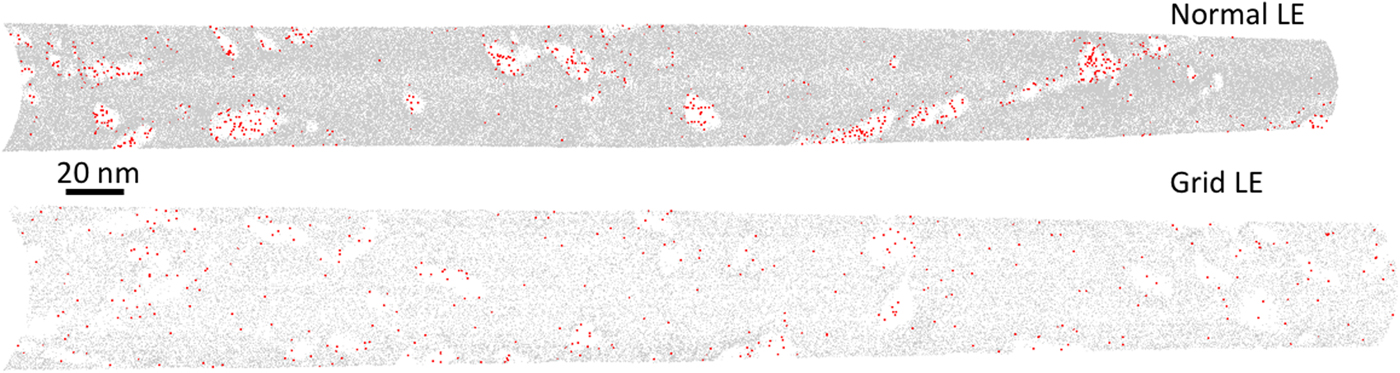
Fig. 7. Atom maps showing all detected Fe (gray) and C (double size, red) atoms in slices of thickness 0.5 nm, of steel B.
The main focus of the current paper is to investigate the effect of reducing the detection efficiency on the measured C concentration of small secondary carbides. Proximity histograms (proxigrams) of the carbides in steel A (Fig. 4) and in steel B (Fig. 5), are presented in Figures 8 and 9, and it is clear that the measured C concentration is somewhat higher when the grid was used. This is further illustrated in Figure 10, where the C proxigrams are compared. The quantification of the composition of the secondary carbides, determined by using the decomposition tool in IVAS on the ions enclosed by the same isosurfaces as above, is presented in Table 1. The decomposition was primarily used to treat the overlaps of 54Cr/54Fe and 96Mo2+/C4+. The measured C concentration of the carbides increased by about 2 at.% for the GLE compared with the NLE, but at the same time the Fe concentration also increased, presumably a consequence of the larger voxel size that had to be used for the GLE data and the rougher isosurfaces. Therefore, it is relevant to compare the compositions measured after removing Fe, and then the increase becomes 4.2 and 6.3 at.% for steels A and B, respectively, see Table 1. Carbide compositions are often corrected by removing elements assumed to belong to the matrix, i.e., mainly Fe (Kolli & Seidman, Reference Kolli and Seidman2014; Leitner et al., Reference Leitner, Stiller, Andren and Danoix2004).
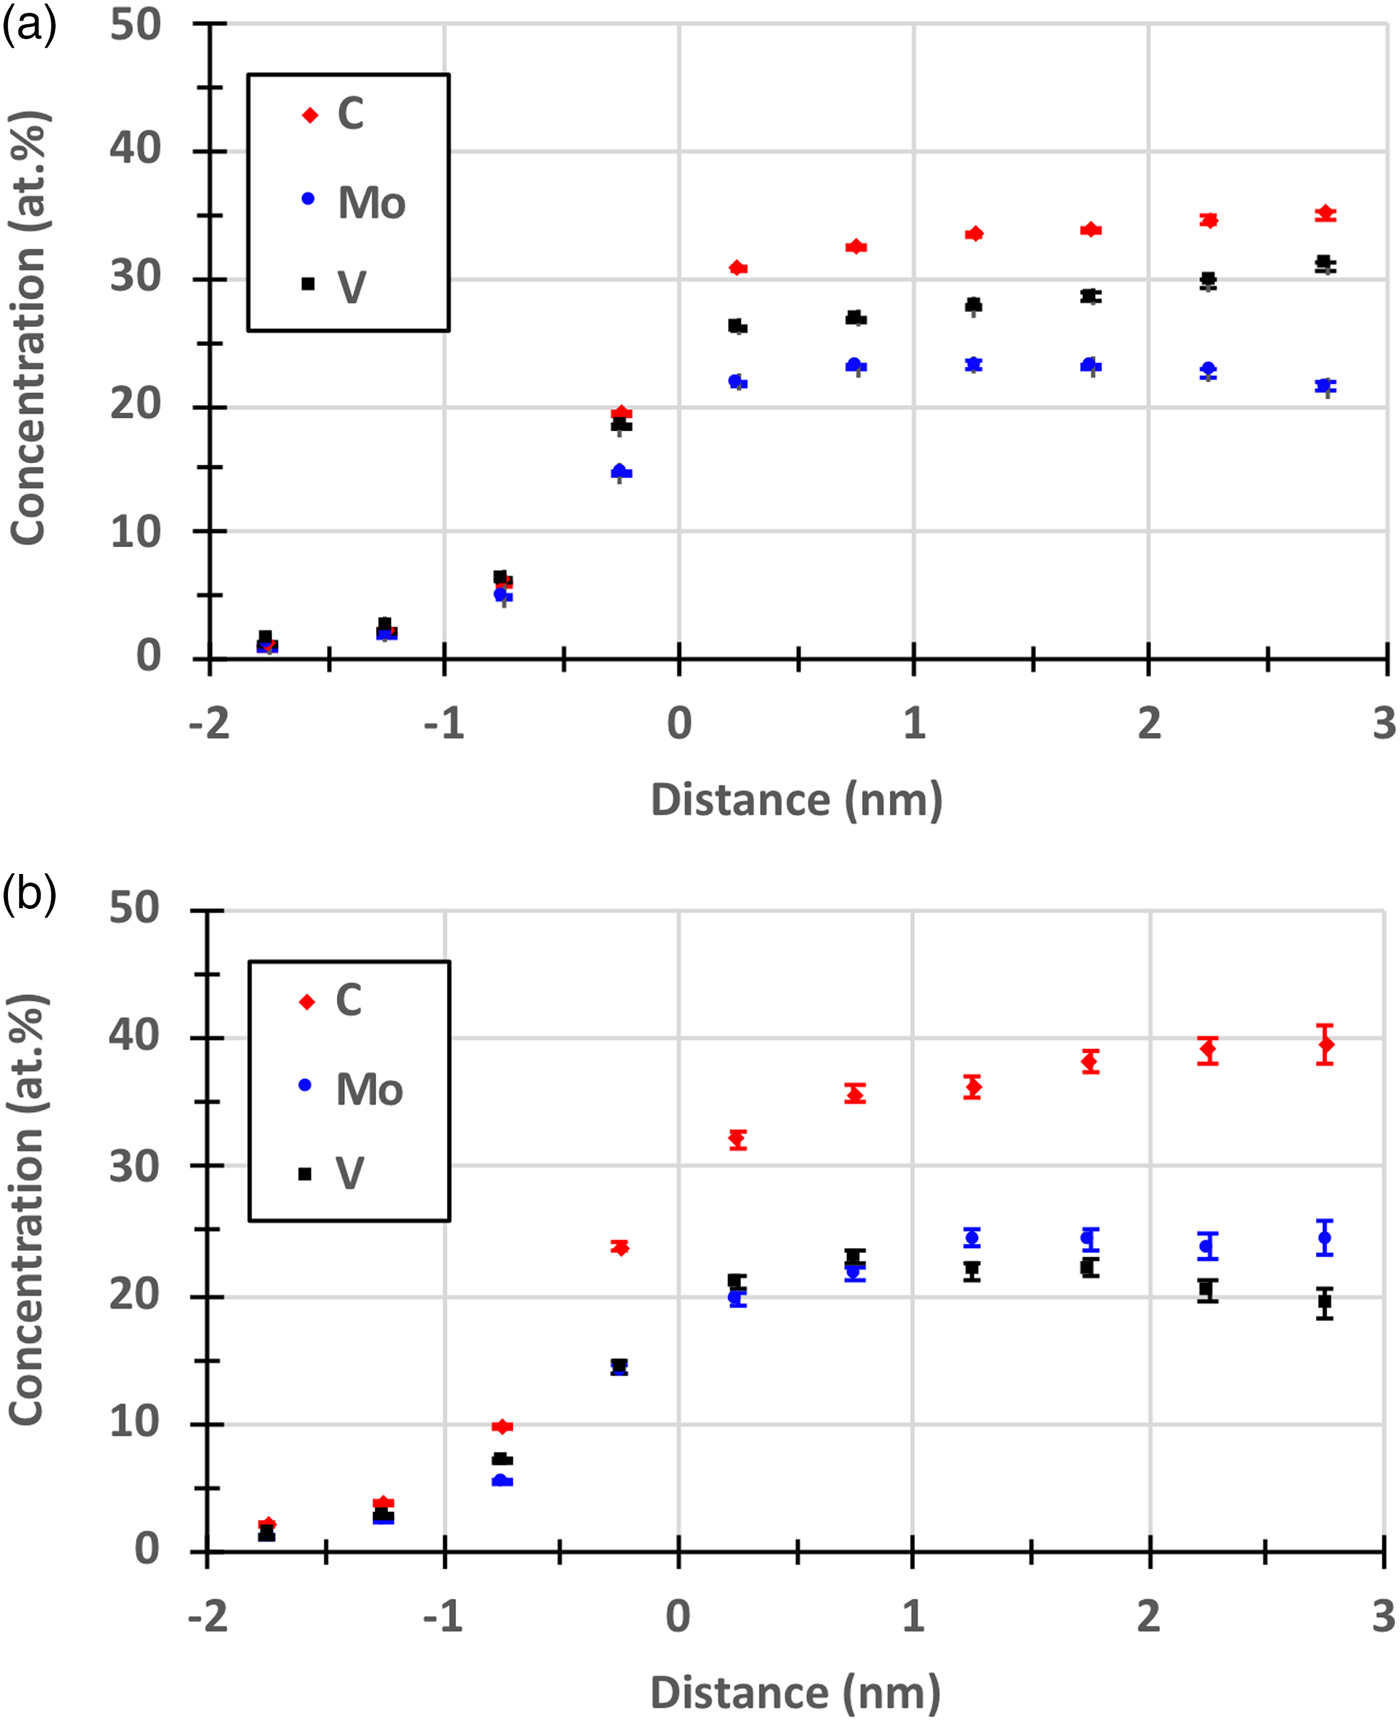
Fig. 8. Proxigrams of carbides in steel A. a: Measured with an NLE. b: Measured with the GLE400. The error bars (from counting statistics only) for the analysis with the NLE are too small to be visible.
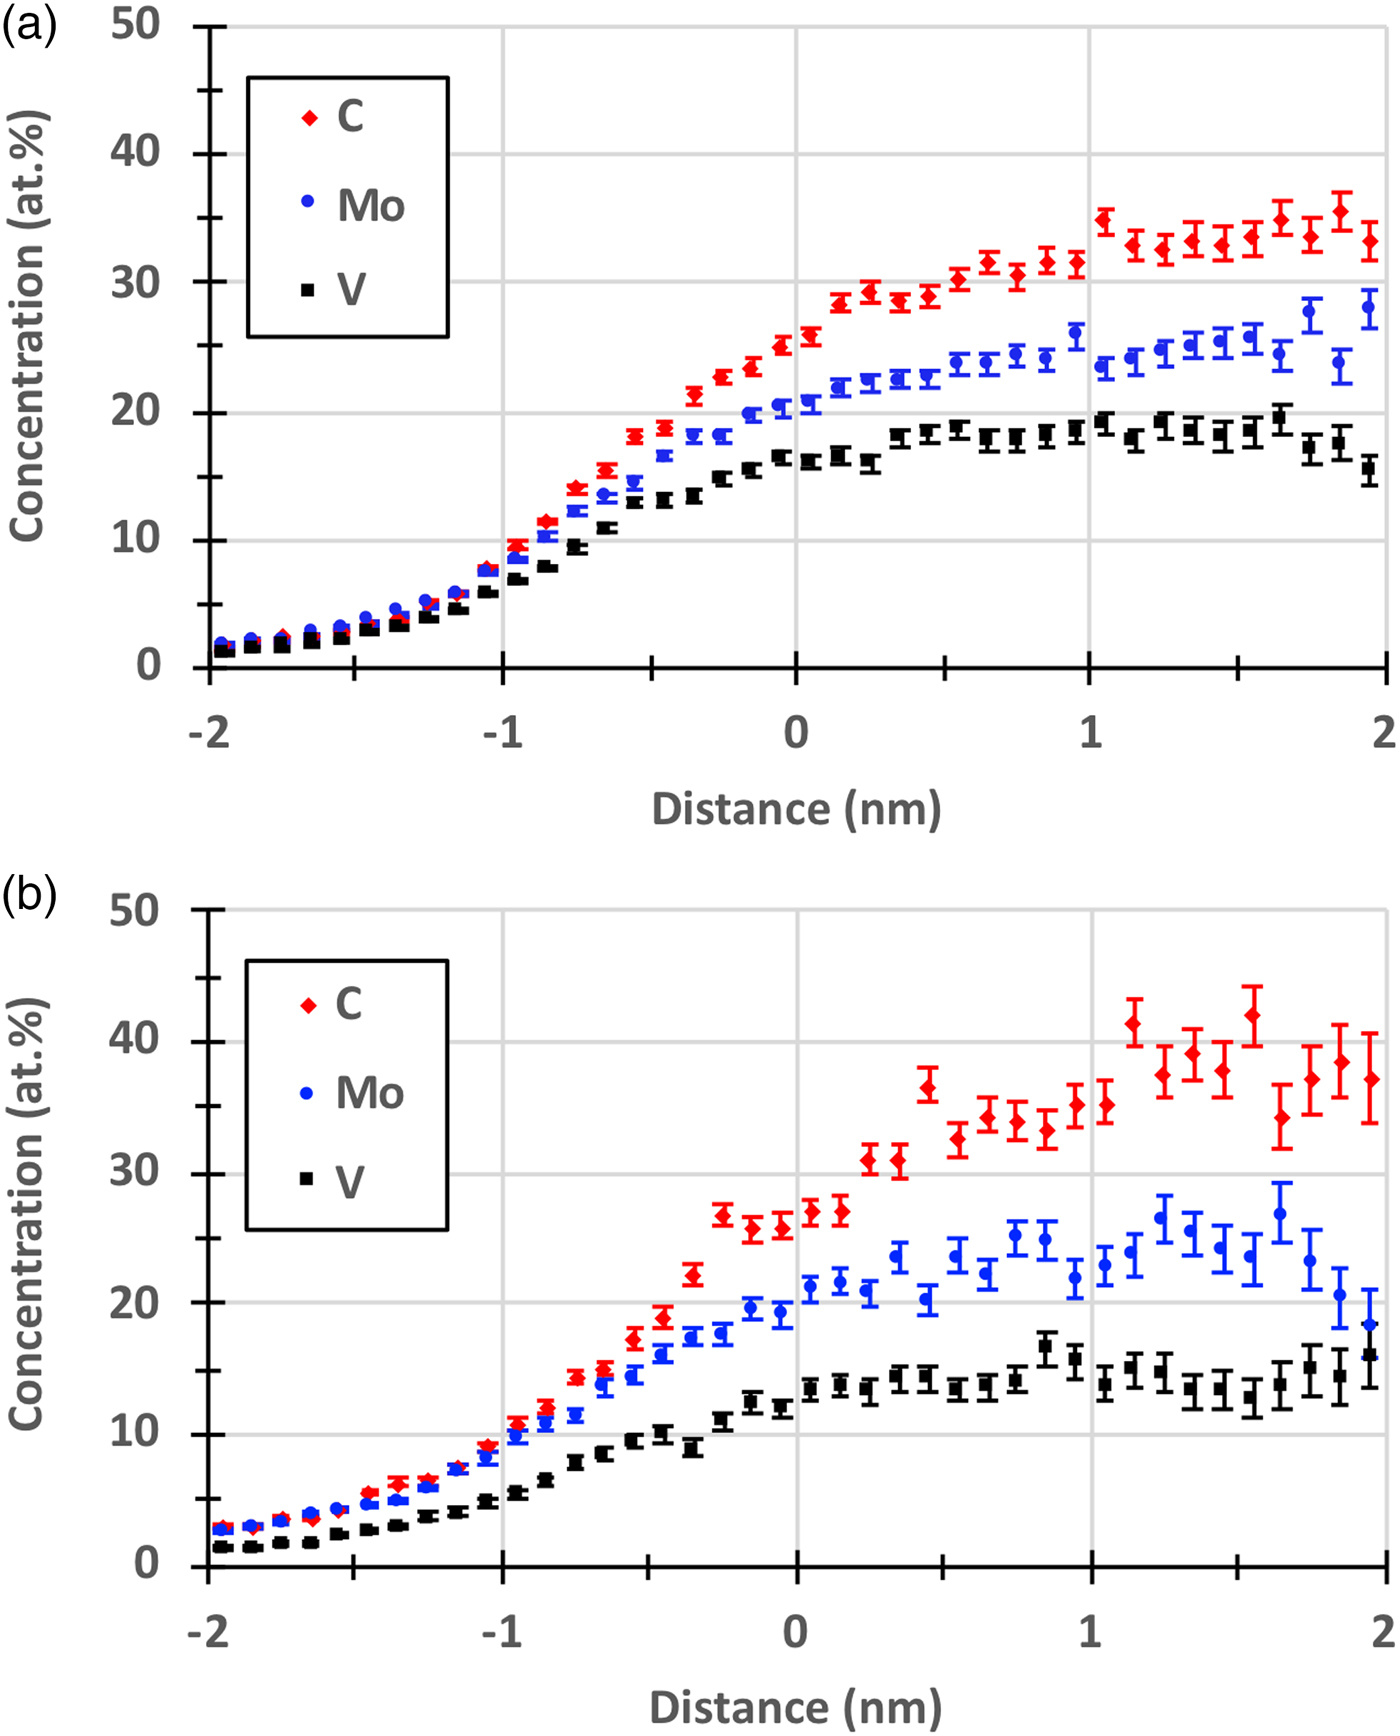
Fig. 9. Proxigrams of carbides in steel B. a: Measured with an NLE. b: Measured with the GLE40.
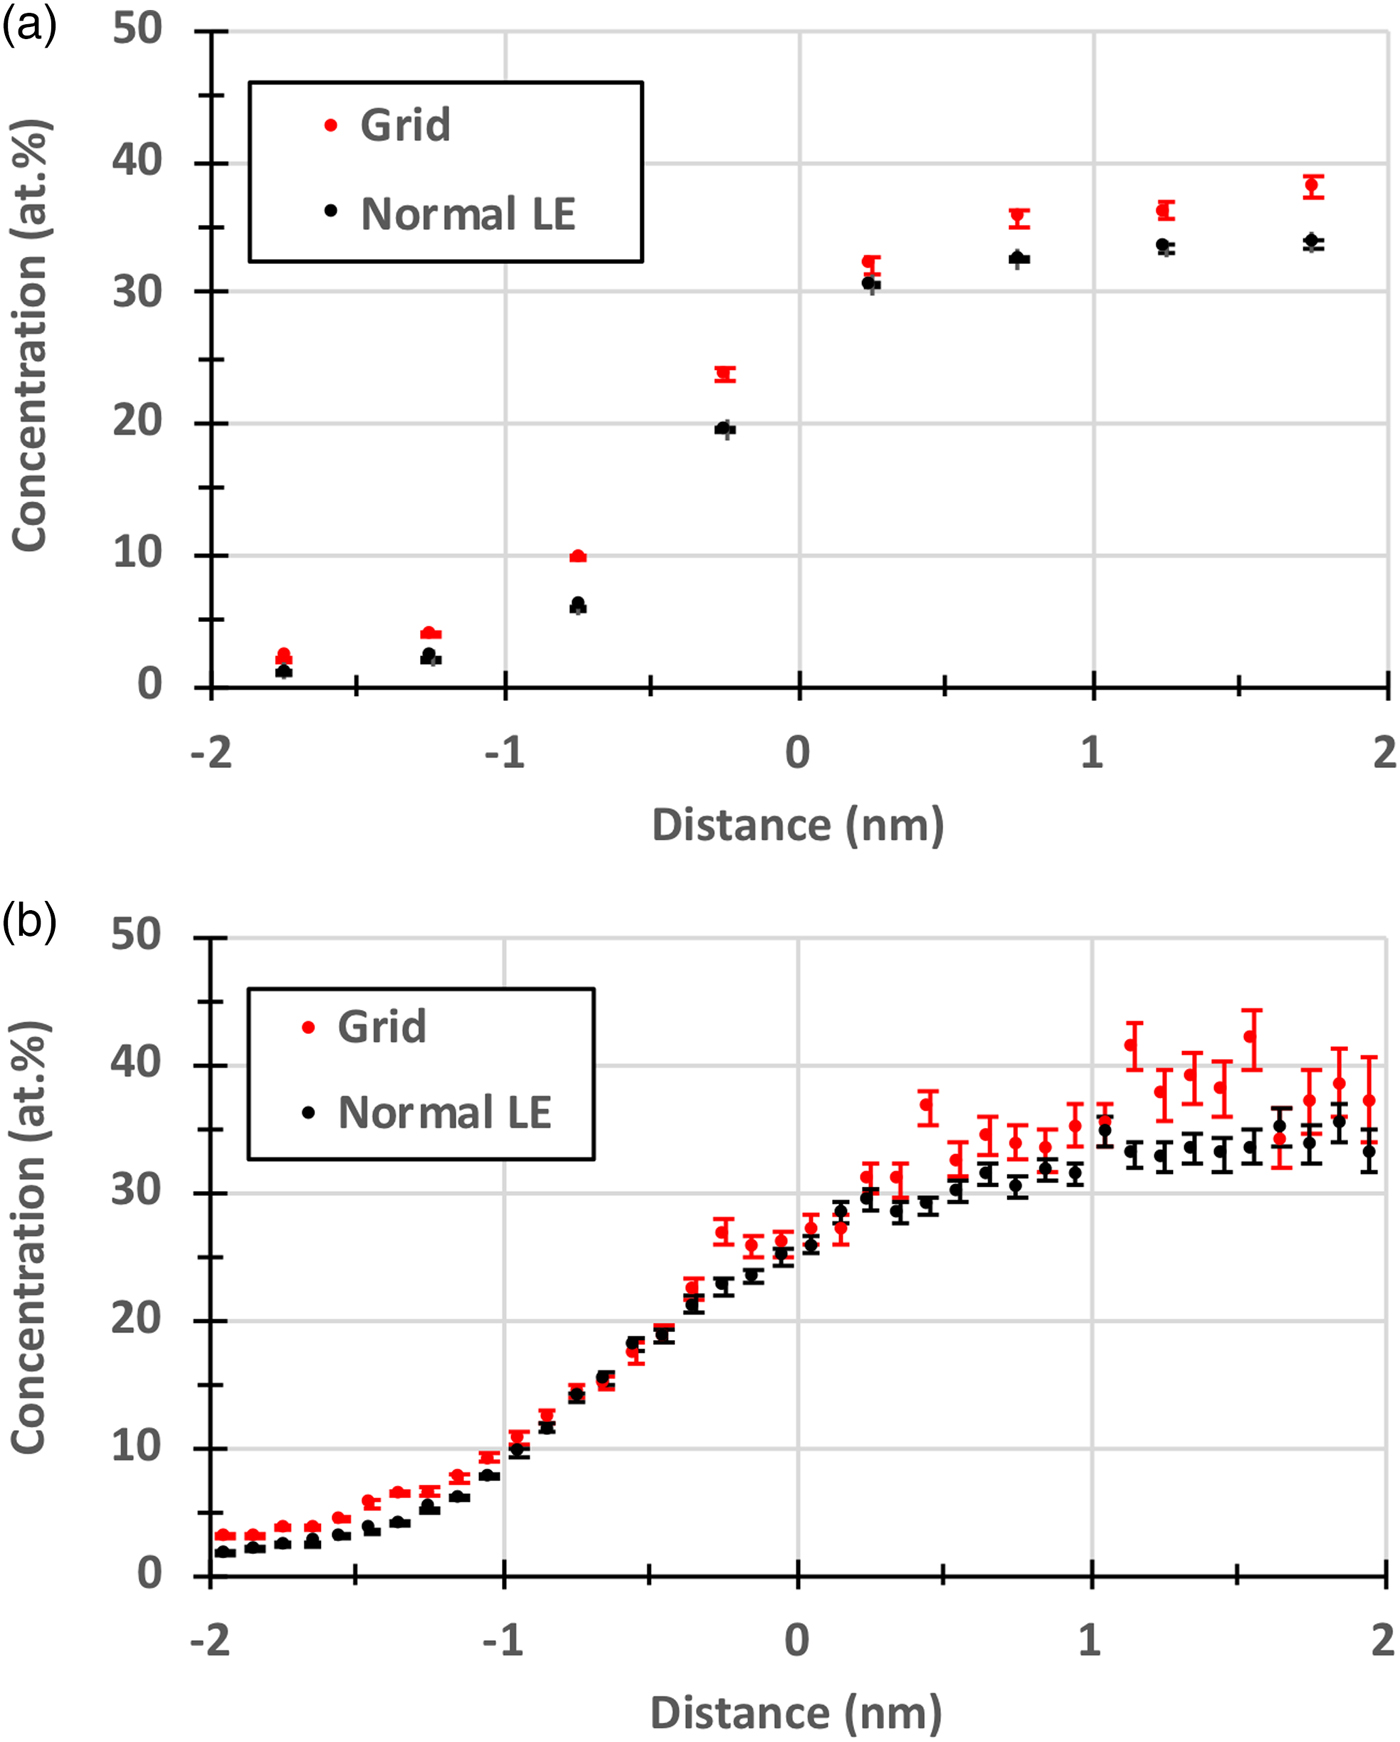
Fig. 10. Proxigrams comparing the measured C concentration obtained with the grid and with an NLE: (a) steel A and (b) steel B.
It should be noted that the peak at 24 Da has been assigned to C2+, although most probably a significant fraction of this peak is C42+ (Thuvander et al., Reference Thuvander, Weidow, Angseryd, Falk, Liu, Sonestedt, Stiller and Andrén2011), as the number of ions (at 24.5 Da) was too low to deconvolute this overlap with any useful precision. As the main focus here is to investigate the effect of detection efficiency on the measured C concentration, it was reasoned that a deconvolution of the 24 Da peak would induce an uncertainty that could obscure the studied effect. However, the fraction of these two ions should be independent of the type of local electrode used. If a deconvolution had been feasible, it would probably have resulted in an increase of the C concentration of a few at.%, resulting in a concentration approaching the expected 45–47 at.% or the ideal stoichiometry of 50 at.%.
The increase in the C concentration when using the GLEs is a clear indication that C is preferentially lost because of multiple events in combination with the detector dead-time (the detector pile-up effect). A further sign of such an effect might be that the C isotope ratios deviate from the natural abundance, as it is unlikely that pairs of an isotope of low abundance are evaporated. The ratio of 13C/12C is expected to be 1.08%. For steel A, the measured ratio was 1.27 ± 0.06 and 1.13 ± 0.08% for the C2+ and C+, respectively, when using an NLE, whereas the corresponding values for steel B were 1.27 ± 0.08 and 2.29 ± 0.11%. Thus, the isotope ratios indicate that 12C is lost. The reason for the very large 13C+/12C+ ratio for steel B is unknown, but the presence of CH+ could be a contributing cause (Stephan et al., Reference Stephan, Heck, Isheim and Lewis2015). In the analysis made with GLE40, the corresponding ratios were 1.0 ± 0.2 and 0.9 ± 0.2% (steel A), and 1.1 ± 0.3 and 1.2 ± 0.4% (steel B). These values show no deviation from the expected 1.08%, admittedly with a low precision.
In order to extract more information about the evaporation from the carbides, the ions originating from the carbides were studied separately. In Table 2, the fractions of the different ions that were detected in multiple events are listed. The fractions are higher for NLE, and they are roughly halved for GLE. The fractions of ions from multiple events are also larger for steel A, which contains larger carbides. For both steels, when using an NLE, the ions with the highest multiple fraction is C3+, followed by C2+. The fractions for the large C peaks C+ and C2+ are almost the same, and these fractions are reduced by a similar amount when a GLE was used. The fractions for Mo and V are lower, which agrees with the notion that C is preferentially lost. However, it should be remembered that the losses are not necessarily proportional to the fractions detected in multiple events.
Table 2. Fraction of Ions Detected as Multiple Events from the Carbides (%).

Finally, the multiplicity of the detector events (singles, doubles, triplets, etc.) is presented in Table 3. The data are presented separately for matrix and carbides. As expected, there are more multiple events for the carbides than for the matrix, and there are fewer multiples when using a GLE. In fact, there were no events consisting of more than four ions when using a GLE. It should be noted that the multiplicity values also include un-ranged ions (like hydrogen and background), making, for example, the fraction of single events larger than when looking in Table 2, where only ranged ions are included. Also, for the matrix, the GLE reduced the fraction of multiples, so it could be useful also to study the matrix C concentration with a GLE. However, in the present case the C matrix concentration was too low for obtaining any statistically significant results, in particular as the C content seems to vary between different grains and locations in the microstructure.
Table 3. Multiplicity of Detector Events (%).

The current study has shown that the measured C concentration comes closer to the expected value if the detection efficiency is decreased by inserting a grid in the flight-path of the ions, and that improvements can also be seen for small carbides (~10 nm). As the number of detected ions becomes smaller, the precision decreases (by counting statistics), but more importantly, the accuracy increases, because the number of multiple events (detector pile-up) decreases. In most cases, it of course makes sense to have a high detection efficiency. For example, the possibility of solving mass spectrum overlaps using minor isotopes is reduced with a lower detection efficiency, as noted here for the C2+/C42+ overlap at 24 Da. However, the uncomplicated methodology used here can give important information about any bias caused by multiple events in most material systems and also for small microstructural features, which can be used to develop correction procedures. In many cases it can be useful to perform analyses with an NLE to distinguish small features, determine shapes of small features, perform statistical analyses etc. and with a GLE to obtain complementary information about preferential losses due to detector pile-up effects.
Conclusions
The measurement of the C concentration of secondary MC carbides in two tool steels was found to become more accurate when the detection efficiency was decreased. This was achieved by inserting a grid in the ion flight-path giving a detection efficiency of only 5%. The reason is that the fraction of multiple detector events was decreased and thereby the effect of the detector dead-time was reduced. The methodology presented can give information about preferential losses, due to detector pile-up effects, in APT analysis of any material.
Acknowledgment
Uddeholm AB is acknowledged for providing the material. This research was supported by the Swedish Foundation for Strategic Research (RMA11-0029) and Vinnova (2015-06474). Dr. Hisham Aboulfadl is thanked for performing some of the Si(Sb) analyses.


 Open access