


Introduction
Gamma TiAl-based alloys are a very promising class of material for high-temperature applications. In fact, with suitable processing methods and alloying additions, these alloys can be a potential replacement for Ni-based superalloys in the temperature range of 800–900°C. High-specific strength, oxidation resistance (800–900°C), high-melting point (up to ~1,450°C), and good structural stability at high temperatures are the key properties of these alloys that make them highly useful for high-temperature applications (Kim, Reference Kim1989; Kothari et al., Reference Kothari, Radhakrishnan and Wereley2012). However, the major reasons for their restricted applicability are their brittleness at room temperature and poor hot workability (Toshimitsu et al., Reference Toshimitsu, Kentaro, Satoshi, Satoru and Masao2005; Appel et al., Reference Appel, Paul and Oehring2011).
In recent years, notable progress has been achieved eliminating this shortcoming through a novel alloy design concept called β-solidifying TiAl alloys (Clemens & Smarsly, Reference Clemens and Smarsly2011). γ-TiAl alloys with β-phase stabilizers (e.g., Mo, W, Cr, Mn, Ta, etc.) solidify through the β-Ti phase field, and thereby show more chemical homogeneity and less dendritic segregation. A finite amount of β-Ti-phase is also retained at room temperature and boosts high-temperature workability of the alloy due to its relatively more deformability at high temperature (Liu et al., Reference Liu, Liu, Li, Zhang and Chiba2011).
Although the poor ductility issue has been addressed to some extent, there is still a lack of in-depth understanding at the microstructural level in γ-TiAl-based alloys due to those structure–property correlations that are difficult to establish. This is largely due to the limitations of conventional microscopy techniques in characterizing the microstructure of γ-TiAl alloys. Using an optical microscope, colony sizes can be measured after etching of the sample but fine scale laths cannot be resolved and phase information cannot be obtained. In scanning electron microscopy (SEM), a major setback exists in terms of its inability to clearly distinguish the laths of individual phases in each colony, as atomic contrast imaging, or backscattered electron imaging, is ineffective due to compositional similarity. Also, the type of lath interface i.e., γ/γ or α 2/γ in each colony, which affects the mechanical properties of these alloys, cannot be characterized using SEM (Appel et al., Reference Appel, Paul and Oehring2011; Appel, Reference Appel and Sztwiertnia2012). Electron back-scattered diffraction (EBSD) techniques can distinguish the individual phases in γ-TiAl alloys, and can also provide information about the types of interfaces. However, due to a lack of high-spatial resolution, very fine laths (sizes typically <80 nm) are not easily resolved even with very fine step sizes. The fine laths can be characterized by transmission electron microscopy (TEM) using micro-diffraction or nano-diffraction techniques, however, it is a highly time-consuming process as each colony is made of several hundreds of laths (Appel et al., Reference Appel, Paul and Oehring2011). A possible solution is an advanced microscopy technique called automated crystal orientation and phase mapping (ACOM) in TEM along with precession electron diffraction (PED) (Rauch et al., Reference Rauch, Véron, Portillo, Bultreys, Maniette and Nicolopoulos2008; Moeck et al., Reference Moeck, Rouvimov, Rauch, Nicolopoulos, Moeck, Hovmöller, Nicolopoulos, Rouvimov, Petkov, Gateshki and Fraundorf2009; Rouvimov et al., Reference Rouvimov, Rauch, Moeck and Nicolopoulos2009). Because of its much higher spatial resolution and less sensitivity to the plastic deformation, it can be utilized to distinguish in γ-TiAl alloys such fine lamellae, along with their interface characteristics, with good accuracy. It has also been demonstrated that the PED mode (Vincent & Midgley, Reference Vincent and Midgley1994; Rauch et al., Reference Rauch, Portillo, Nicolopoulos, Bultreys, Rouvimov and Moeck2010) significantly improves the reliability of this technique and reliably resolves the so-called “180° ambiguity” in the indexing of spot patterns from the zero order Laue zone (Rauch et al., Reference Rauch, Portillo, Nicolopoulos, Bultreys, Rouvimov and Moeck2010). Moreover, characterization of phase transformations at the nano-scale in multiphase alloys can also be carried out with this technique.
The current paper attempts to demonstrate the utility of the above-mentioned technique in characterizing the microstructure of hot deformed multi-phase γ-TiAl alloy in order to overcome the limitations of conventional microscopy techniques. Specimens of a β-solidifying γ-TiAl alloy pancake have been hot compressed at different temperatures and strain rates. The ACOM/PED technique in TEM is used to address the microstructural evolution of the alloy during hot deformation and the relative advantages are discussed.
Experimental Procedure
The experimental alloy having a nominal composition of Ti–45% Al–8% Nb–2% Cr–0.2% B (at.%) was prepared by vacuum arc melting furnace with a non-consumable tungsten electrode in the form of pancake (dimensions:ø100 mm × 15 mm). An approximately 600 g pancake ingot of the alloy was remelted six times by flipping the sides to ensure chemical homogeneity. The analyzed alloy chemistry of the pancake is given in Table 1 and indicates excellent agreement with the targeted nominal composition. The oxygen, nitrogen, sulfur, and hydrogen contents were analyzed as 830, 20, 240, and 24 ppm, respectively by glow discharge optical emission spectroscopy. Hot compression test specimens of 12 mm length and 8 mm diameter were machined from the as-cast alloy pancake. The opposite ends of the cylindrical specimens were ground carefully to maintain parallelism and all the surfaces were polished to remove surface scratches prior to testing. Hot compression tests were conducted utilizing the Gleeble 3800 thermo-mechanical simulator (Dynamic Systems Inc., Poestenkill, New York, USA) at three temperatures (1,273, 1,373, and 1,473 K) and three strain rates (0.5, 0.05, and 0.005/s). Microstructural evaluation was performed under the as-cast conditions as well as after hot compression by SEM, EBSD, and TEM. SEM characterization was carried out in a Zeiss EVO18 SEM (Carl Zeiss Microscopy GmbH, Jena, Germany) at 20 kV. For EBSD studies, the final polishing was carried out in a Buehler vibratory polisher (Buehler, Lake Bluff, Illinois, USA) for 12–18 h using non-crystallize colloidal silica (0.05 µm) in dilute solution. TEM samples were prepared by cutting a thin slice using a low speed saw (Isomet, Buehler, Lake Bluff, Illinois, USA) and then mechanically grinding to 80 µm using fine emery paper of grit sizes from 1,000 to 2,500 (P scale). Final sample thinning was carried out by twin-jet electro-polishing (Tenupol 5, Struers ApS, Ballerup, Denmark) using a solution of 95% methanol and 5% H2SO4 at −45°C (228 K). The EBSD data were acquired using an Oxford Nordlys EBSD (OXFORD Instruments Plc, Eynsham, Oxon, UK) detector attached to a Zeiss FEGSEM (model: Supra 55) and data analyses have been performed with EDAX/TSL 8.0 orientation imaging microscopy software.
Table 1. Analysed chemical composition (at.%) of the pancake (ICP-OES method)

Conventional TEM observation was conducted using a FEI Tecnai G2 (FEI Company, Eindhoven, Netherlands) microscope operating at 200 kV. The same microscope was also used for ACOM using a NanoMEGAS ASTAR attachment equipped with PED (Rauch et al., Reference Rauch, Véron, Portillo, Bultreys, Maniette and Nicolopoulos2008). In this system, electron diffraction spot patterns, generated during beam scanning of the sample area of interest, were captured by using a CCD camera mounted above the TEM screen. The patterns were stored by using acquisition software for post-acquisition processing. In order to record more reflections or diffraction spots with high accuracy and reduced dynamical diffraction for best matching and get higher reliability data, the PED technique had been used with a precession angle of 0.5°. The step size of 20 nm was employed for scanning the area of interest. The orientation/phase identification was performed through off-line software. The processed data were further converted to CTF files for misorientation-based analysis such as strain analysis (Kernel average misorientation, KAM).
Results and Discussion
The Initial Microstructure
The microstructure of Ti–45Al–8Nb–2Cr–0.2B alloy in the as-cast state is characterized by a fine and uniform distribution of the (α 2 + γ) and/or (α 2 + γ + γ) lamellar colonies with intermittent near equiaxed γ grains at the inter-lamellar boundaries (Singh et al., Reference Singh, Mondal, Kumar, Bhattacharjee and Ghosal2019). The presence of irregular-shaped β-phase is also found in the cast microstructure mostly at the colony boundaries, and occasionally at inter-lamellar regions and typically surrounded by γ-TiAl grains. A representative as-cast microstructural characterization through conventional SEM, EBSD examination is displayed in Figure 1. Although the structural information provided by the band contrast image in conjunction with phase map is, in general, satisfactory, there are some inadequacies, especially regarding the nature of the lamellar structure. This is exemplified in regions marked by circles in Figures 1b and 1c wherein the presence of very thin lamellar α 2-phase could not be resolved. It is well known that size and nature of the lamellar colony (or interfacial structure of the lamellae) play a critical role in determining deformability of this class of material and it is, therefore, important to characterize the lamellar structure accurately. Figure 2 shows the characterization of the present alloy under the as-cast conditions by the ACOM/PED technique. It is evident that the presence of very thin lamellar α 2-phase is resolved at reasonably low magnification (Fig. 2b). The relative structure and orientations of the individual α 2 and γ lamellae can be seen in the partitioned inverse pole figure (IPF) maps (Figs. 2c, 2d).
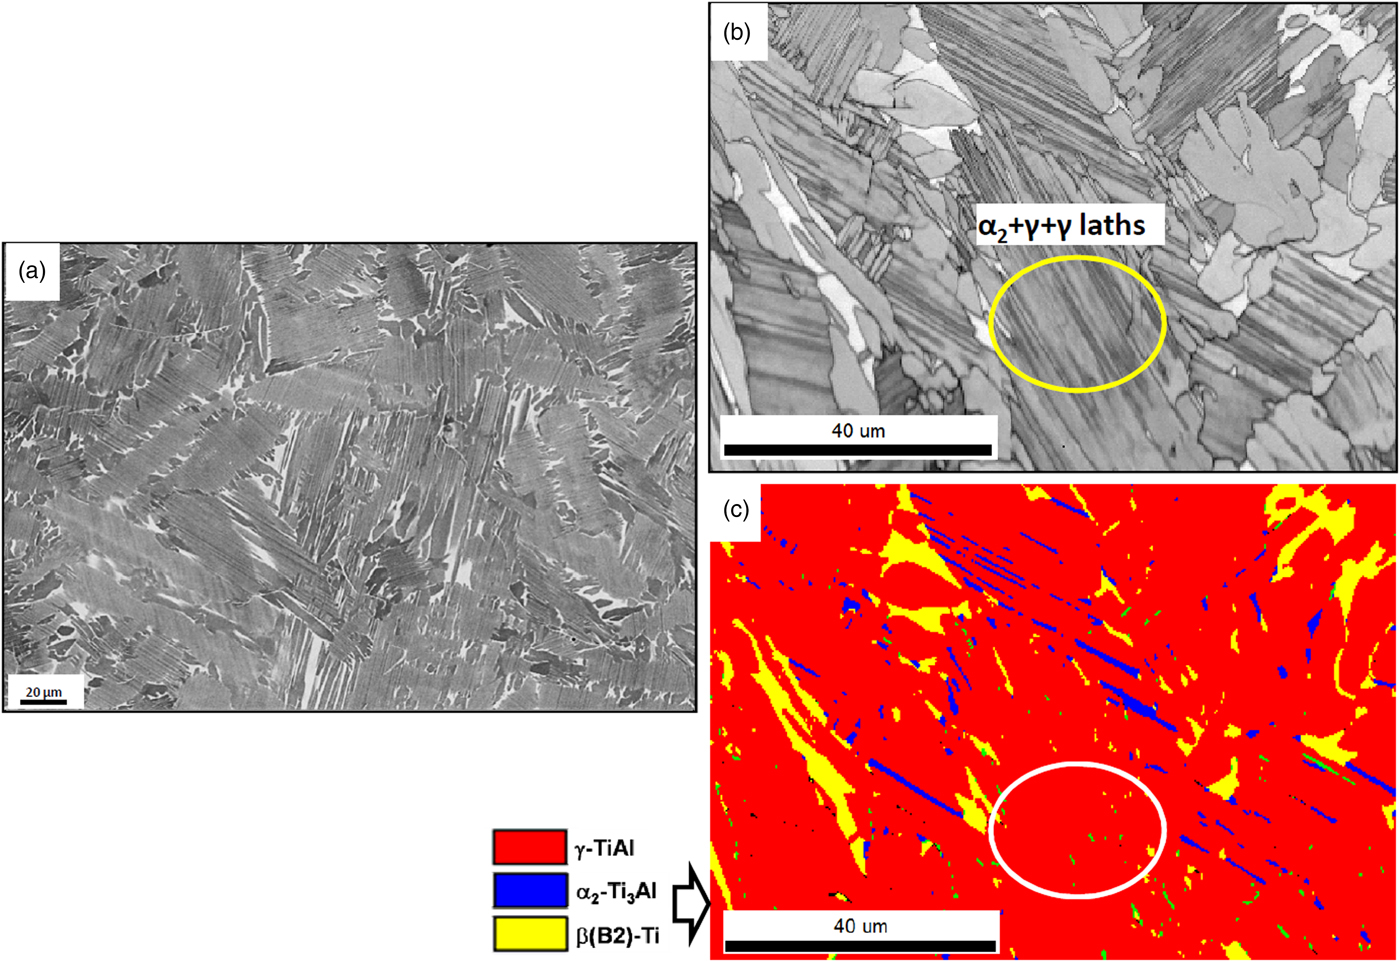
Fig. 1. (a) Back-scattered SEM image showing microstructural development under the as-cast conditions. High magnification EBSD characterization of the as-cast alloy in terms of (b) band contrast map and (c) phase map showing the distribution of constituent phases.
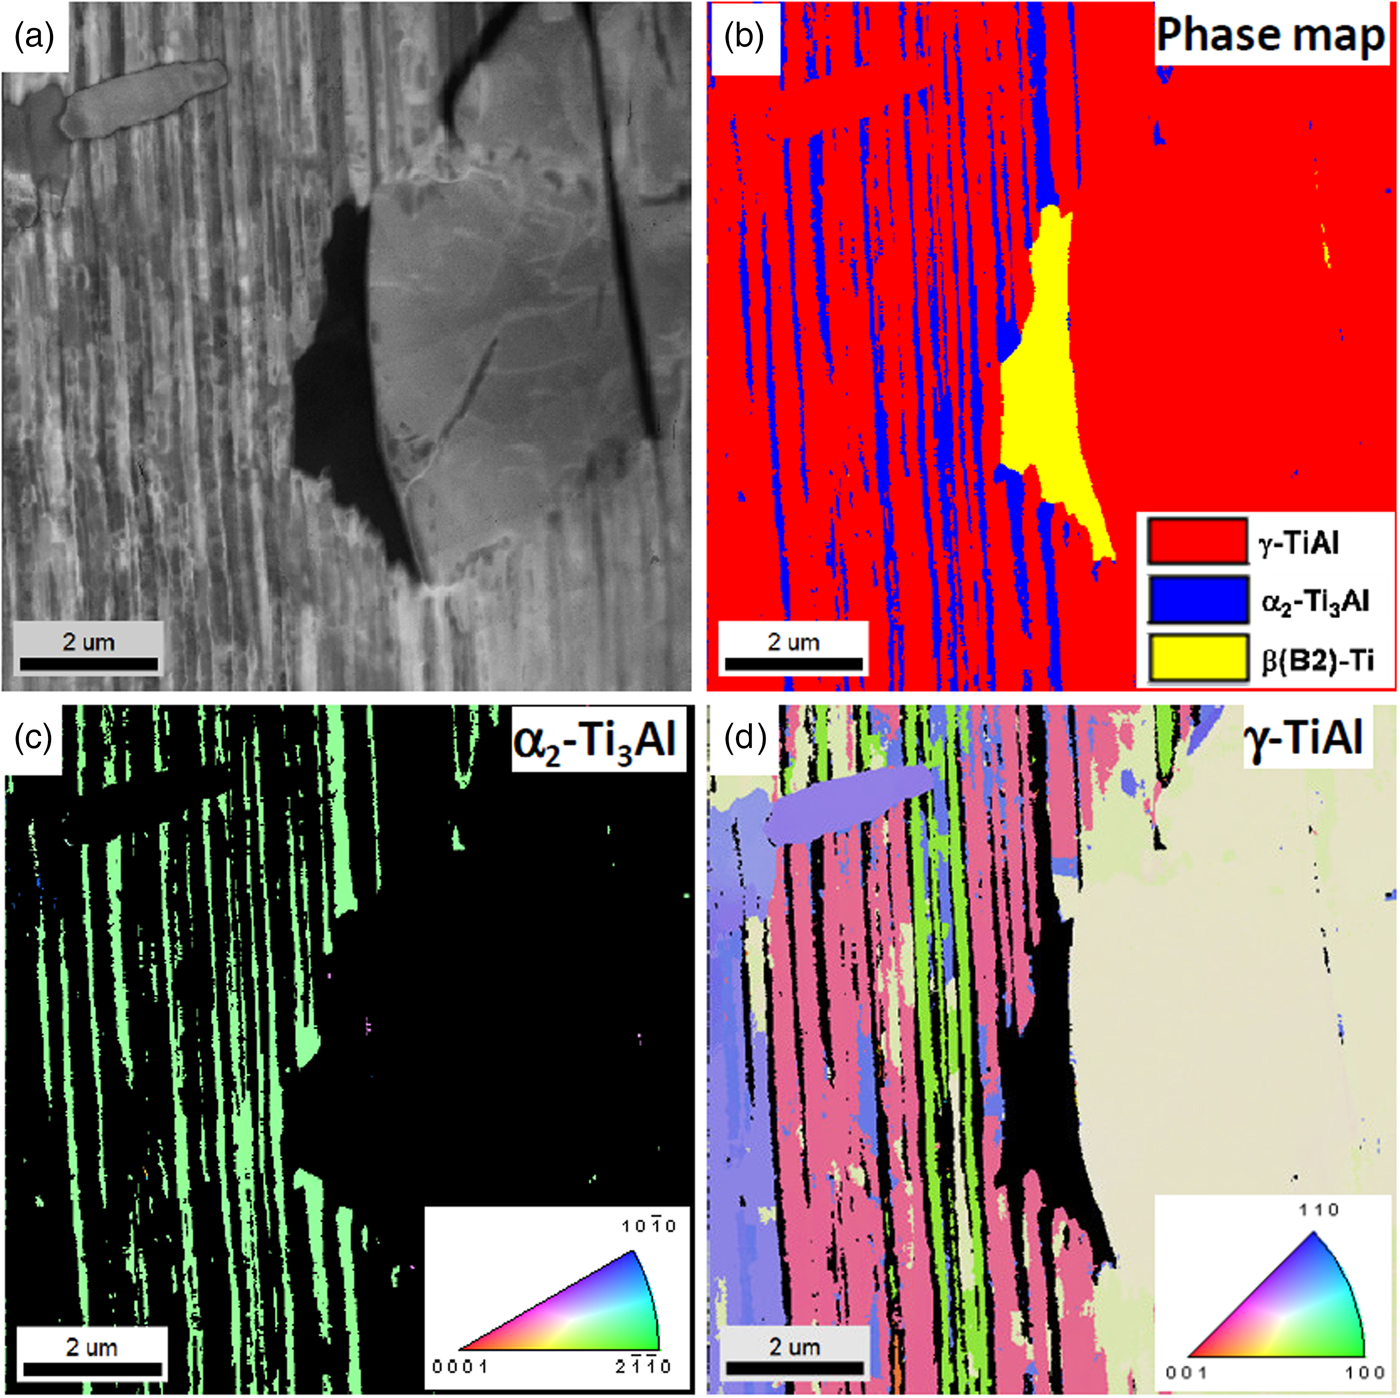
Fig. 2. (a) Virtual bright-field image acquired through ACOM technique of as-cast alloy, (b) corresponding phase map, and (c,d) partitioned IPF maps of α 2-Ti3Al and γ-TiAl, respectively.
Previous studies have shown that these colonies consist of (α 2 + γ) or (γ + γ) lamellar structures with different types of interfaces depending on the alloy composition (Appel, Reference Appel and Sztwiertnia2012). It is well known that during the post-solidification cooling process the α → γ phase transformation and subsequent ordering reactions lead to the lamellar morphology and formation of α 2 + γ lamellae strongly depends on the temperature and the degree of undercooling (Yamaguchi et al., Reference Yamaguchi, Inui and Ito2000). Zghal and co-workers have studied the formation and structural details of lamellar colonies in the Ti–47Al–2Cr–2Nb alloy (Zghal et al., Reference Zghal, Thomas, Naka, Finel and Couret2005). The lamellar microstructure contains interfaces, not only between the α 2 and γ phases, but also between differently oriented γ lamellae. The nature of the interfaces is coherent or semi-coherent and the interfaces often contain ledges having heights typically a few multiples of the d 111 inter-planar spacing (Zhao and Tangri, Reference Zhao and Tangri1991; Singh & Howe, Reference Singh and Howe1992). The interfaces in a typical lamellar structure of a colony are displayed in the TEM bright-field image (Fig. 3a). The capability of the ACOM/PED technique is reflected in the resolved lamellar structure shown through the virtual bright-field image and corresponding phase map (Fig. 3b). It has been reestablished through orientation analyses that the α 2 lamellae occurring in a single lamellar colony all have the same orientation because of their origin from the same α or α 2 grain (Fig. 2c). On the other hand, the γ lamellae present in the same colony are likely to have different orientations (Fig. 2d). The orientation variation results from the variant selection of the γ-phase. The γ-TiAl has an ordered face centered tetragonal (L10) crystal structure. In the L10 structure, the 〈110] directions differ from the 〈011] directions, whereas the three 〈11–20〉 directions in the α 2 phase are all equivalent (Zghal et al., Reference Zghal, Thomas, Naka, Finel and Couret2005). Therefore, the nucleating γ-TiAl phase can have six orientation variants.

Fig. 3. Comparison of resolving capability of conventional TEM and ACOM/PED technique: (a) bright-field TEM image, and (b) virtual bright-field image by ACOM of a sample deformed at 1,273 K, 0.005/s showing α 2/γ and γ/γ lamellae interfaces. Inset of (b): phase map.
Post-Deformation Microstructure
Development of microstructure after 50% hot compressive deformation is strongly influenced by deformation temperature and strain rate (Singh et al., Reference Singh, Mondal, Kumar, Bhattacharjee and Ghosal2019). It had been observed that the initial lamellar microstructure undergoes three prominent changes depending on the strain rate and temperature: (i) formation of dynamically recrystallized grains with near-equiaxed morphology, (ii) coarsening of (α 2 + γ + γ) lamellar structure, and (iii) bending (kinking) of lamellar colonies and evolution of shear bands. Lower temperature and higher strain rate conditions lead to kinking of lamellar colonies, whereas coarsening of the lamellar structure along with extensive dynamic recrystallization and grain growth can be seen for higher temperature and lower strain rate conditions. Very fine dynamically recrystallized grains are observed for all temperatures at higher strain rates (0.5/s) and even at lower strain rate at a low temperature (1,273 K) of deformation. Figure 4 summarizes the post-deformation microstructural developments in the samples deformed in the lower temperature and higher strain rate range by FEG-EBSD. It is evident that structure of the remnant lamellar colony is not well resolved and thus, mechanisms of the deformation microstructure evolution are inadequately revealed. Since the high Nb-containing γ-TiAl alloys show poor hot workability in the lower-temperature, high-strain-rate regime, understanding of the kinking and globularization behavior of lamellar colonies assumes greater significance due to its influence on the hot workability (Liu et al., Reference Liu, Liu, Li, Zhang and Chiba2011).

Fig. 4. EBSD band contrast images and corresponding phase maps showing microstructural developments in samples deformed at (a,b) 1,273 K, 0.5/s, and (c,d) 1,373 K, 0.5/s. For all the images, the compression axes are horizontal.
ACOM/PED characterization has been extended to study the kinking behavior of the lamellar structure as shown in Figure 5. The virtual bright-field image (Fig. 5a) and the corresponding phase map (Fig. 5b) confirm the presence of thin, discontinuous α 2-phase lamellae in a highly bent colony. Apart from the thin lamellae, α 2-phase is also noticed to be present in a “patchy” form, which corresponds to the either dynamically recrystallized or deformation-induced transformation product. Dynamic recrystallization is more prominent at the boundary of differently oriented colonies (marked by an arrowhead in Fig. 5c) and recrystallized grains have a random orientation. A more significant result is obtained from the KAM map of the phase-partitioned images (Figs. 5d–5f). It is evident that thin lamellae of α 2-phase are the most strained region of the lamellar structure, whereas the strain distribution of γ-phase is inhomogeneous in nature. It is well known that α 2/γ phase boundaries are generally impenetrable to moving dislocations and source of stress concentration at the inter-lamellar regions (Singh & Howe, Reference Singh and Howe1992; Kishida et al., Reference Kishida, Inui and Yamaguchi1998). The rigidity of the lamellar structures causes the colony boundary to slide and results in high local stress concentrations at grain boundaries and triple points. At higher strain rates, this stress concentration results in nucleation of cracks or cavities at colony boundaries as it cannot be relieved or accommodated by the dislocation motion. It is to be further noted that the situation is aggravated even more when colony boundaries are devoid of the softer β phase to accommodate the non-uniform strain distribution. A typical example of such cracking both along the colony boundary and inter-lamellar regions is displayed in Figure 6. The presence of remnant β-phase is shown to have a beneficial effect on the workability of these alloys by reducing the cracking tendencies (Singh et al., Reference Singh, Mondal, Kumar, Bhattacharjee and Ghosal2019). The β-phase, being relatively softer than the γ- and α 2-phases at elevated temperatures, deforms preferentially and in that process absorbs the stress generated due to strain incompatibility of the γ- and α 2-phases and the geometrical constraint effect of lamellar structure. At higher temperature and/or lower strain rates, the stress concentration is largely accommodated by the softer β phase and extensive dynamic recrystallization. Partial crack blunting is often observed in the DRX zones near the colony boundaries at a slower strain rate (Singh et al., Reference Singh, Mondal, Kumar, Bhattacharjee and Ghosal2019).
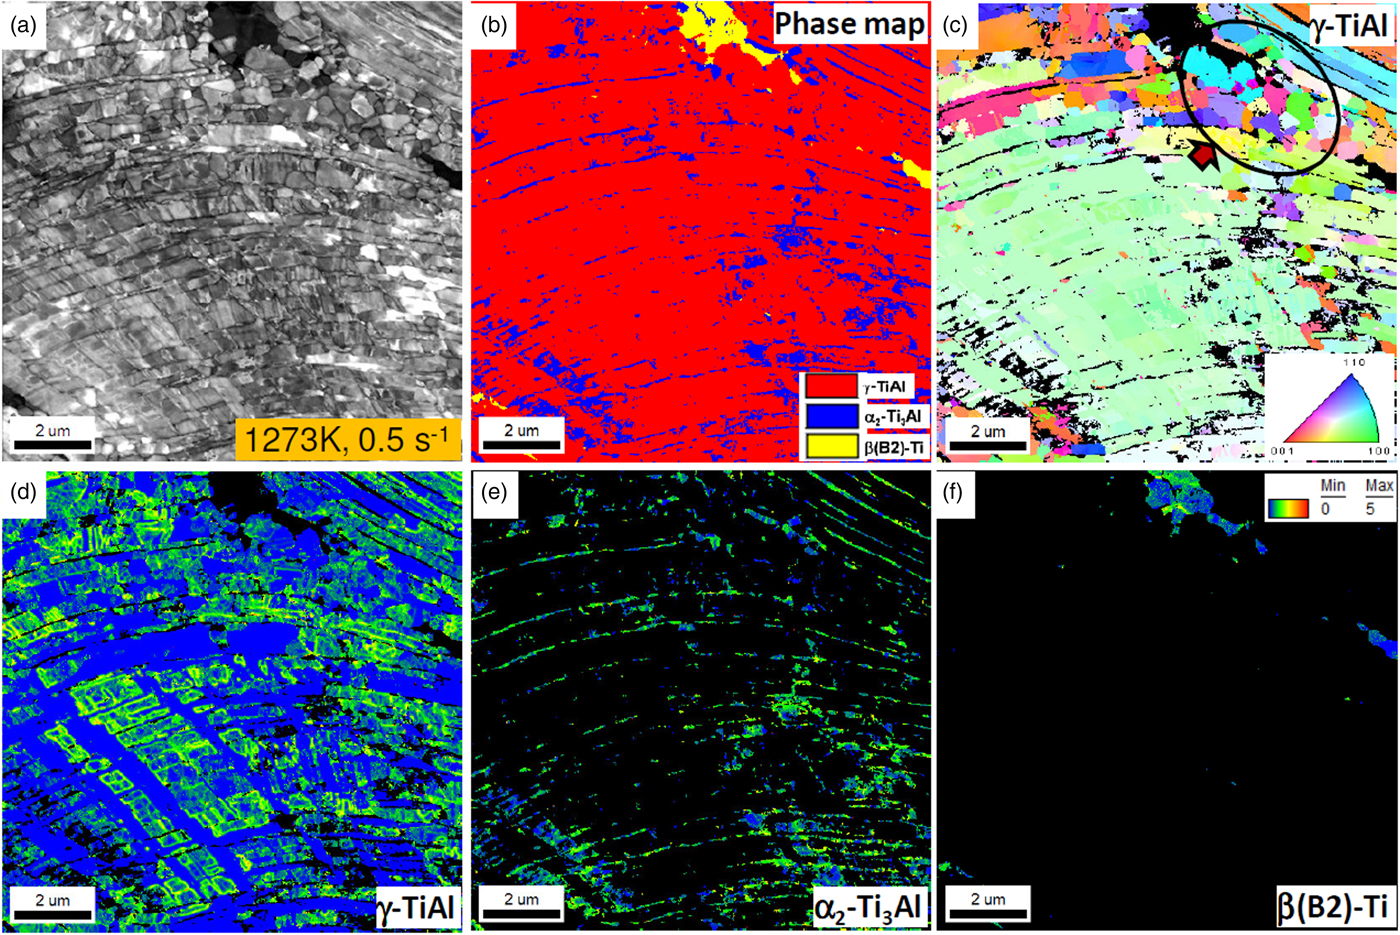
Fig. 5. Characterization of kinked lamellae through high-resolution ACOM/PED of a sample deformed at 1,273 K, 0.5/s: (a) virtual bright-field image, (b) phase map, (c) orientation image of γ-TiAl phase, and (d–f) corresponding phase-partitioned KAM maps of γ-TiAl, α 2-Ti3Al, and β(B2)-Ti phase, respectively.

Fig. 6. SEM image of sample deformed at 1,273 K, 0.5/s showing development of micro-cracks at intra- and inter-lamellar colonies.
DRX and Lamellae Fragmentation
The flow behavior for the present alloy is characterized by the single peak flow curves which are typical of hot deformation of a low SFE material (Singh et al., Reference Singh, Mondal, Kumar, Bhattacharjee and Ghosal2019). The flow stress increases rapidly due to work hardening in the initial stage of deformation then dies down slowly due to dynamic softening processes (Liu et al., Reference Liu, Liu, Li, Zhang and Chiba2011; Niu et al., Reference Niu, Chen, Xiao, Kong and Zhang2011). Aided by the thermally activated phenomena, the fall in the flow stress is commonly attributed to the dynamic softening mechanisms, namely the dynamic recovery (DRV) and dynamic recrystallization (DRX). It has been commonly observed that, owing to their lower SFE and poor mobility of the dislocations, TiAl-based alloys are prone to DRX during hot deformation (Zhang & Appel, Reference Zhang and Appel2002). The post-deformation microstructures generally consist of remnant lamellar colonies [(α 2 + γ) or (α 2 + γ + γ)] interspersed with DRX grains (Figs. 4a, 4c). This inhomogeneous dynamic recrystallization during hot deformation is believed to be associated with the anisotropic plastic properties of lamellar colonies. Although DRX behavior of γ-TiAl, in general, can be examined by the conventional EBSD technique, concurrence of phase transformation with DRX proves to be a hurdle especially at early stages of the DRX phenomenon. ACOM/PED can be effectively used to overcome the difficulties.
Figure 7 exhibits ACOM/PED derived images showing the morphological, micro-textural, and phase-related aspects of DRX grains at the deformation condition of 1,473 K/0.05/s. The virtual bright-field image (Fig. 7a) and corresponding phase map (Fig. 7b) indicate the presence of discrete nucleation of DRX grains of γ as well as α 2-phase. Nucleation and growth of such DRX grains at the interface of two colonies and at the deformation instabilities such as kink bands and bending interface of the colony are evident in the current study and corroborate well with the reported literature (Salishchev et al., Reference Salishchev, Senkov, Imayev, Imayev, Shagiev, Kuznetsov, Appel, Oehring, Kaibyshev and Froes1999). The micro-textural aspects of the DRX grains are shown in phase-partitioned IPF images in Figures 7c and 7d. It can be noticed that most of the DRX γ-grains are associated with the orientations of the parent remnant γ-lamellae (a few of them are marked by arrowheads in Fig. 7c) and size of such grains are significantly larger compared to DRX α 2-grains. On the other hand, it is also observed that the α 2-phase lamellae have prismatic orientations (first or second order corresponding to the {10 $\bar{1}$} and {11 $\bar{2}$} planes, respectively) and apart from the parent lamellae orientations, a few newly formed grains have near basal orientations (Fig. 7d). It is believed that such discrete DRX α 2-grains with basal orientations are formed by discontinuous processes (DDRX), whereas the DRX γ and α 2-grains with near parent orientations are formed by continuous processes (CDRX), due to fragmentations of the bent/kinked lamellar structure. The lamellae fragmentation process is better visualized with the help of KAM map showing discrete bands of highly misoriented zones (Fig. 7e).

Fig. 7. Development of microstructure through high-resolution ACOM/PED of a sample deformed at 1,473 K, 0.05/s: (a) virtual bright-field image, (b) corresponding phase map, (c,d) orientation images of γ-TiAl and α 2-Ti3Al phases, and (e) KAM map of combined γ-TiAl and α 2-Ti3Al phase.
Lamellae Transformation and Substructure Imaging
Evolution of microstructure with progressive deformation with concurrent DRX is an important aspect of hot deformation behavior, as it incorporates deformation of growing DRX grains. Evolution of deformation substructure can be followed by conventional misorientation distribution maps of EBSD data which, in conjunction with a corresponding band contrast/IPF map, gives an indirect idea about the strain distribution. ACOM/PED, on the contrary, is capable of providing direct substructural imaging through the so-called “virtual dark-field imaging” (Rouvimov et al., Reference Rouvimov, Rauch, Moeck and Nicolopoulos2009). An example is displayed in Figure 8 showing the concurrence of deformation and DRX. Figure 8a represents a virtual bright-field image of several DRX grains with significant size variation indicating the stage of their growth. The visualization of the substructure of a large γ-grain is shown in Figure 8b through virtual dark-field imaging. The virtual dark-field image has been obtained from the automatically recorded electron diffraction patterns by fixing a specific reflection spot in one of the captured grains and then the “virtual aperture” is set in which network dislocation structure is visible using the ASTAR software module. The dark-field image map contained the dislocation network structure with the bright contrast and it shows similar regions in other areas also that contribute to the diffracted intensity within the virtual aperture. It is evident that the virtual dark-field image indicated a dynamically recovered γ-grain with “cell”-like substructure. The corresponding KAM map confirms such an interpretation (Fig. 8c).

Fig. 8. Development of microstructure through high-resolution ACOM/PED of a sample deformed at 1,473 K, 0.005/s: (a) virtual bright-field image, corresponding (b) virtual dark-field image, and (c) KAM map of specific γ-TiAl grain. Orientation image maps of (d) γ-TiAl and (e) α 2-Ti3Al phases.
A careful examination of the virtual bright-field image further points to nucleation of transformation in the remnant lamellar colony (marked by an arrow in Fig. 8a). The corresponding IPF maps with partitioned α 2 and γ-phases indicate a possible α-Ti3Al → γ-TiAl transformation occurring in an α 2-lamella (Figs. 8d, 8e). Detailed analysis of the orientation relationship (OR) between the α-Ti3Al and γ-TiAl phases indicates that γ-TiAl phase nuclei partially maintains the Blackburn OR [i.e., {111}γ || (0001)α 2; 〈1–10〉γ || 〈11–20〉α 2 (Blackburn, Reference Blackburn, Jaffee and Promisel1970)], although the fine lamellar structure of the parent colony fully complies with it. Figure 9 elaborates the detailed OR analysis of the two concerned phases.
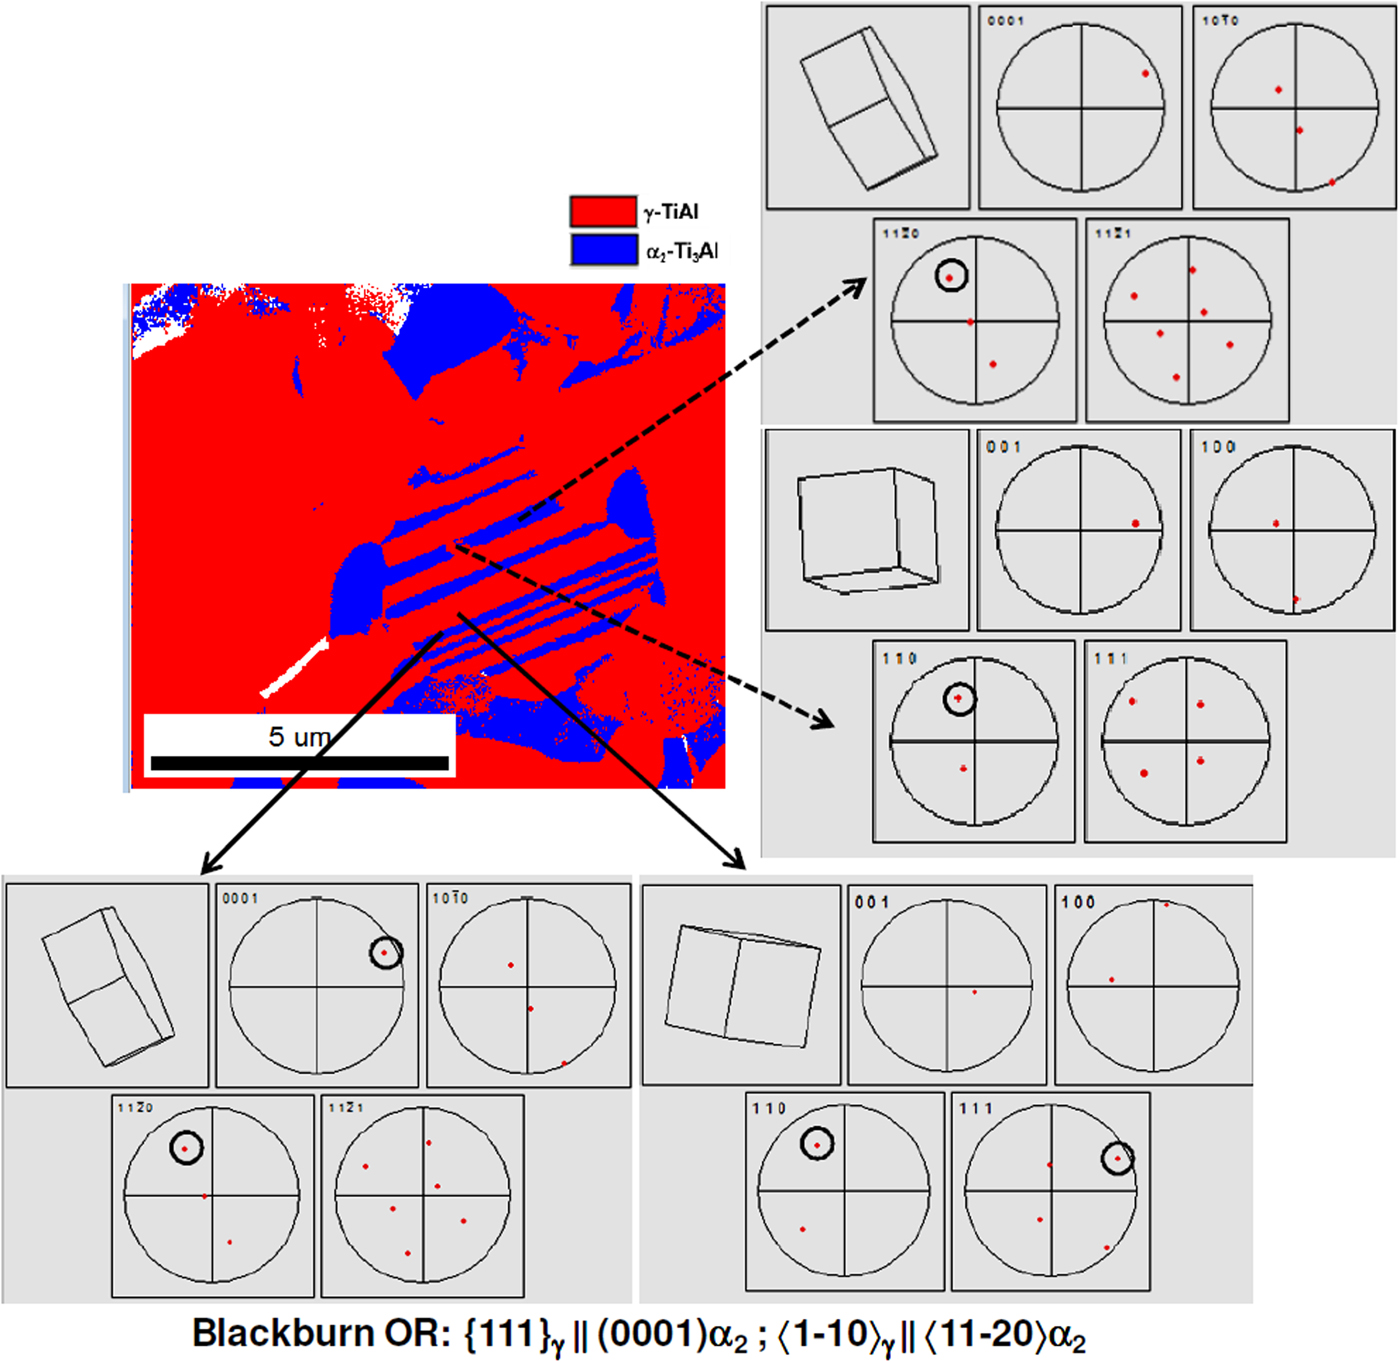
Fig. 9. OR analysis of the remnant colony of a sample deformed at 1,473 K, 0.005/s.
Conclusions
In the current paper, microstructural evolution during hot deformation of a Ti–45Al–8Nb–2Cr–0.2B (at.%) alloy has been studied using comparative analyses of the ACOM/PED method and conventional EBSD technique. The following conclusions can be drawn.
(1) The ACOM/PED technique can be effectively utilized to decipher the “true” nature of the multiphase lamellar microstructure of complex γ-TiAl alloys by combining the orientation/phase analyses with the high-spatial resolution for finer scale features in the present material. It enables acquisition of high-resolution microstructural information at a relatively low magnification with high accuracy for statistically viable post-mortem data analyses.
(2) The highly inhomogeneous deformation behavior of a kinked lamellar colony having thin discontinuous α 2-lamellae has been revealed. It has been shown that the thin lamellae of α 2-phase are the most strained region of the lamellar structure, whereas the γ-phase deforms in an inhomogeneous manner. The analyses point out the possible cause of inter-lamellar crack initiation.
(3) Observation of lamellae fragmentation and DRX behavior suggests that the DRX process of the present γ-TiAl alloy is controlled by both DDRX and CDRX. The DRV process of a large γ-TiAl grain has also been confirmed as a part of the dynamic restoration process.
(4) The direct substructural imaging through “virtual dark-field imaging” could provide vital information on the nature of dynamic restoration processes occurring during hot deformation.
Acknowledgment
The authors wish to acknowledge the financial support from Defence Research and Development Organization, Government of India. One of the authors (VS) is also grateful to Dr. Rajdeep Sarkar and Mr. Suraj Kumar, scientists, DMRL for TEM study and many stimulating discussions. The authors gratefully acknowledge the help rendered by Dr. Atul Kumar in carrying out hot compression tests.


