


Introduction
Water is one of the most ubiquitous fluids on the Earth's crust, and constitutes as a major component of living organisms. Biological tissues and cells appear most natural in the presence of water, and investigating their morphology at orders below the optical limit is key to understanding the basis for their structure and function. High-resolution imaging methods that allow observation of their structure and property from the scale visible to the naked eye down to sub-micrometer and nanometer scales are essential, and scanning electron microscopy (SEM) is a great tool for this as it can seamlessly image surfaces from millimeter scale to nanometer scale. One disadvantage of conventional SEM, however, is that samples need to be dried prior to observation, destroying the surface nanostructure (Takaku et al., Reference Takaku, Suzuki, Ohta, Ishii, Muranaka, Shimomura and Hariyama2013). To prevent changes in the nanostructure upon drying, a number of sample preparation methods (such as critical-point drying and freeze drying) have been developed as well as microscopic methods—two examples of which are environmental SEM, where samples are kept under ~103 Pa and observed at ~1°C (Timp & Matsudaira, Reference Timp, Matsudaira, Correia and Detrich2008; KIRK et al., Reference Kirk, Skepper and Donald2009; Abed et al., Reference Abed, Ibnsouda, Latrache, Hamadi and Kazmiruk2012), and cryogenic-temperature SEM (cryo-SEM) or low-temperature SEM, where samples are frozen (typically at −130 to −180°C) to prevent water evaporation at ~10−5 Pa (Fleck & Humbel, Reference Fleck and Humbeln.d.; Hayles & Winter, Reference Hayles and Winter2021; Ya'akobi & Talmon, Reference Ya'akobi and Talmon2021). Superior high-resolution images can be obtained with cryo-SEM, as the high vacuum allows the use of focused electron beam without scattering (Danilatos & Robinson, Reference Danilatos and Robinson1979).
Today, Cryo-SEM is widely applied in food science (Dudkiewicz et al., Reference Dudkiewicz, Tiede, Loeschner, Jensen, Jensen, Wierzbicki, Boxall and Molhave2011), pharmaceuticals (Koifman & Talmon, Reference Koifman and Talmon2021), and cell biology (Graham et al., Reference Graham, Austin, Kaech and Heuser2008) to observe emulsions (Klang et al., Reference Klang, Matsko, Valenta and Hofer2012), gels (Isobe et al., Reference Isobe, Tsudome, Kusumi, Wada, Uematsu, Okada and Deguchi2020; Liang et al., Reference Liang, Xiao, Chou and Libera2021), and cells (McCully et al., Reference McCully, Canny, Huang, Miller and Brink2010), utilizing its ability to image structures in the near-natural state in aqueous media. To obtain frozen samples reflecting the natural, hydrated state, ice crystallization should be avoided since low-density ice expands upon crystallization to damage the structure (Delgado & Rubiolo, Reference Delgado and Rubiolo2005; Meryman, Reference Meryman2007; Zhmakin, Reference Zhmakin2008; Dalvi-Isfahan et al., Reference Dalvi-Isfahan, Jha, Tavakoli, Daraei-Garmakhany, Xanthakis and Le-Bail2019). For this, numerous rapid-freezing techniques have been developed, such as plunge freezing (Dubochet et al., Reference Dubochet, Adrian, Chang, Homo, Lepault, McDowall and Schultz1988), metal-contact freezing (Harreveld & Crowell, Reference Harreveld and Crowell1964), and high-pressure freezing (Moor & Riehle, Reference Moor and Riehle1968; Dahl & Staehelin, Reference Dahl and Staehelin1989; Leunissen & Yi, Reference Leunissen and Yi2009), where samples are frozen in metallic sample carriers. Once the samples are frozen, they are stored and transported in liquid nitrogen, the carrier is mechanically fixed on an appropriate transferring shuttle, and then transferred to cryo-SEM (Kaech & Ziegler, Reference Kaech, Ziegler and Kuo2014; Hayles & Winter, Reference Hayles and Winter2021).
In cases where the specimen is already frozen outside an appropriate sample carrier for cryo-SEM, however, the traditional methods for sample fixation are not always applicable. These include, for example, frozen food in the field of food industry and biological samples freeze-preserved during fieldwork (Schiaparelli et al., Reference Schiaparelli, Schnabel, de Forges, Chan, Clark, Consalvey and Rowden2016). In the latter case, sophisticated sample preparation such as high-pressure freezing and traditional chemical fixation using glutaraldehyde is not always possible in the field due to limitations in the availability of space, chemicals, refrigerants, and environmental issues such as the movement of research vessels for seagoing research. Biological samples are conventionally stored in a deep freezer kept at −80°C, sometimes after rapid-freezing in liquid nitrogen. As the freeze-thaw cycle further destroys the sample's nanostructures, the sample should remain frozen before being subjected to cryo-SEM observation. To mount small samples with non-standard shape (not in the appropriate sample carrier) for cryo-SEM, the de facto standard method is to use an adhesive working at low temperature, such as the optimal cutting temperature (O.C.T.) compound, a vitreous and insulative aqueous solution of poly(vinyl alcohol) and poly(ethylene glycol) (Ruan et al., Reference Ruan, Tulloch, Muskheli, Genova, Mariner, Anseth and Murry2013). This compound is fluid at room temperature and freezes at ca. −30°C and is widely used in cryo-microtome sectioning (Hayles et al., Reference Hayles, Stokes, Phifer and Findlay2007). Due to its high freezing point, frozen samples need to be heated up close to the melting point of ice to mount, which causes substantial disruption to the micro- and nanostructure of sub-millimeter to millimeter-sized samples. As far as we are aware, there has been no appropriate adhesive meeting the ideal criteria for use in cryo-SEM.
The ideal adhesive for cryo-SEM should meet at least the following five criteria: (a) conductive, to reduce the sample charge-up; (b) capable of adhering to both metallic substrate (typically aluminum and brass) and wet biological sample so it does not fall while the stage is being tilted; (c) fluidic at the desirable, cold, temperature for sample mounting, for example on dry ice (−78°C), one of the most conventionally available refrigerants with temperature close to a typical deep freezer; (d) solidified (instead of sublimed) during the removal of adsorbed water by sublimation in a preparation chamber [typically at −90°C under 10−3 Pa (Feistel & Wagner, Reference Feistel and Wagner2007)]; and (e) free of heavy atom contaminations, for elemental analysis using energy-dispersive X-ray spectroscopy (EDS). Furthermore, when considering re-using the same sample for further experiments and analyses, the adhesive should meet two additional criteria: (f) easily washed away using water or conventional organic solvents and (g) contamination due to the remaining adhesive after washing can either be totally removed or easily distinguished under electron microscopy. Since nonaqueous solvents used as adhesives are mostly insulative, conductive additives are required to meet the criteria above. This additive should meet three criteria: (h) commercially available or can be prepared with ease; (i) can be stably dispersed homogeneously; and (j) does not interfere with the elemental analysis of trace elements within organic samples.
Polymers and polymeric solutions do not meet these 10 criteria simultaneously, especially the low freezing point in criterion (c). Taking hints from wet adhesives using catechol utilizing multiple hydrogen bonding and chelation, whose structure mimics the adhesion mechanism of mussel byssus threads (Ahn et al., Reference Ahn, Lee, Israelachvili and Waite2014; Filippidi et al., Reference Filippidi, Cristiani, Eisenbach, Waite, Israelachvili, Ahn and Valentine2017; Han et al., Reference Han, Yan, Wang, Fang, Zhang, Tang, Ding, Weng, Xu, Weng, Liu, Ren and Lu2017; Cui & Liu, Reference Cui and Liu2021), we investigated multiple hydrogen bonding-based adhesives composed of an organic solvent exhibiting a melting point below dry-ice temperature, and a conductive additive that does not contract to decrease conductivity upon freezing. Here, we propose a mixture of 1,3-butanediol (BO) and graphite oxide (GO) as an easy-to-operate cryogenic adhesive for cryo-SEM imaging of pre-frozen samples, which enables not only sample imaging but also high-voltage applications including EDS. We investigated several concentrations of GO in BO (GOx/BO, where x is the weight percentage of GO), and found that GO30/BO was the most suitable for cryo-SEM imaging of pre-frozen samples.
Materials and Methods
Materials
All synthetic reagents were purchased from Nacalai tesque Inc., Fuji Film Wako Pure Chemical Co., Kanto Chemical Co., Inc., or Tokyo Kasei Industry Co., Ltd., and used as-received. Deionized water was supplied from Merck Milli-Q Integral 5. Aluminum (>99.5%, A1050), brass (C3604), and copper (>99.9%, C1100) were used as adherends and aluminum (A5052) was used as a substrate, these metals were purchased from E-Metals Co., Ltd., or MISUI Group Inc. Chicken liver and pig muscle was purchased from a local supermarket (Co-op Mirai, Japan). Diatomite was purchased from Fuji Film Wako Pure Chemical Co. Live individuals of the prismatic deep-sea snail Margarites shinkai were collected using the manipulator of DSV Shinkai 6500 at the Off Hatsushima seep site, Sagami Bay, Japan (35°00.9405′S, 139°13.3901′E, Okutani et al., Reference Okutani, Tsuchida and Fujikura1992). The samples were immediately immersed in slush nitrogen (ca. −210°C) in a brass tube for more than a minute to rapidly freeze the exoskeleton and stored at −80°C during the cruise and transferred to a liquid nitrogen tank (<−160°C) after the cruise.
Synthesis of GO and Its Dispersant
GO was synthesized following the modified Hummers’ methods (Zaaba et al., Reference Zaaba, Foo, Hashim, Tan, Liu and Voon2017). Graphite (10.1 g) was added to a mixture of sulfuric acid (270 mL) and phosphoric acid (30 mL) stirred in an ice bath to obtain a black suspension. Potassium permanganate (13.2 g, 0.1 equiv. against carbon atom) was slowly added, the ice bath was removed, and stirred for 5 h at room temperature. The reaction was quenched by the addition of hydrogen peroxide solution (33%, 30 mL) followed by hydrogen chloride solution (3 M, 600 mL). The suspension was centrifuged at 15,000 rpm for 5 min, decantated, and re-dispersed in water. The solution was filtered and re-dispersed in water three times to wash out acids and inorganic salts. After three washes, the pH of the filtrate became >6, indicating acid has been removed. The aqueous dispersion was freeze-dried (FDU-1200, EYELA) to obtain GO (15.9 g).
GO (0.6 g) and BO (1.4 g) were mixed in an Eppendorf tube (5 mL) and homogenized using a probe sonicator (Sonic Ruptor 250, OMNI International, power = 30) for 1 min to obtain a viscous black suspension.
Characterization of GO
SEM was performed on a Helios G4 UX (Thermo Fisher Scientific) equipped with gallium focused ion beam (FIB) gun, an EDS detector (Octane Elite Super C5, AMETEK), and a cryogenic stage with a preparation chamber (PP3010T, Quorum). GO powder was pasted on a double-sided carbon tape on an aluminum pin stub and imaged in SEM at the acceleration voltage of 1 kV. For EDS analysis, the same sample was analyzed at the landing voltage of 20 kV, and the atomic ratio was analyzed by a ZAF correction method using TeamEDS 4.6 (AMETEK).
Transmission electron microscopy (TEM) was performed on a Tecnai G2 20 (Thermo Fisher Scientific, operated at 200 kV) equipped with a bottom-mounted 2 k × 2 k Eagle CCD camera (Thermo Fisher Scientific). GO was dispersed in methanol at 1 mg/mL concentration in a sonication bath for 1 min, 10 μL of the dispersion was dropped onto a holey carbon microgrid (NP-C15, Okenshoji), blotted, dried under vacuum, and subjected to TEM imaging.
Raman spectroscopy was performed on a Raman microscopy RAMANtouch VIS-HP-MAST (Nanophoton) equipped with a solid-state laser operating at 532 nm, 600 mm−1 grating, and 50× objective lens. Wavenumber was calibrated by a peak from silicon wafer (520 cm−1). Solid sample was placed on a glass slide, 1 × 10⁵ W/cm2 laser was irradiated for 5 s, and 20 spectra were summed up using RAMAN Imager 2 (Nanophoton). The obtained spectra were fitted by two Gaussian and three pseudo-Voigt functions at 1,050–1,750 cm−1 region on Peak Fitting (Nanophoton), and the intensity ratio of D-band (~1,350 cm−1) and G-band (~1,550 cm−1) (D/G) was converted to the amount of sp 2 carbon (Csp2) by Csp2 = (2.076–D/G)/0.00905 following the literature calculations (López-Díaz et al., Reference López-Díaz, Holgado, García-Fierro and Velázquez2017). Spectra were acquired at five different positions and the average as well as the standard deviation were reported.
Surface Resistance Measurement
Surface resistance was measured using the digital multimeter M832 (Mastech, maximum resistance; 2,000 kΩ). The testing liquid was placed on a glass slide, and test leads were touched on the surface at a distance of 11.0 mm. Temperature-dependent resistance was measured using the same method while cooling the substrate, and the liquid temperature was monitored by CENTER 520 thermometer (MK Scientific, Inc.) equipped with a thermocouple type K.
Measurement of Adhesion Strength
Adhesion strength was measured using a digital force gauge (DST-50, Imada CO., Ltd.) with a milled aluminum as the substrate (>99.5%) and blocks of aluminum (A1050, >99.5%), copper (C1100, >99.9%), or brass (C3604B, 5 × 5 mm bottom) as adherends. Metallic adherends were cut, milled, and ground using sandpapers (#320 and #600) to expose a flat surface, and the side was drilled to pass through a copper (0.18 mm ϕ) or steel wire (0.5 mm ϕ) for pulling. Chicken liver and pig muscle were used as examples of biological samples, and they were cut (ca. 5 × 5 mm bottom) by a scalpel and a steel wire loop was pierced. BO or GO30/BO (10 μL) was placed onto the substrate using a positive displacement micropipette (Microman E, Gilson), and put on a block of dry ice. Adherends were placed on the adhesive for more than 15 min to ensure that the adhesive was thermally equilibrated. The looped wire was pulled using the digital force gauge, and the maximum force was recorded. Similarly, the adherends placed on the adhesive on a block of dry ice were moved onto liquid nitrogen so that the adhesive did not directly touch liquid nitrogen, and the maximum pulling force was measured after the bubbling of liquid nitrogen stopped. The adhesion area was measured from photos of the adherends taken perpendicular to the adhesion surface, trimmed on Affinity Photo 1.10.4, and analyzed on Fiji (Schindelin et al., Reference Schindelin, Arganda-Carreras, Frise, Kaynig, Longair, Pietzsch, Preibisch, Rueden, Saalfeld, Schmid, Tinevez, White, Hartenstein, Eliceiri, Tomancak and Cardona2012). The force measurements were repeated more than three times using more than three metal blocks, or for more than three biological samples.
Freeze-Fracture of Animal Samples
Chicken liver and the pig muscle were frozen in liquid nitrogen and trimmed to ca. 3 × 3 × 10 mm using a saw pre-cooled in liquid nitrogen. For mounting, we used standard aluminum stubs (10 mm ϕ) equipped with a M4 × 8 mm tapped hole, where we filled the hole with GO30/BO and placed a piece of the animal sample inside the hole, with more than 3 mm of the sample protruding from the stub surface. The mounted stub was frozen in liquid nitrogen for more than 5 min. The lateral force was applied to the protruding part of the animal sample using a digital force gauge (DST-50) equipped with a liquid nitrogen-cooled wedged probe, and the maximum stress before freeze-fracturing of animal samples was measured. The cross-sectional area of the animal samples was measured from photos taken perpendicular to the stub surface and analyzed as described above. The measurements were repeated five times for each animal sample.
Cryo-SEM imaging of a freeze-fractured chicken liver was performed as follows. The chicken liver was mounted in the same manner as above, and the sample was vacuum transferred to a preparation chamber of cryo-SEM, then fractured by a cooled swing knife equipped within the chamber. The stage/knife temperature of the preparation chamber was ca. −160°C. The fractured surface was sublimed at −85°C for 10 min, transferred to the SEM chamber, and observed at the stage temperature of −150°C, the acceleration voltage of 2 kV, and the beam current of 13 pA.
Electron Microscopic Imaging of Diatomite and M. shinkai
Powders of diatomite (~1 mm3) were placed using a spatula onto an aluminum stub with GO30/BO cooled on a block of dry ice, and excess diatomite was blown away using nitrogen gas. Sequential cryo-SEM images were obtained at the stage temperature of ca. −135°C. Still images were acquired at the acceleration voltage of 2 kV, the beam current of 100 pA, and the dwell time of 300 ns/pixel, and 64 images were integrated after drift correction. Movies were collected at the acceleration voltage of 20 kV, the beam current of 400 pA, and the dwell time of 300 ns/pixel, corresponding to 750 electrons/pixel or 4.4 × 10⁵ electrons/μm2, and EDS spectrum was acquired at the same voltage and current.
The cross-sectional backscattered electron images of the ethanol-dried shell of M. shinkai were observed on a benchtop SEM (TM3030, Hitachi) operated at 15 kV. The shell was mechanically fractured with tweezers and mounted on an aluminum stub by a double-sided carbon tape, and imaged without any conductive coatings.
To observe the freeze-dried shell of M. shinkai, a snail stored in liquid nitrogen was dried under vacuum (<5 × 10⁻² Pa), the shell was trimmed by tweezers, and mounted on an aluminum stub with carbon paste. The sample was observed at the stage temperature of ca. −135°C at the acceleration voltage of 1 kV. Shell cross-section was exposed by FIB milling, operated at 30 kV, 65 nA then at 9.1 nA, and observed in SEM at the landing voltage of 1 or 2 kV.
To observe the pre-frozen shell of M. shinkai, GO30/BO (100 μL) was placed in a 10 mmϕ aluminum stub with 8 mmϕ × ~3 mm drilled hole, mounted on a transfer shuttle, and cooled on a block of dry ice. Liquid nitrogen-frozen individual of M. shinkai was placed on the GO30/BO paste using tweezers whose tips were pre-cooled by liquid nitrogen, then the bottom of the shuttle was put in contact with liquid nitrogen. After the bubbling stopped, the shuttle was vacuum transferred to a preparation stage, where the surface-adsorbed water was defrosted at −90°C for 10 min under <2 × 10⁻² Pa. The sample was observed under the same condition as the freeze-dried snail.
X-Ray Diffraction of the M. shinkai Shell
Dried shells were cut into pieces and mounted on an X-ray diffractometer X'Pert PRO (PANalytical) with a Cu radiation source (Kα = 1.5418 Å) at 45 kV and 40 mA. The diffractogram from 5° to 80° was acquired at 0.05° step at the scan speed of 0.07° s−1. Mineral species were assigned on HighScore 3.0.5 (PANalytical). Relative intensities were analyzed by dividing normalized theoretical diffractogram of aragonite (Villiers, Reference Villiers1971) by background-corrected and normalized diffractogram of the snail's shell. Peaks were recorded when the normalized intensity from the snail's shell was larger than 0.2 and either the divided intensity was larger than 2.0 or smaller than 0.35.
Results
Selection and Preparation of Cryogenic Adhesives and Conductive Additives
Organic solvent meeting the abovementioned temperature criterion was surveyed from the literature (Supplementary Table S1; Rumble, Reference Rumble, Rumble, Lide and Bruno2017). Among the 12 solvents exhibiting both a melting point around −78°C and a boiling point higher than that of water, BO was selected due to its safety upon contact with human skin (Anon, 1985), availability, chemical stability, and the ability to form multiple hydrogen bonds. In addition, BO is miscible in methanol (melting point, −97.6°C), and can be washed away in a −80°C freezer.
Since BO is an insulative liquid, a conductive additive was selected among carbon-based materials, due to their low atomic contamination in EDS analysis. Among several forms of carbon, Ketjen Black (porous amorphous carbon nanoparticles) (Nelson & Wissing, Reference Nelson and Wissing1986) and graphitic materials including GO were our first choices due to their high availability and low cost. We selected GO because a previous study using Ketjen Black as an additive of epoxy resin for serial block-face SEM imaging resulted in the samples suffering from the internalization of Ketjen black into the cells (Nguyen et al., Reference Nguyen, Thai, Saitoh, Wu, Saitoh, Shimo, Fujitani, Otobe and Ohno2016), and because we can chemically control properties such as size and the degree of oxidation when using GO.
We synthesized GO following a modified Hummers’ method without sodium nitrate in order to prevent a total loss of conductivity through overoxidation (Zaaba et al., Reference Zaaba, Foo, Hashim, Tan, Liu and Voon2017), and characterized it using SEM, TEM, XRD, as well as Raman spectroscopy. The black GO powder obtained was dispersible in water at more than 50 g/L, implying its hydrophilicity. The freeze-dried GO exhibited a flakey morphology when observed in SEM, with the typical size of the flakes being 5–20 μm (Fig. 1a). The stacked sheet-like structure was observed on the cross section (Fig. 1b), exhibiting layers with the minimum thickness of 6.8 ± 2.1 nm (N = 51, red arrow in Fig. 1c) aggregating to form stacked sheets of 44 ± 21 nm in thickness (N = 13, yellow arrow in Fig. 1c). The SEM/EDS analyses showed that the carbon/oxygen atomic ratio was 4.0, indicating that sp 2 carbon remained. The remaining contaminants of phosphorous, sulfur, chlorine, and manganese were detected even after three washes with water, though the amount of each element was less than 0.5 atom% (Figs. 1d, 1e). The TEM image showed the multilayered structure of GO (Supplementary Figs. S1a–1c). The selected area electron diffraction (SAED) revealed a strong hexagonal pattern corresponding to 2.18, 1.25, and 1.10 Å, corresponding to the  ${ {10\bar{1}0} }$, ${ {11\bar{2}0} }$, and ${ {20\bar{2}0} }$ planes of graphite, respectively (Supplementary Fig. S1d; Lipson & Stokes, Reference Lipson and Stokes1942). Results from XRD demonstrated a slight peak shift of the ideal graphitic (002) peak from 2θ = 26.5° to 25.8°, indicating the increase in inter-layer distance from 3.36 to 3.45 Å by oxidation (Supplementary Fig. S2). Raman spectroscopy and spectrum deconvolution at 1,100–1,750 cm−1 were performed, estimating the amount of sp 2 carbon to be 78 ± 7% (Supplementary Fig. S3 and Table S2;López-Díaz et al., Reference López-Díaz, Holgado, García-Fierro and Velázquez2017). These results indicate that the oxidized graphite acquired water dispersibility in the form of stacked sheets, while still maintaining π-conjugation.
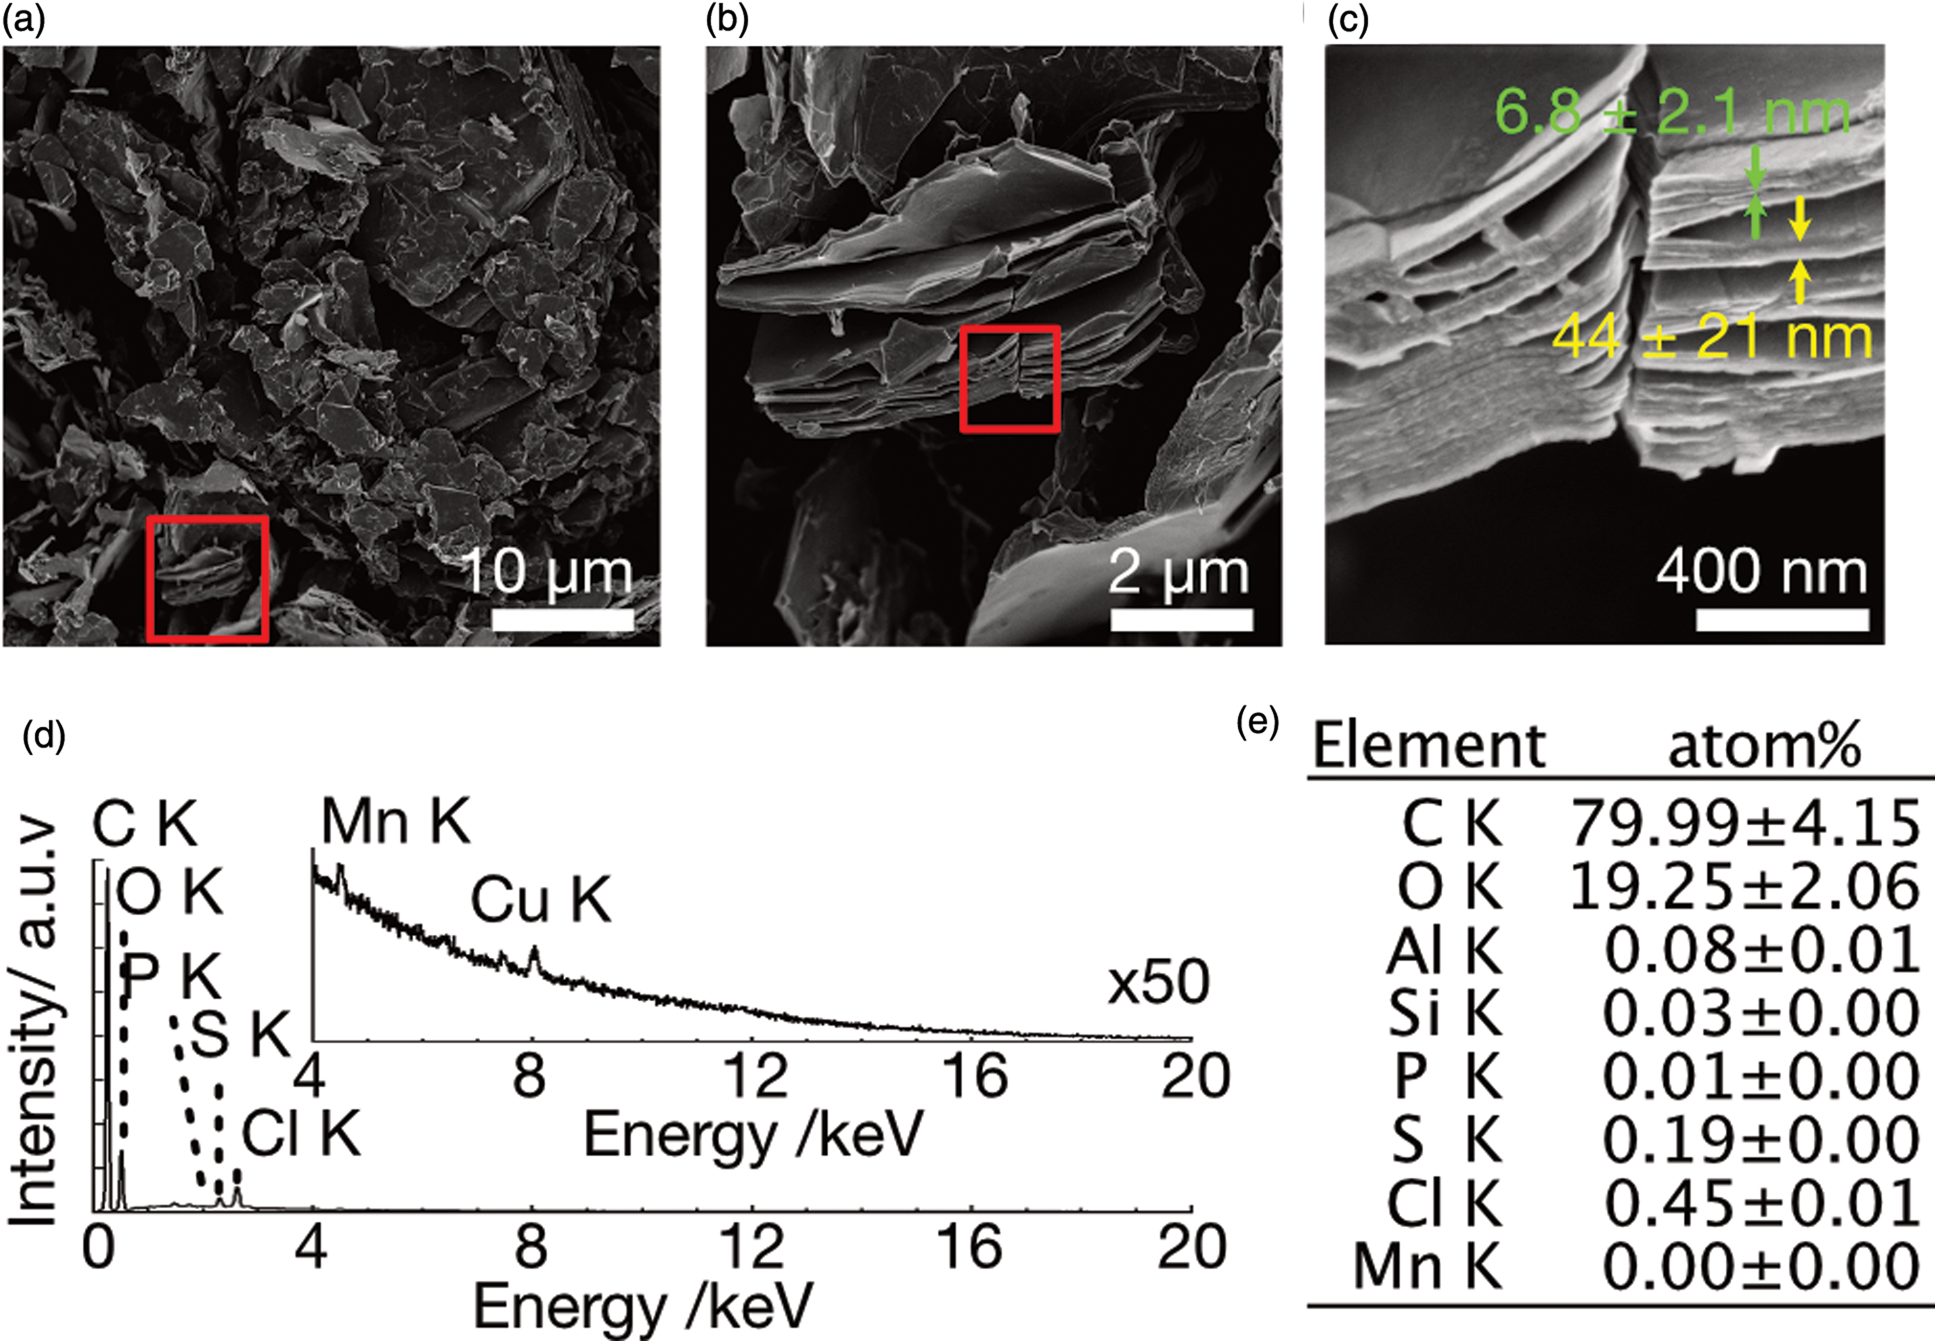
Fig. 1. SEM images and EDS analysis of GO after three washes with water. (a) Low magnification image. (b) Magnified image of the red rectangle in (a). (c) Magnified image of the red rectangle of (b). Red and yellow arrows indicate the thickness of GO flakes and their stacks, respectively. (d) EDS spectrum of GO. The inset shows 50 times magnified spectrum. (e) Quantitative analysis of EDS showing the atomic ratio of elements.
GO was dispersible in BO, and the dispersant was homogenized by probe sonication to prepare the adhesive (Supplementary Fig. S4). Several concentrations of GO in BO were tested, up to 30 wt% and 30 wt% dispersion of graphite in BO (G/BO). GO50/BO was a wet solid and could not be homogenized. GO20/BO, or those with lower GO concentrations, were sufficiently fluid to flow from the wall of Eppendorf tube, while GO30/BO was a sticky dispersion resulting in the Eppendorf tube wall remaining black even after a week (Supplementary Fig. S4). GO20/BO and GO30/BO were stable for more than a week under room temperature without visible precipitation, while G/BO and GO10/BO partially phase separated within a week. The surface resistivity of GO30/BO was 25 kΩ [28-004] at 23°C, while that of pure BO exceeded 2 MΩ, indicating that GO functioned as a conductive additive. The resistance is temperature-dependent, and exceeded 2 MΩ at <−50°C. On the other hand, G/BO with black luster had >2 MΩ of resistivity at 23°C. These results indicate that dispersed GO formed dynamic conductive networks within BO.
Charge-up of Cryogenic Adhesive Under Imaging Condition
To determine the optimum mixing ratio of GO in BO under cryo-SEM, SEM imaging of adhesives with 0, 10, and 30 wt% GO was performed at 2, 5, 10, 20, and 30 kV of landing voltage at 0.4 nA of beam current at −135°C, simulating the condition of EDS analyses (Fig. 2). In SEM images of samples with 0 and 10 wt% of GO, horizontal line contrast, inhomogeneous background contrast, and image drift were observed due to charge-up. Significant charge-up noise was observed above 5 kV for BO and 5–10 kV for GO10/BO. The background contrast was inhomogeneous on GO10/BO above 20 kV. In contrast, image drift was not observed, and line artifacts were reduced in GO30/BO, though background contrast was still inhomogeneous, showing that the compound had increased conductivity. From these results, the optimum amount of GO in BO was set as 30 wt%.
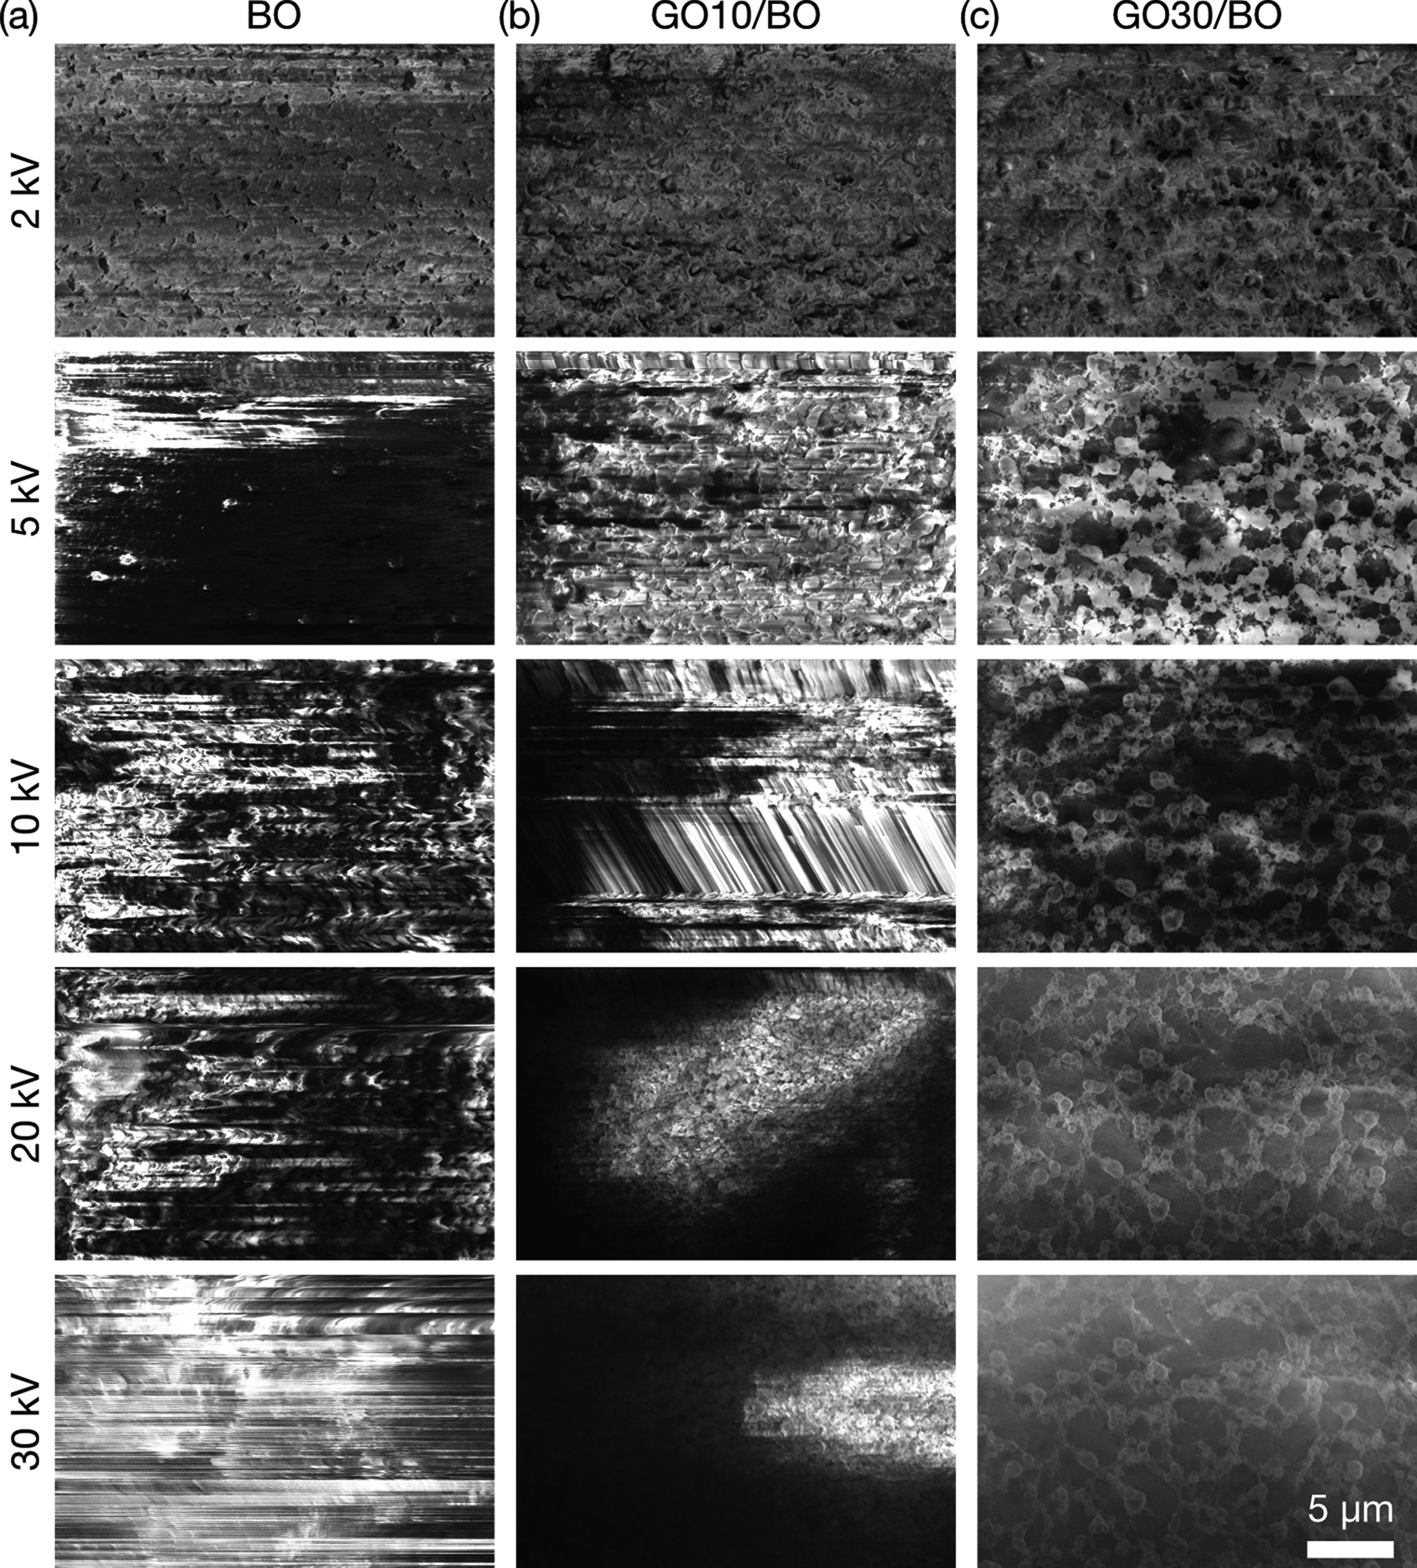
Fig. 2. SEM images of GO/BO mixtures at the stage temperature of −135°C. The concentration of GO is (a) 0, (b) 10, and (c) 30 wt%. Images were obtained at 2, 5, 10, 20, and 30 kV of acceleration voltage from top to bottom, 0.40 nA of beam current, and 10 μs of dwell time.
Mechanical Strength of the Cryogenic Adhesive
Adhesion strength of GO30/BO was measured using an aluminum plate as the substrate and aluminum, brass, and copper as model adherends (Fig. 3; Supplementary Table S2 and Fig. S5). On dry ice (−78°C), BO and GO30/BO existed as viscous and fluidic materials, and metal blocks were adhered by pressing. Peeling experiment using pure BO showed a cohesive fracture, and the adhesion strength was 36 ± 1 (N = 5), 43 ± 5 (N = 4), and 49 ± 10 N/cm2 (N = 5) for aluminum, brass, and copper, respectively. When using GO30/BO, the adhesion strength increased to 92 ± 13 (N = 5), 125 ± 22 (N = 4), and 142 ± 35 N/cm2 (N = 5) for aluminum, brass, and copper, respectively. When samples were mounted at −78°C with GO30/BO followed by cooling in liquid nitrogen (−196°C), an adhesive fracture was observed where adhesives were attached on the adherends, and the adhesion strength dropped to ~1/5; 18 ± 6 (N = 4), 31 ± 28 (N = 4), and 52 ± 43 N/cm2 (N = 3) for aluminum, brass, and copper, respectively. Freezing sound was noticeable during freezing, indicating the volumetric shrinkage of the adhesive.
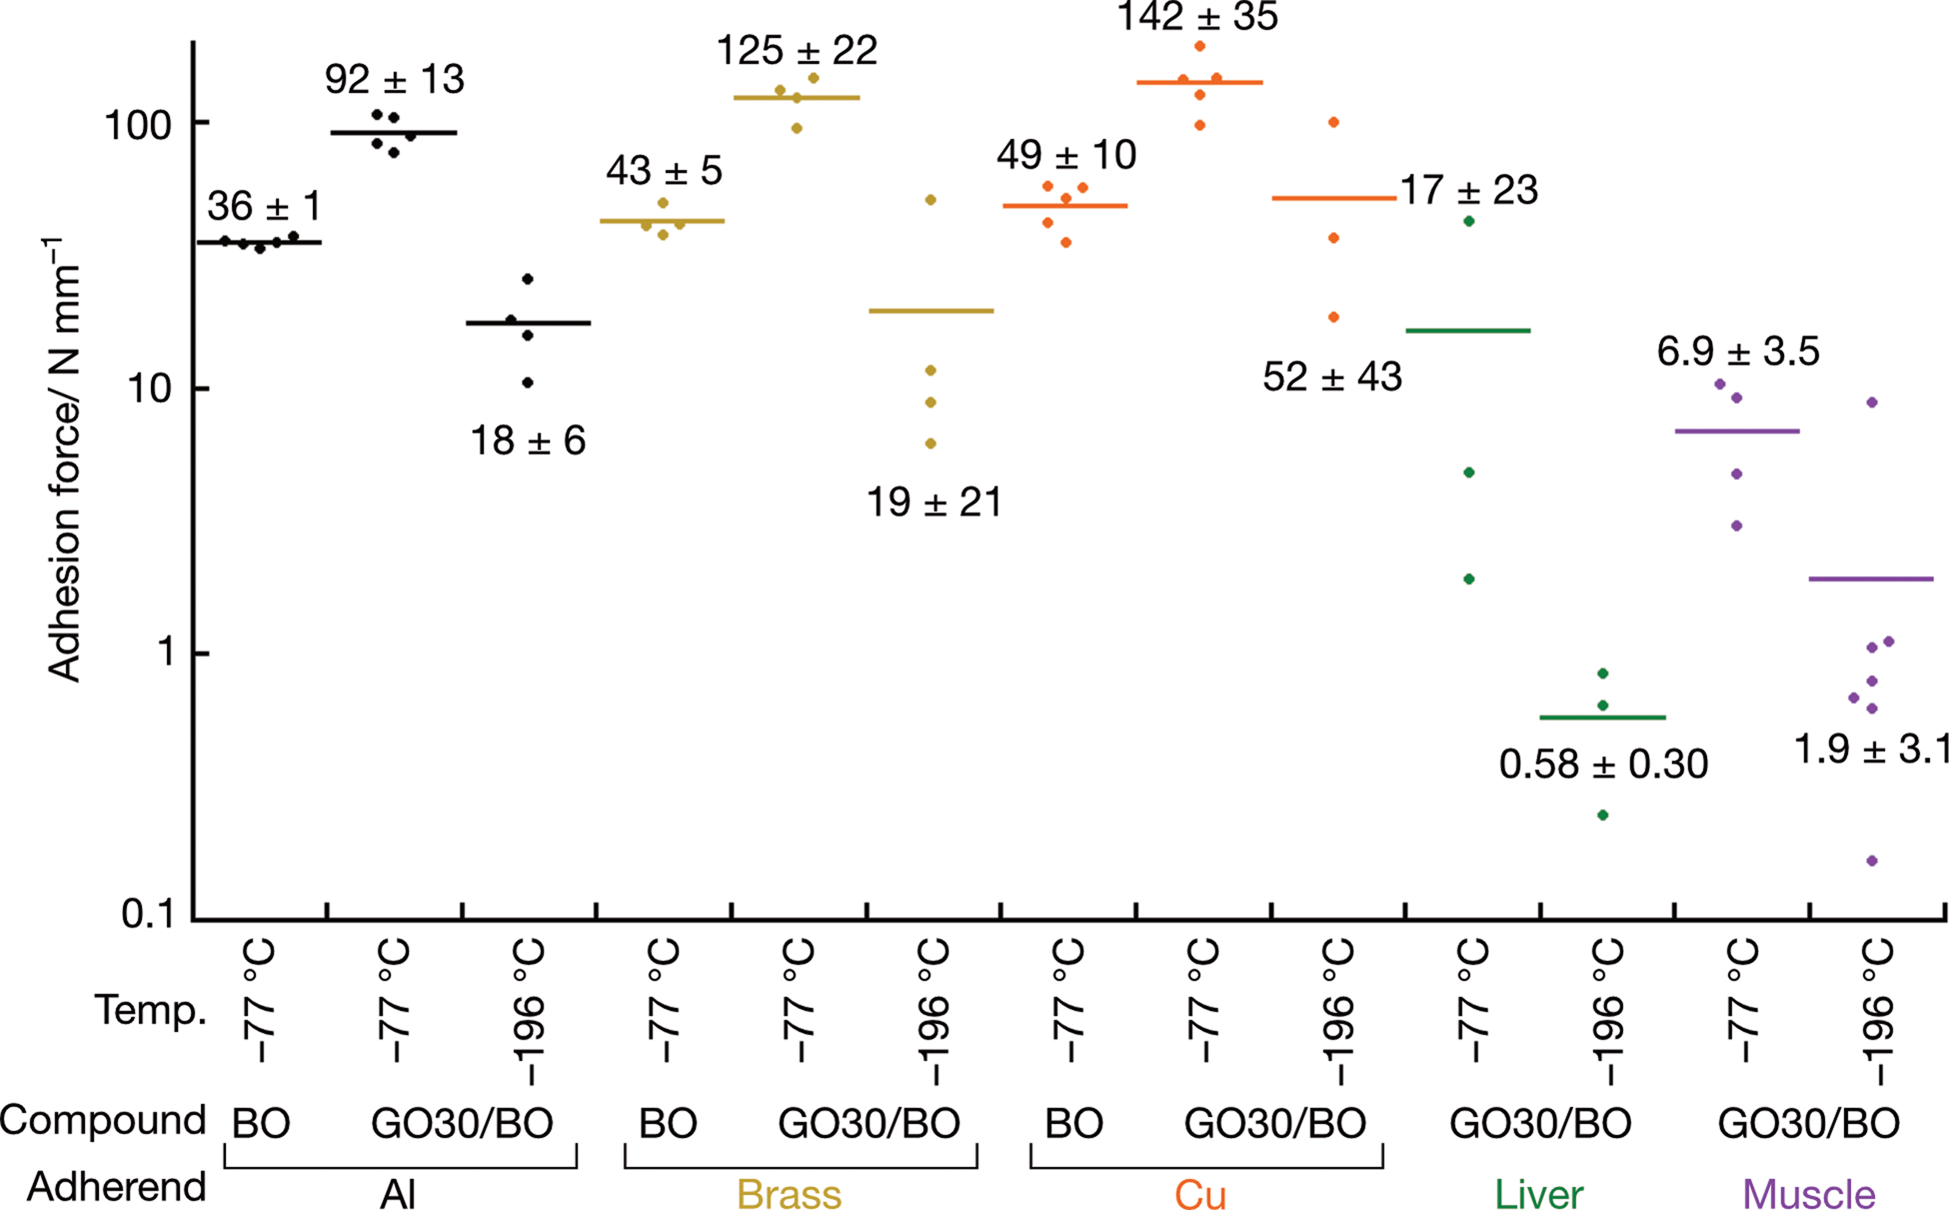
Fig. 3. Adhesion force of GO30/BO between the aluminum base plate and sample blocks. Average values are shown in bars and the average ± standard deviation in N/cm2 is displayed on either top (at −78°C) or bottom (−196°C).
The adhesion strength to wet biological specimen was further investigated using chicken liver and pig muscle as adherends. The adhesion strength when using GO30/BO was 3.4 ± 2.1 (N = 3) and 6.9 ± 3.5 N/cm2 (N = 3) at −78°C with cohesive fracture of 0.58 ± 0.30 (N = 3) and 1.9 ± 3.1 N/cm2 (N = 7) at −196°C for chicken liver and pig muscle, respectively. At −78°C, substrate fracture was observed for one specimen each. Even though the adhesion strength is weaker than that of the metal adherends, the samples tolerated 90° tilting at both dry ice and liquid nitrogen temperatures, showing that GO30/BO exhibits sufficient adhesion strength of biological samples for SEM imaging.
Applicability of the Cryogenic Adhesive for Freeze-Fracture Imaging
We further investigated the applicability of GO30/BO for freeze-fracture cross-sectional imaging. The adhesive fracture between aluminum substrate and GO30/BO at −196°C indicated that the GO30/BO adhesive itself was sufficiently rigid enough to hold the biological sample. As such, we predicted that the biological samples inside a cavity in the substrate would be able to tolerate the lateral stress, enabling the method to be applied for freeze-fracture observation. The lateral force was applied to a piece of chicken liver (4.6–9.4 mm2 × ca. 5 mm) mounted inside a tapped hole of an aluminum stub in liquid nitrogen, and the liver was fractured by applying a force of 2.5 ± 1.5 N/mm2 (N = 5, Supplementary Table S4) to the protruding part of the sample. When the protruding part of the sample was fractured, the part of sample inside the tapped hole of the aluminum stub, did not fall off and revealed a fresh freeze-fractured surface, showing the rigidity of frozen GO30/BO and its applicability for freeze-fracture imaging. Similarly, we were able to freeze-fracture a sample of pig muscle was fractured by applying 1.8 ± 0.9 N/mm2 force (N = 5, Supplementary Table S4).
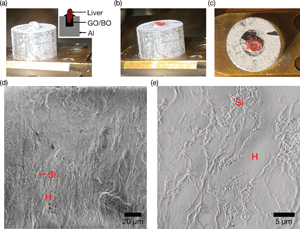
Cryo-SEM imaging of a freeze-fractured cross-section was demonstrated using a chicken liver mounted on an aluminum stub with tapped hole, where the hole was filled by GO30/BO. The surface of chicken liver was covered with frost (Fig. 4a), and the fractured surface using a pre-cooled knife within the preparation chamber was red colored, indicating exposure of a fresh cross-section (Figs. 4b, 4c). The GO30/BO adhesive was also fractured using the knife, the adhesive was harder than the liver. Sample Cryo-SEM images were acquired at the beam current of 13 pA to minimize charge-up artifacts. Irregular-shaped flat liver plate composed of polygonal hepatocytes and surrounding porous sinusoid were clearly observed (Figs. 4d, 4e; Nopanitaya & Grisham, Reference Nopanitaya and Grisham1975; Iida, Reference Iida1984). These results support the applicability of GO30/BO paste for freeze-fracture observation of biological tissues.

Fig. 4. Freeze-fracture of a piece of chicken liver. (a) A photo of a pre-frozen chicken liver embedded in an aluminum stub using GO30/BO. The inset shows the schematic illustration of the stub. (b) A photo of (a) after freeze-fracture in the preparation chamber. (c) Top view of (b), showing that the red-colored cross-section of the chicken liver is exposed. (d) Low-magnification cryo-SEM image of the freeze-fractured and etched chicken liver. (e) High-magnification image of (d). H, hepatocyte cells; Si, sinusoid.
Stability of SEM Images Against Charge-up Artifacts Under High Beam Voltage and Current
To test the applicability of GO30/BO as a conductive adhesive for SEM/EDS, dried powders of diatomite (compacted diatom fossils) was imaged on pure BO and GO30/BO mixture at cryogenic condition without any coating to unambiguously observe the effect of GO in suppressing drifts and charging-up (Supplementary Fig. S6). Cryo-SEM imaging of diatoms on BO at low magnification under 2 or 20 kV of acceleration voltage encountered dramatic changes in background contrast and image drifts, with drift correction being required to acquire a frame integration image (Supplementary Fig. S6a at 2 kV, Supplementary Movie S1 at 20 kV). At high magnification, image drift was significant, and charge-up contrast of the underlying adhesive in the punctae of diatoms was obvious (Supplementary Fig. S6b). On the other hand, we observed diatomite on GO30/BO without significant image drifts or changes in background contrast when observing under the same condition as BO (Supplementary Fig. S7c at 2 kV, Supplementary Movie S2 at 20 kV), and we were able to acquire high-magnification images without artificial bright contrast in the punctae of diatoms (Supplementary Fig. S6d). On GO30/BO, EDS point analysis could be performed (Supplementary Fig. S6e). Carbon was not detected, and the elemental ratio of Si and O was ~1:2, indicating that the silicate diatomite was measured without stage drift.
Applicability of the Cryogenic Adhesive for Cryo-FIB-SEM Imaging of Pre-Frozen Marine Animal Sample
To show the applicability of GO30/BO as a cryogenic adhesive for pre-frozen animal samples, the shell microstructure of a pre-frozen deep-sea snail M. shinkai (Okutani et al., Reference Okutani, Tsuchida and Fujikura1992) was investigated. Margarites shinkai has a yellowish white shell overlaid with a greenish periostracum, but specimens with corroded surfaces exhibit a brilliant prismatic purplish-to-greenish luster (Fig. 5a). The basis for this luster was unknown, though the prismatic nature is suggestive of structural color, and here we tested this hypothesis with SEM and cryo-SEM observation. Observing the shell microstructure using a fractured piece of ethanol-preserved shell revealed a tri-layered shell with an innermost columnar nacre layer (110 μm in thickness) followed by a regular spherulitic prismatic layer (22 μm in thickness), and finally an outermost thin homogeneous layer (14 μm in thickness, Fig. 5b, Supplementary Fig. S7). The shell is further overlaid by a thin layer of periostracum, the thickness being 1.0 μm when observed using air-dried ethanol specimen.
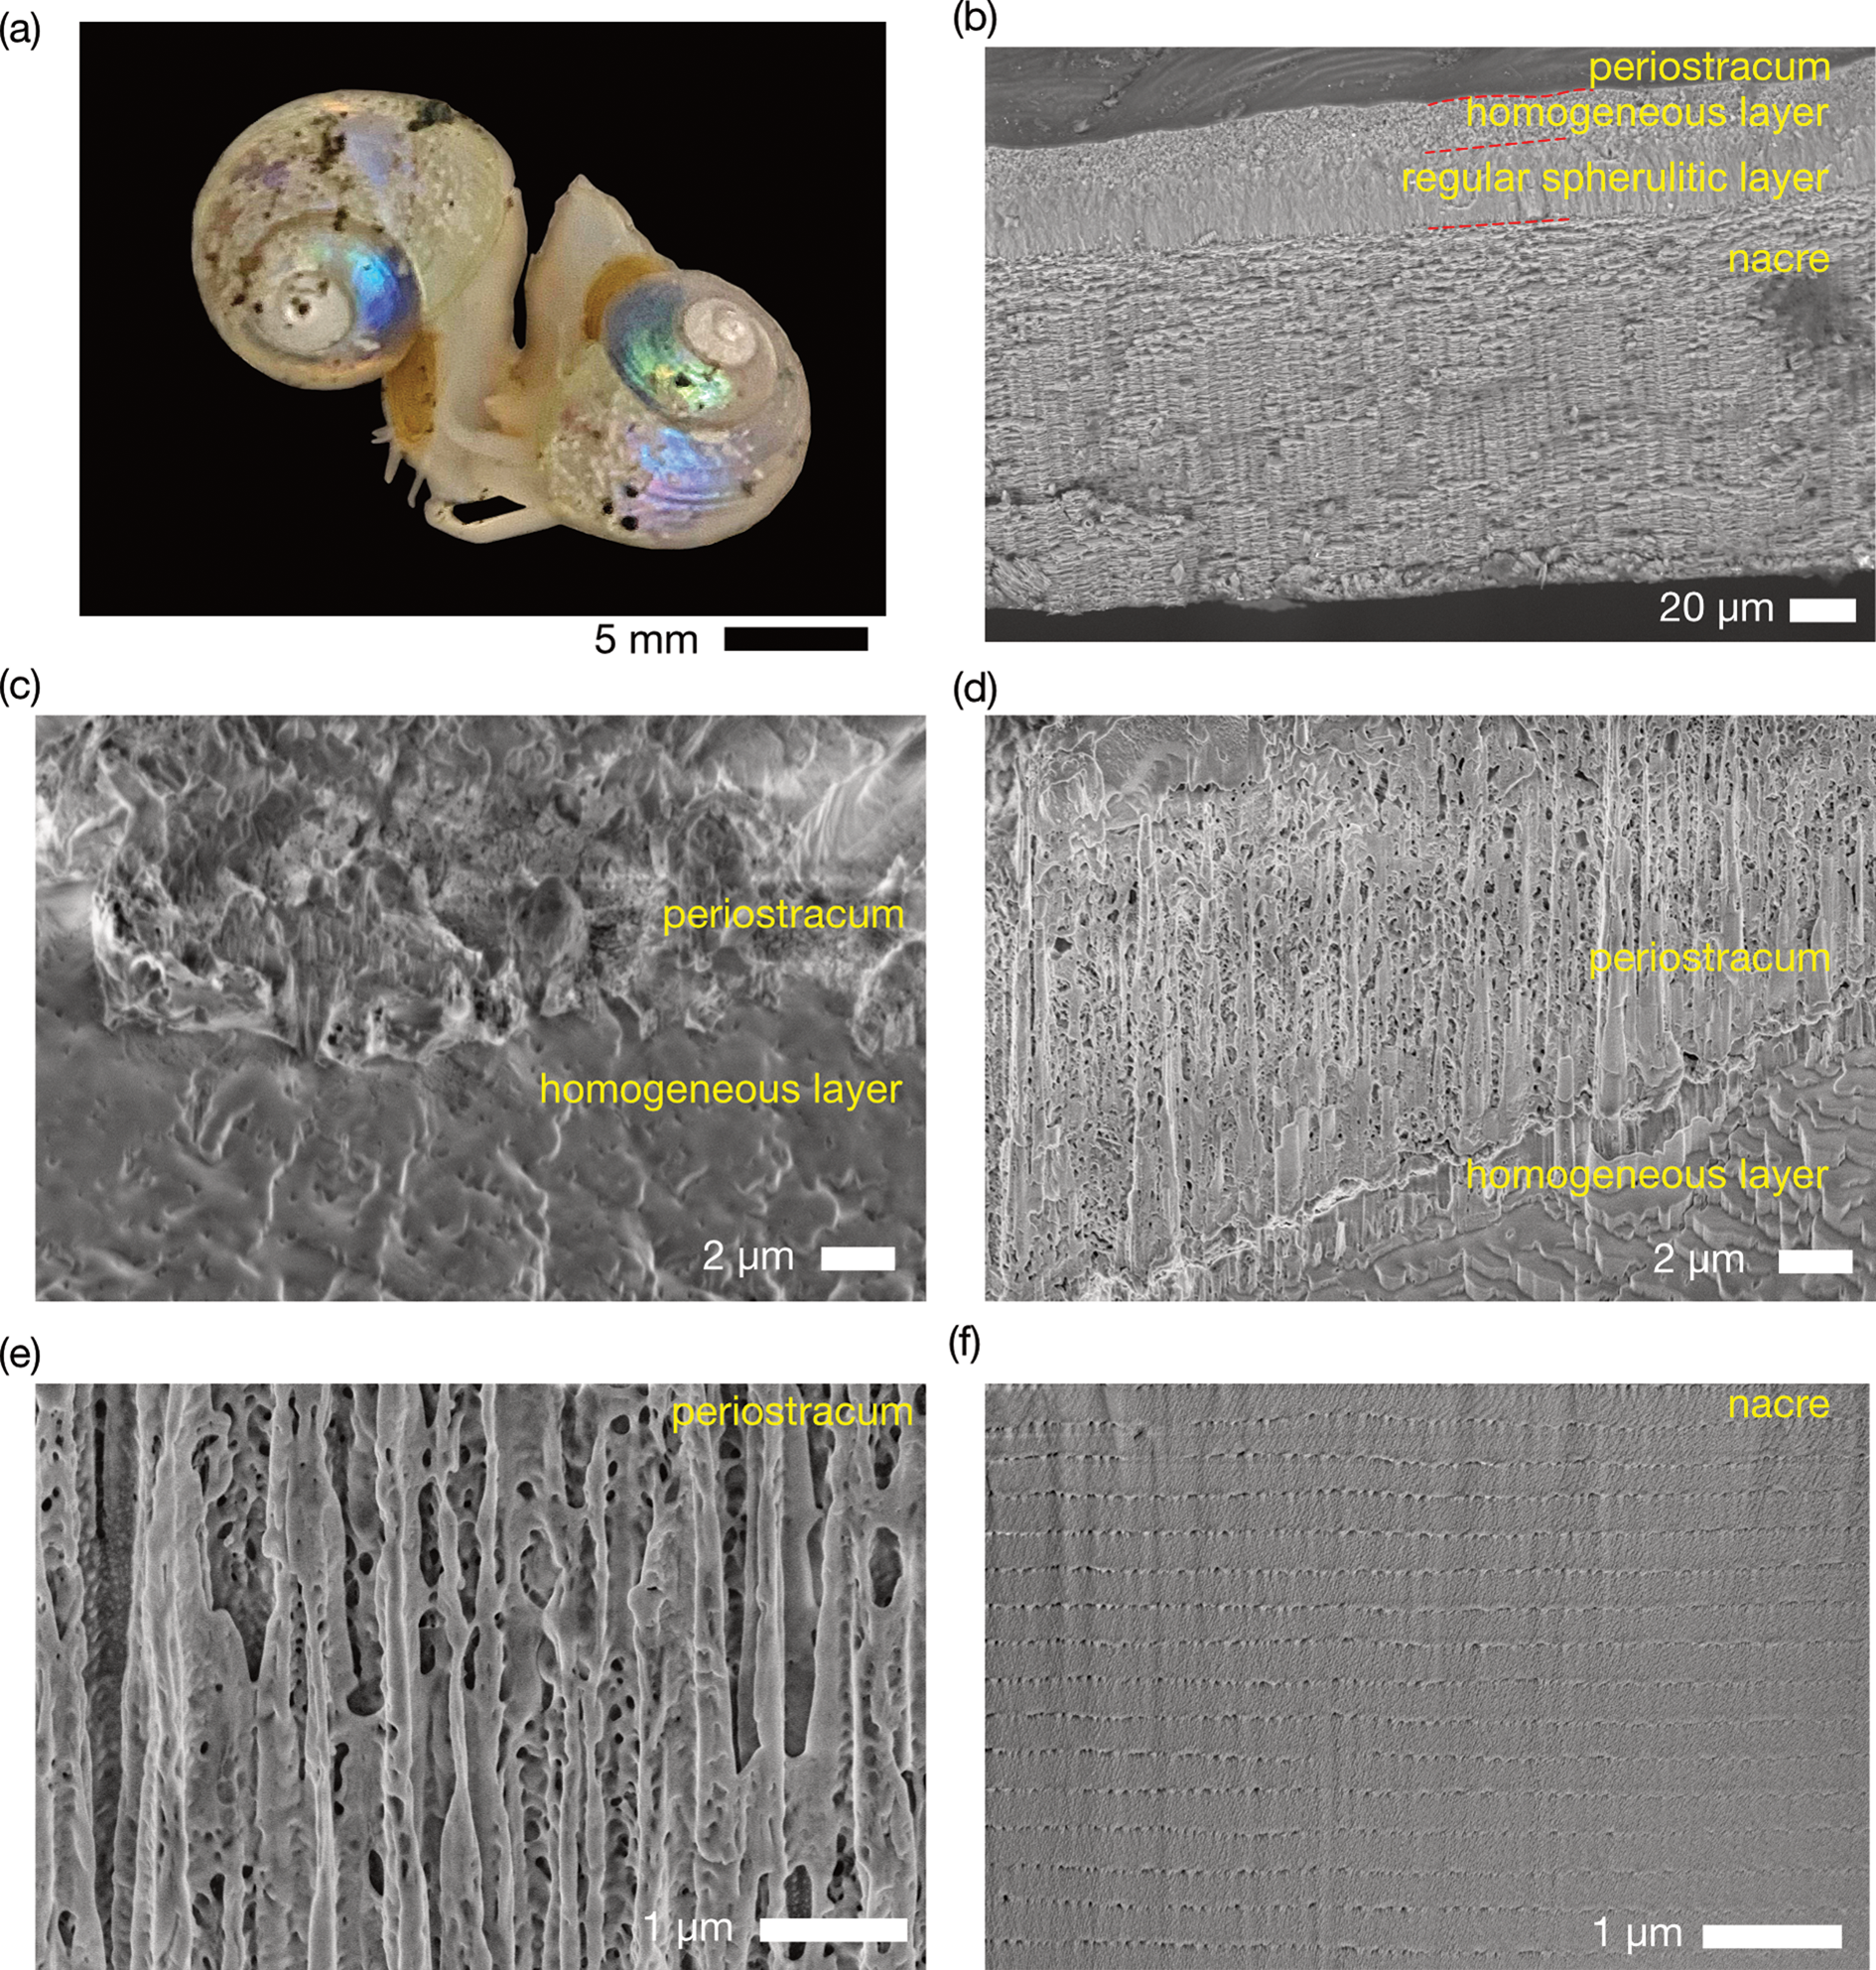
Fig. 5. Cryo-SEM imaging of the prismatic snail Margarites shinkai. (a) A photo of alive snails in seawater before freezing. (b) Mechanically fractured cross-section of an ethanol-dried M. shinkai shell. (c) Cross section of a freeze-dried M. shinkai shell exposed by FIB milling. (d) Cross section of a frozen M. shinkai shell exposed by FIB milling. (e) Magnification of the periostracum layer showing the porous structure. (f) Cross section of a frozen and fractured M. shinkai shell observed from interior side, exposed by FIB milling.
A specimen of M. shinkai frozen in the near-natural state using slush nitrogen was freeze-dried, the shell exposed by FIB milling and imaged (Fig. 5c). The surface was mostly smooth, and the cross section of the shell exposed by FIB milling showed a dense periostracum layer whose typical thickness being 5 μm, much thicker than ethanol-air dried. Furthermore, to observe the shell surface morphology and microstructure in the most natural state under cryo-SEM conditions, another slush nitrogen preserved snail was mounted on a dry ice-cooled aluminum stub with a concave upper surface filled with BO/GO30, and the surface and cross section of the periostracum and the shell were observed in SEM. In contrast to the dried snail, the surface of the frozen snail was rough, and ~10 μm-sized granules presumably frozen water was covering up the surface (Fig. 5d). The cross-section of the frozen snail revealed the periostracum with a typical thickness of 15 μm and clearly porous in structure, and the pore diameter was 38 ± 37 nm, ranging from 15 to 100 nm (N = 87, Fig. 5e). This is clearly distinct from the two types of dry specimens, which have lost the porous structure and have shrunk. Using FIB to mill from the interior of the shell revealed highly regular multilayered calcium carbonate layer corresponding to the columnar nacre layer, the minimal layer thickness was 215–295 nm (257 ± 22 nm, N = 14, Fig. 5f). Granule-like domains (31 ± 20 nm, N = 125) were found between layers of calcium carbonate crystals, likely corresponding to proteins.
X-ray diffraction of the shell showed that the shell was composed of aragonite, agreeing with the known composition of columnar nacre and regular spherulitic prismatic layers (Warèn & Bouchet, Reference Warèn and Bouchet1993; Hedegaard, Reference Hedegaard1997). The orientation of aragonite plates, primarily reflecting the thickest columnar nacre layer, was analyzed from relative peak intensity (Supplementary Fig. S8; Villiers, Reference Villiers1971). As the shell surface was placed parallel to the incident X-ray, peaks with high intensity indicate the crystal plane in the stacking direction. Strong diffraction was observed at 31.1° {002}, 64.9° {004}, 66.0° {014}, 69.1° {114}, and 69.5° {024} while diffraction peaks were small at 26.3° {111}, 27.3° {021}, 38.4° {130}, 46.0° {221}, and 48.3° {041}, indicating that the c-axis is perpendicular to the shell surface.
Discussion
Our results showed that GO30/BO is an effective adhesive that meets the ten key criteria. The use of GO with a low oxidation level was the key to success, due to the well-balanced hydrophilicity for the formation of stable dispersion and retaining the sp 2 carbon network for electric conductivity. The multilayered structure observed in SEM and TEM likely implies that the surface of the stacked GO was more favorably oxidized, while the internal layer remained graphitic. The increase in GO/BO viscosity at 30 wt% of GO is indicative of an inter-particle network of GO, and the decrease in conductivity upon freezing suggests that the inter-particle network is rather dynamic. The amount of GO was important to retain the adhesive's conductivity at cryo-SEM temperature, and we have demonstrated using diatomite that cryo-EDS spectrum can be acquired by using GO30/BO without any conductive coating.
Considering the biological application, sample contamination by conductive GO additive is expected to be lower than the case of resin block with Ketjen Black (Nguyen et al., Reference Nguyen, Thai, Saitoh, Wu, Saitoh, Shimo, Fujitani, Otobe and Ohno2016). Conductive resin using Ketjen Black suffered from particle internalization into cells presumably because of the small size of particles and the necessity to heat the sample for the resin to be polymerized. In our case of GO/BO, micrometer-sized GO particles are large enough to prevent any particle–cell interaction (Mu et al., Reference Mu, Su, Li, Gilbertson, Yu, Zhang, Sun and Yan2012) and operation under cryogenic temperature suppresses GO diffusion into the cells.
Although the adhesion strength of GO30/BO against the flat aluminum surface was weak, freeze-fracture was possible when the adhesive was placed in a tapped hole in the aluminum stub and frozen with the biological sample mounted inside the hole. Once GO30/BP is frozen at liquid nitrogen temperature, the lateral shear stress against the biological sample held for freeze-fracture was dispersed over the entire cavity wall, preventing sample detachment. Using this technique, our new adhesive can be a powerful tool to prepare freeze-fractured sample surfaces for cryo-SEM. Imaging at low beam current and at ca. 2 kV of beam voltage was found to be suitable for cryo-SEM imaging with minimum the charging artifacts.
Cryo-FIB-SEM investigation of the shell of Margarites shinkai revealed a columnar nacre layer with periodically multilayered aragonite sheets. The structural color is calculated from the product of the thickness of the periodic structure and its refractive index. The refractive index of aragonite is 1.530 (parallel to the c-axis)–1.686 (parallel to the b-axis) depending on the crystal plane (Bragg, Reference Bragg1924a), and the aragonite's orientation is estimated by the relative peak intensities of the XRD pattern. High intensities were observed from planes along with the c-axis such as {002} indicating that the c-axis is mostly perpendicular to the shell's surface. This observation is in accordance with the crystal habit of native aragonite, which forms twin crystals about {110} planes to form pseudohexagonal pillars along the c-axis, whose end is terminated by {011} planes (Bragg, Reference Bragg1924b). The structural color exhibited by the aragonite layers thus corresponds to 329–451 nm (393 ± 34 nm) and matches the purple to green color of the shell observed by naked eye (Fig. 3a). Hence, only when the shell is corroded to reveal the underlying columnar nacre color the prismatic luster is observed. The absence of structural color in other parts of the shell indicates that the overlaying shell layers and/or the periostracum layer conceal the nacre layer.
The periostracal layer of M. shinkai clearly lost its fine structure (i.e., porous nature) when dried, either through freeze-drying or air-drying, compared with when cryo-SEM was used for the pre-frozen specimen in combination with our newly developed GO30/BO paste. Furthermore, the thickness of the periostracum was greatly reduced from 15 μm in the near-native cryo-SEM state to 5 μm in freeze-dried to only 1.5 μm in the air-dried state. This clearly shows that cryo-SEM is superior in observing the structures of pre-frozen biological specimens, and that the GO30/BO adhesive can be an important tool for researchers who wish to carry out such observations in near-ideal conditions.
The limitation of our GO30/BO paste as an adhesive for cryo-SEM is its hardness and volumetric change upon freezing. As the adhesive is highly viscous, the sample needs to be forcibly immersed into the adhesive, and therefore, very soft or fluffy samples are difficult to mount without destroying its natural structure. The freezing sound heard during freezing at liquid nitrogen temperature indicates a decrease in the volume of the adhesive upon freezing, the cause of the decrease in adhesion force. Nevertheless, our GO30/BO adhesive is a novel conductive adhesive superior to other available options for cryo-SEM observation of pre-frozen samples, including biological materials.
Conclusion
We developed a conductive adhesive made of 1,3-butanediol and graphite oxide, suitable for mounting pre-frozen specimens at the dry-ice temperature for cryo-SEM imaging. The viscous nature of the adhesive at dry-ice temperature enables tilting of the sample stage up to 90°, enabling site-specific microanalysis of small frozen samples. Our new adhesive opens up the possibility of re-analyzing frozen samples without damaging their micro- and nano-level structures as well as components entrapped in ice. This is not only useful for food science and field-preserved biological samples but also, potentially applicable to wider fields such as archaeological and biological samples preserved under permafrost.
Supplementary material
To view supplementary material for this article, please visit https://doi.org/10.1017/S1431927622012296.
Acknowledgments
The authors thank the Captain and crew of R/V Yokosuka and the DSV Shinkai 6500 team for their great support of the scientific activity at sea. Takazo Shibuya (JAMSTEC) is acknowledged for offering machine time of the Raman spectrometer. This study was supported by a Japan Society for the Promotion of Science Grant-in-Aid for Young Scientists [Grant Number JP19K15379] to S.O. We thank the anonymous reviewer for providing useful comments that improved an earlier version of this paper.
Author contributions statement
S.O. designed the adhesive paste composition and performed the experiments. S.O. and C.C. collected deep-sea samples and designed their observation experiments. Both authors contributed to the drafting of this manuscript and approved its submission and publication.
Conflict of interest
The authors declare no competing financial interest.


 Open access