


Introduction
Intracellular organelles undergo continuous fission and fusion in response to various physiological activities, such as cell division, transportation, and oxidative stress (Kucharz et al., Reference Kucharz, Wieloch and Toresson2013; Kerr & Teasdale, Reference Kerr and Teasdale2014). Lysosomes are vital organelles that work not only as cellular waste disposal systems, but also as dynamic hubs for integrating various signaling pathways, such as autophagy and endocytosis (Ferguson, Reference Ferguson2019; Lawrence & Zoncu, Reference Lawrence and Zoncu2019; de Araujo et al., Reference de Araujo, Liebscher, Hess and Huber2020). In addition, lysosomes are crucial Zn2+ sinks, and blocking lysosomal exocytosis facilitates Zn2+-induced apoptosis (Kukic et al., Reference Kukic, Kelleher and Kiselyov2014). Therefore, regulating both lysosome homeostasis and Zn2+ buffering capability may be a therapeutic measure for diseases, such as cancer and neurodegenerative disorders (Bonam et al., Reference Bonam, Wang and Muller2019; Lawrence & Zoncu, Reference Lawrence and Zoncu2019).
Under nutrient starvation, the diameter of lysosomes increases from 0.1–0.5 to 0.5–1.5 μm as a result of enhanced membrane fusion; conversely, tubulation is one of the fission mechanisms that recycle the lysosomal membrane for other pathways (Stagi et al., Reference Stagi, Klein, Gould, Bewersdorf and Strittmatter2014; Xu & Ren, Reference Xu and Ren2015; Saffi & Botelho, Reference Saffi and Botelho2019). Epifluorescence microscopy is a general technique for studying spatial and temporal changes in fluorescence signals at the subcellular level in a cell biology laboratory (Stephens & Allan, Reference Stephens and Allan2003; Sanderson et al., Reference Sanderson, Smith, Parker and Bootman2014). Although several techniques, such as confocal and super-resolution microscopy, can provide higher resolution, these setups are prohibitively expensive for use in ordinary laboratories (Nelson & Hess, Reference Nelson and Hess2014; Igarashi et al., Reference Igarashi, Nozumi, Wu, Cella Zanacchi, Katona, Barna, Xu, Zhang, Xue and Boyden2018). Therefore, a simple modification of an epifluorescence microscope that can enhance the resolution in tracking fluorescent puncta will be of great help in studying subcellular structures.
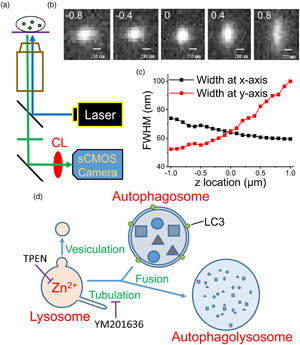
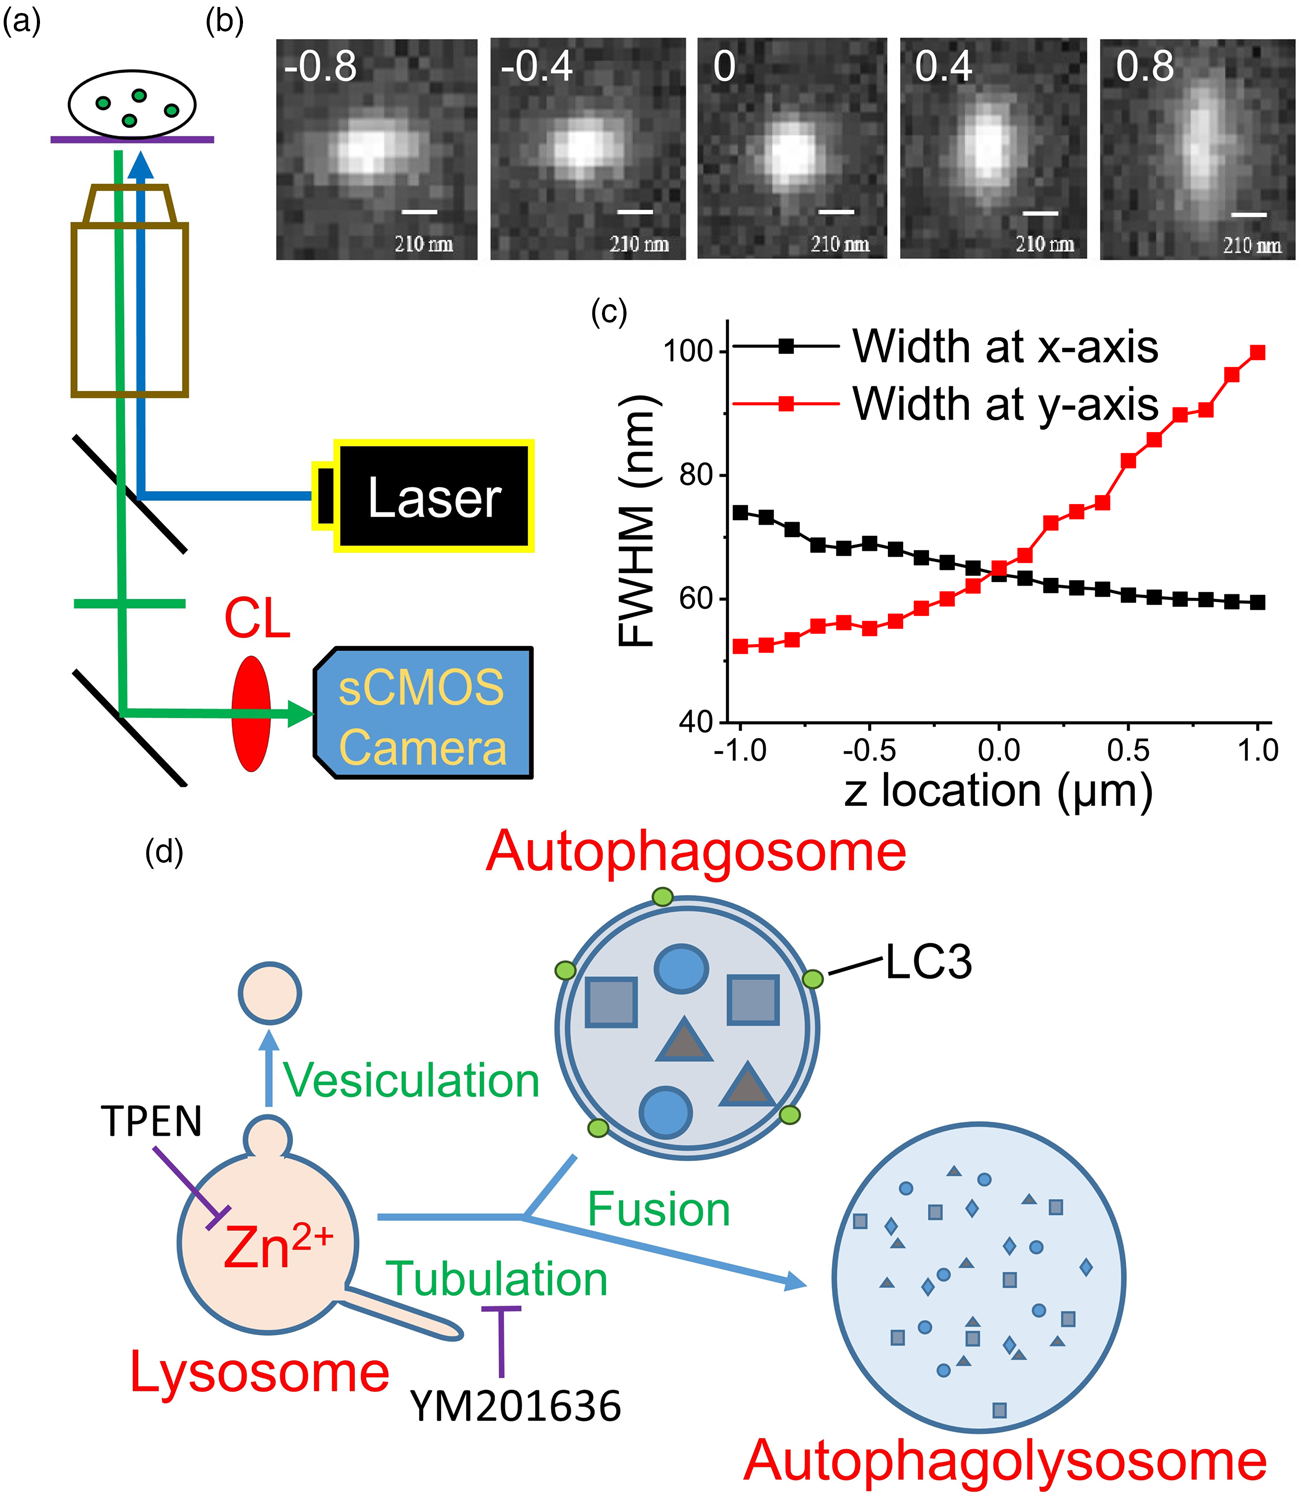
To verify the significance of Zn2+ in maintaining lysosome homeostasis, we adopted a modified epifluorescence microscopic technique suggested by Tsou et al. (Reference Tsou, Hsia, Chu, Hung, Chen, Chien, Chou, Chen and Mou2015), which involves inserting a cylindrical lens (CL) in front of the camera in an epifluorescence microscopic system (Fig. 1a). More details can be found in the Supplementary Material and a recent publication (Chang et al., Reference Chang, Pratiwi, Chen, Chen, Wu and Mou2020). In that design, the authors successfully tracked the constant spatial movement and morphological changes of a single fluorescent nanoparticle inside a cell. In this study, we stained primary cultured rat embryonic cortical neurons using FluoZin3, a Zn2+-sensitive dye, and Lysotracker, a lysosome-targeting fluorescence marker, to observe the morphological changes of Zn2+-enriched vesicles and lysosomes, respectively. Our findings demonstrate the convenience of this modified epifluorescence microscopic approach for observing lysosome homeostasis, which is crucial for maintaining normal physiological activities.

Fig. 1. Use of a modified epifluorescence microscopic technique to monitor the fluorescence puncta inside a cell. (a) The apparatus used in the present work. CL: cylindrical lens. (b) Images of a fluorophore at various z positions. The digits in each image indicate the z position (in μm) relative to the focal plane of z = 0, where the FWHMs along the x- and y-directions are equal as represented in (c). Scale bar: 210 nm. (d) Fusion between autophagosome and lysosome. Vesiculation and tubulation are two common fission processes involved in recycling lysosomes. TPEN is a membrane-permeable Zn2+ chelator and YM201636 blocks of tubulation. LC3 is a marker protein of autophagosomes.
Results and Discussion
To verify the capability of this system in detecting intracellular organelles with submicrometer diameters, we placed fluorescent mesoporous silica nanoparticles with diameters up to 0.2 μm in a recording chamber at the microscope stage and obtained images at different z positions (Fig. 1b). We first identified a clear image with the naked eye and then moved the focal plane upward or downward with a step size of 0.1 μm (the intrinsic minimal setting of the microscope, DM-IRE2, Leica) to capture the images. Installing a CL in front of a camera projects the images disproportionately along the x and y directions at different z-sections, where the difference in the x and y projections increases as the focal plane moves away from the center of the object. By plotting the full widths at half maximum (FWHMs) of the images along the x and y directions against the z position (Fig. 1c), we set z = 0 at the position where the FWHMs along the x and y directions are equal. Using this algorithm to define the center position (z = 0) of a punctum, artificial deviation can be avoided.
We then monitored the development of autophagosomes in cultured PC12 cells transfected with GFP-LC3, an early autophagosome marker, after H2O2 treatment (Supplementary Fig. S1; Hung et al., Reference Hung, Huang and Pan2013; Zhong et al., Reference Zhong, Yao, Luo, Li, Dong, Zhang and Jiang2020). Autophagosomes fuse with lysosomes at the late stage to form autophagolysosomes that degrade damaged organelles or biomolecules (Fig. 1d). Supplementary Fig. S1a shows a GFP-LC3 punctum at different measuring times after the appearance of the punctum; the images were taken at a z-section with the closest lengths in the x and y directions. The diameter of this punctum increased gradually from 0.84 to 1.26 μm in 120 min; the average fluorescence intensity increased simultaneously, and the total traveling distance was 4.99 μm (Supplementary Fig. S1d). The dynamic behavior of a fluorescent object in a cell can be visualized by modified epifluorescence images, an accurate real-time approach.
Several cytosolic objects became visible after the neurons were stained with FluoZin3, and most of the stained puncta show spherical morphology visualized by a confocal microscope (Supplementary Fig. S2). To avoid interference from the distorted shape in the algorithm, we chose spherical puncta for recording. No significant changes were observed in the size and fluorescence intensity of these puncta for 60 min by the modified epifluorescence microscope (Fig. 2a). After the application of N,N,N′,N′-tetrakis(2-pyridylmethyl)ethylenediamine (TPEN), a membrane-permeable Zn2+ chelator, the size and fluorescence intensity of a Zn2+-containing punctum decreased, as evidenced by the representative images captured at 0, 10, 25, and 40 min (Fig. 2b). The traveling distances for these two moving puncta were 1.94 and 1.96 μm during the first 40 min of recording (Supplementary Fig. S3). No significant differences were observed in the control group (without TPEN treatment) after 60 min (0.69 ± 0.12 versus 0.67 ± 0.12 μm, n = 13); however, TPEN treatment significantly decreased the diameters from 0.71 ± 0.11 to 0.52 ± 0.11 μm (n = 13) in 40 min (equivalent to a shrinkage rate of 0.28 μm/h, Supplementary Table S1). Although no difference was observed in the control group after 60 min, the fluorescence intensity decreased by 24% in the TPEN-treated group in 40 min. No significant differences were observed in the average traveling distances of the puncta between the control and TPEN-treated groups (2.27 ± 0.44 and 2.29 ± 0.55 μm, respectively, in 40 min).

Fig. 2. Zn2+ depletion causes shrinkage of puncta stained with FluoZin3 and Lysotracker. Primary cultured rat embryonic cortical neurons were stained with (a–d) FluoZin3 or (e–g) Lysotracker for morphology measurements. (a,b) The center images of fluorescent puncta were taken at different measuring times, where the puncta were treated (b) with or (a) without TPEN. (c,d) Normalized average diameter and fluorescence intensity of Zn2+-containing vesicles. (e) Center images of a Lysotracker-stained punctum were taken at different measuring times, where TPENwas added at 62nd min. (f,g) Normalized average diameter and fluorescence intensity of Lysotracker-stained puncta (n = 11). TPEN was added as indicated. The dash-lined circle in each image indicates the boundary of the punctum. Data are presented as mean ± SEM; *, **, and *** indicate the p-values (Student's t-test) less than 0.05, 0.01, and 0.001, respectively, when compared with the value at the start of recording (f,g) or as indicated (c,d). Scale bars in each panel = 1 μm.
We then applied the same method to examine the effect of TPEN on the puncta stained with Lysotracker (Figs. 2e–2g). The representative images illustrate that both the size and fluorescence intensity of this Lysotracker-stained punctum did not change substantially before TPEN application, but decreased immediately after the addition of TPEN. The average results revealed that the diameter was 0.69 ± 0.11 μm (n = 11) at the start of recording and was maintained during the 60-min recording (0.70 ± 0.11 μm). However, after TPEN was added, the size decreased to 0.50 ± 0.10 μm in 40 min (equivalent to a shrinkage rate of 0.29 μm/h, Supplementary Table S1). Similarly, TPEN application decreased the average fluorescence intensity by up to 28% in 40 min. The traveling distances were not significantly different before and after the TPEN treatment (1.94 ± 0.36 versus 2.44 ± 0.56 μm, n = 11) in 40 min. These results indicate the importance of Zn2+ in maintaining the homeostasis of the puncta stained with either FluoZin3 or Lysotracker.
To further confirm the size changes in puncta observed using the modified epifluorescence microscopy, we applied a commercial confocal microscope to monitor the fluorescent puncta in the cytosol (Supplementary Fig. S4). Before the addition of TPEN, these puncta exhibited no significant changes in the diameter and fluorescence intensity; after TPEN treatment, the diameter decreased significantly from 0.95 ± 0.17 to 0.74 ± 0.15 μm (n = 12) and from 1.00 ± 0.16 to 0.78 ± 0.15 μm (n = 12) for the puncta stained with FluoZin3 and Lysotracker, respectively. This was equivalent to shrinkage rates of 0.30 and 0.33 μm/h for FluoZin3 and Lysotracker, respectively (Supplementary Table S2). The normalized fluorescence intensity decreased concurrently by 25 ± 10 and 29 ± 6% for the puncta stained with FluoZin3 and Lysotracker, respectively. The normalized decrements in both diameter and fluorescence intensity are comparable to those in Figure 2 using the modified epifluorescence microscopy (Supplementary Tables S1 and S2).
Lysosomes undergo fusion and fission to change their sizes for various functions; tubulation is a fission process involved in recycling the lysosomal membrane and related proteins to replenish the functional lysosome pool (Fig. 1d; Choy et al., Reference Choy, Saffi, Gray, Wallace, Dayam, Ou, Lenk, Puertollano, Watkins and Botelho2018; Saffi & Botelho, Reference Saffi and Botelho2019). YM201636 is an inhibitor of PIKfyve, a phosphoinositide kinase, and can suppress the tubulation type of fission in lysosomes (Li et al., Reference Li, Rydzewski, Hider, Zhang, Yang, Wang, Gao, Cheng and Xu2016; Choy et al., Reference Choy, Saffi, Gray, Wallace, Dayam, Ou, Lenk, Puertollano, Watkins and Botelho2018). Supplementary Figure S5 shows that YM201636 (1.4 μM) caused little change in the diameter and fluorescence intensity of puncta stained with Lysotracker when measured using the modified epifluorescence microscopy. We subsequently pretreated the neurons with YM201636 (1.4 μM) for 1 h and applied TPEN after obtaining the first set of images at time zero using the modified epifluorescence microscopy. The representative images of the puncta stained with FluoZin3 or Lysotracker demonstrate similar decreases in both diameter and fluorescence intensity after TPEN application (Fig. 3). The average diameters decreased from 0.58 ± 0.12 to 0.50 ± 0.11 μm (n = 12) and from 0.71 ± 0.16 to 0.61 ± 0.13 μm (n = 12) for the puncta stained with FluoZin3 and Lysotracker, respectively, corresponding to the shrinkage rate of 0.08 and 0.09 μm/min (Supplementary Table S1). The average traveling distances of the FluoZin3- and Lysotracker-stained puncta were 1.71 ± 0.43 and 2.88 ± 0.62 μm, respectively (n = 12 each). Overall, YM201636 suppressed the TPEN-induced shrinkage of the fluorescent puncta stained with Lysotracker and FluoZin3.
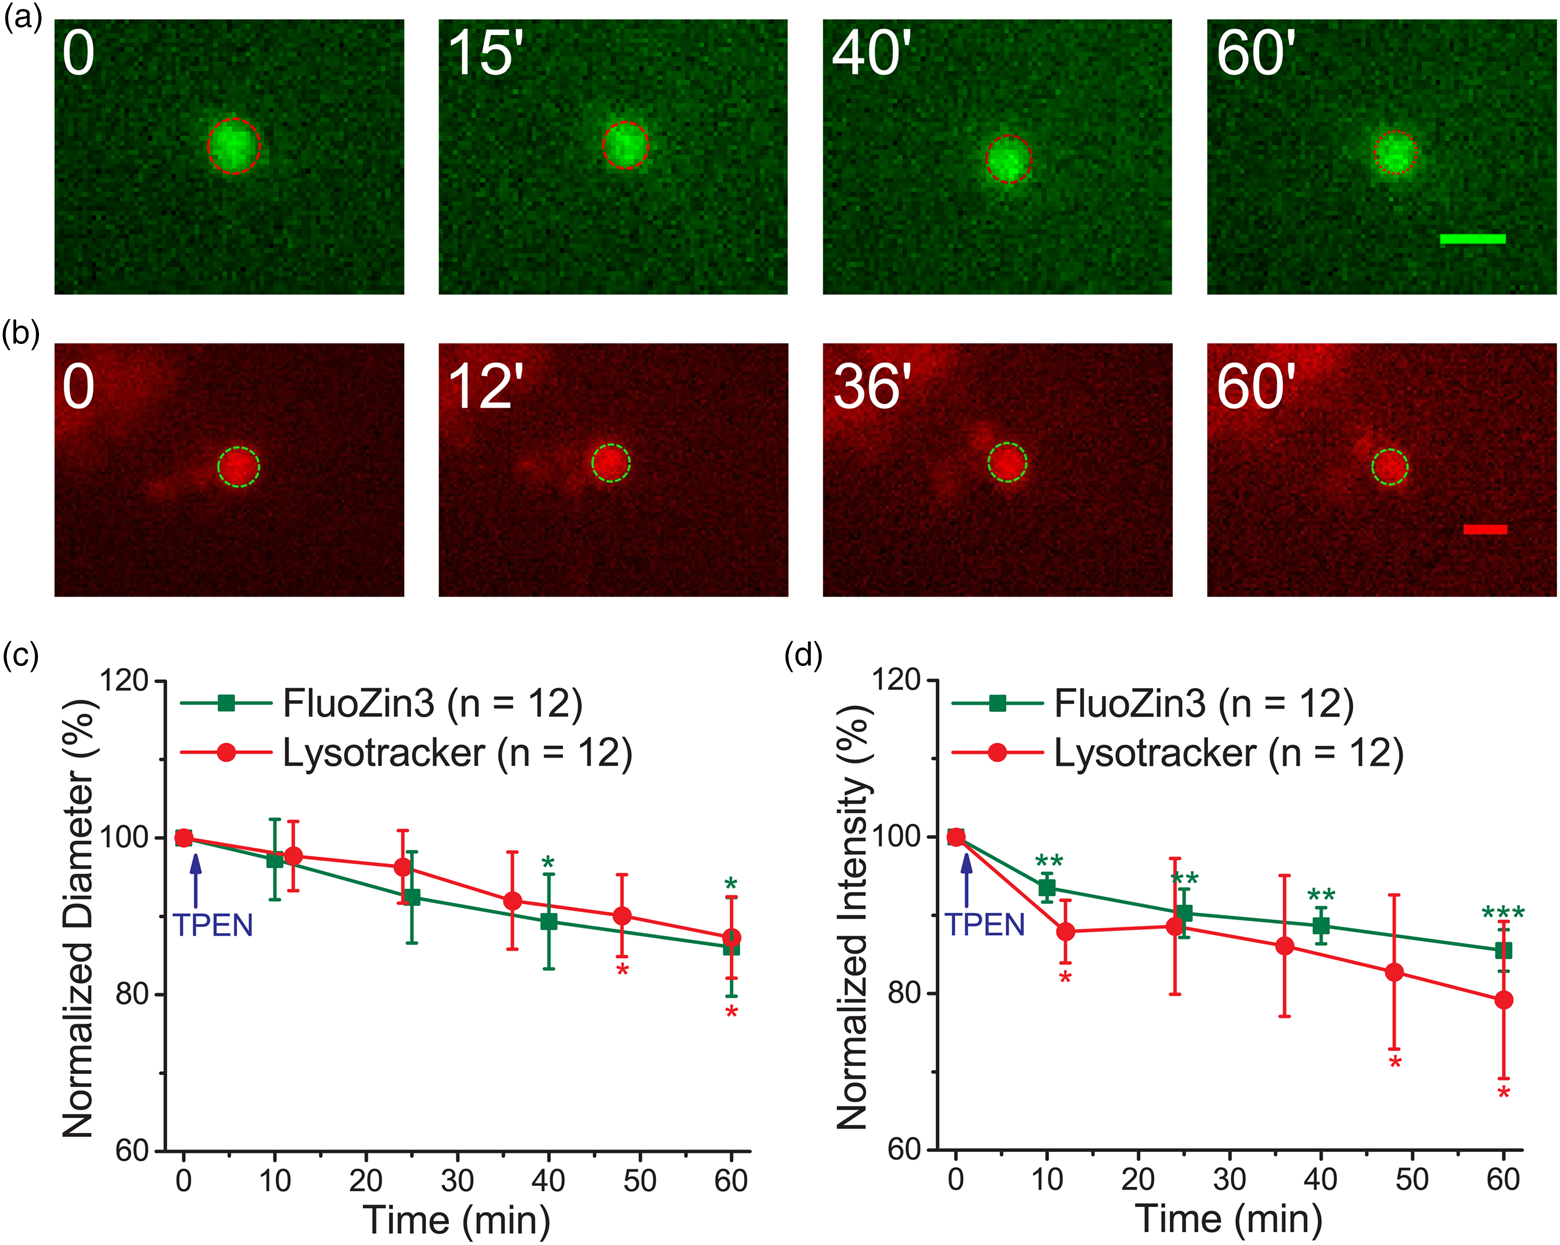
Fig. 3. YM201636 treatment suppresses TPEN-induced punctum shrinkage. Primary cultured cortical neurons were pretreated with YM201636 (1.4 μM) for 1 h. The cells were then stained with FluoZin3 or Lysotracker and placed in the recording chamber at the stage of a modified epifluorescence microscope. (a,b) Representative images of the fluorescent puncta stained with FluoZin3 and Lysotracker. The dash-lined circle in each image indicates the boundary of the punctum. (c,d) Normalized average diameter and fluorescence intensity. Data are presented as mean ± SEM; *, **, and *** indicate the p-values (Student's t-test) less than 0.05, 0.01, and 0.001, respectively, when compared with the value at the start of recording. Scale bars in each panel = 1 μm.
Conclusion
Different intracellular organelles adopt specialized morphologies for various cellular activities; therefore, observing these dynamic changes in morphology can reveal the physiological responses of a cell (Heald & Cohen-Fix, Reference Heald and Cohen-Fix2014). In this report, we adopted a modified epifluorescence microscopic technique to investigate the morphological changes of fluorescent puncta in a live cell under Zn2+ depletion. This method is straightforward and convenient for use in a general biology laboratory to avoid the bias in locating the center of a spherical punctum, especially for organelles with size close to the optical resolution limit. Notably, our results demonstrate the importance of Zn2+ in modulating the fission process to regulate the homeostasis of lysosome morphology. There are several possibilities that we did not observe any significant tubulation/extension from the stained puncta, such as weak fluorescence intensity, transient kinetics, and tiny diameter. In future studies, we plan to label the lysosomes using different marker proteins to further characterize how lysosomes respond to Zn2+ dyshomeostasis and investigate detailed morphological changes such as tubulation and fusion–fission processes (Shen & Mizushima, Reference Shen and Mizushima2014). Because intracellular organelles function as storage places for Zn2+, dyshomeostasis in intracellular Zn2+ concentration is confirmed to cause morphological changes in organelles, which may lead to neurodegeneration and other disorders.
Supplementary material
To view supplementary material for this article, please visit https://doi.org/10.1017/S1431927620024940.
Acknowledgment
This work was supported, in part, by the Ministry of Science and Technology (MOST) of Taiwan under grant nos. 106-2113-M-002-022-MY3 and 107-2113-M-002-011-MY3 (Y.-T.C.); 107-2320-B-002-052 and 109-2311-B-002-011 (C.-Y.P.). We thank Dr. Peilin Chen of Academia Sinica for his help in the single particle tracking technique. We acknowledge the biophysical core facility at the Institute of Atomic and Molecular Sciences (IAMS) for the uses of high-resolution confocal microscopy (SP8, Leica).


 Open access