


Introduction
Electron monochromators in the scanning transmission electron microscope (STEM) have improved the energy resolution for electron energy loss spectroscopy (EELS) from 300 meV in standard cold field emission guns down to 3 meV [Reference Dellby1]. This unprecedented degree of energy resolution allows direct access to a variety of physical phenomena including phonons [Reference Krivanek2,Reference Lagos3], phonon-polaritons [Reference Govyadinov4–Reference Li6], infrared plasmons [Reference Cho7–Reference Cho9], and molecular vibrations [Reference Rez10–Reference Collins13]. This leads to new experimental capabilities for STEM, such as isotope-resolved electron microscopy. The electron beam itself is insensitive to the chargeless neutrons that define isotopes, and as a result isotopes could only be studied in a STEM using low-efficiency experiments, such as systematic measurements of knock-on damage or Compton scattering [Reference Susi14,Reference Argentero15]. However, vibrational energies are dependent on the atomic mass of the elements, not just the atomic number. As a result, the energy-loss of the vibrational modes can be directly related to the element's isotopic character.
Furthermore, one can take advantage of different types of scattering mechanisms to access different parts of the vibrational response, as shown in Figure 1. One can collect electrons that are scattered out to high angles to primarily access highly localized impact scattering losses (Figure 2a), which enable phonons to be measured with atomic resolution [Reference Hage16,Reference Venkatraman17] and even the direct measurement of single-atom vibrational modes [Reference Hage18]. Alternatively, the beam can also interact with the dipole moments in the sample and excite optical phonons, leading to delocalized dipole scattering (Figure 2b), enabling efficient excitation even when the electron beam passes tens of nanometers away from the sample in an “aloof” scattering geometry [Reference Rez10,Reference Hachtel12,Reference Dwyer19,Reference Crozier20]. The strength of the aloof interaction is inversely proportional to the excitation energy [Reference Egerton21], so at small impact parameters, (tens of nm) IR vibrational modes that carry the isotopic information can be excited without subjecting the sample to damaging UV+ radiation. Thus, one can use the aloof mode for long acquisitions that would normally destroy a beam-sensitive material to perform damage-free nanoscale spectroscopy.
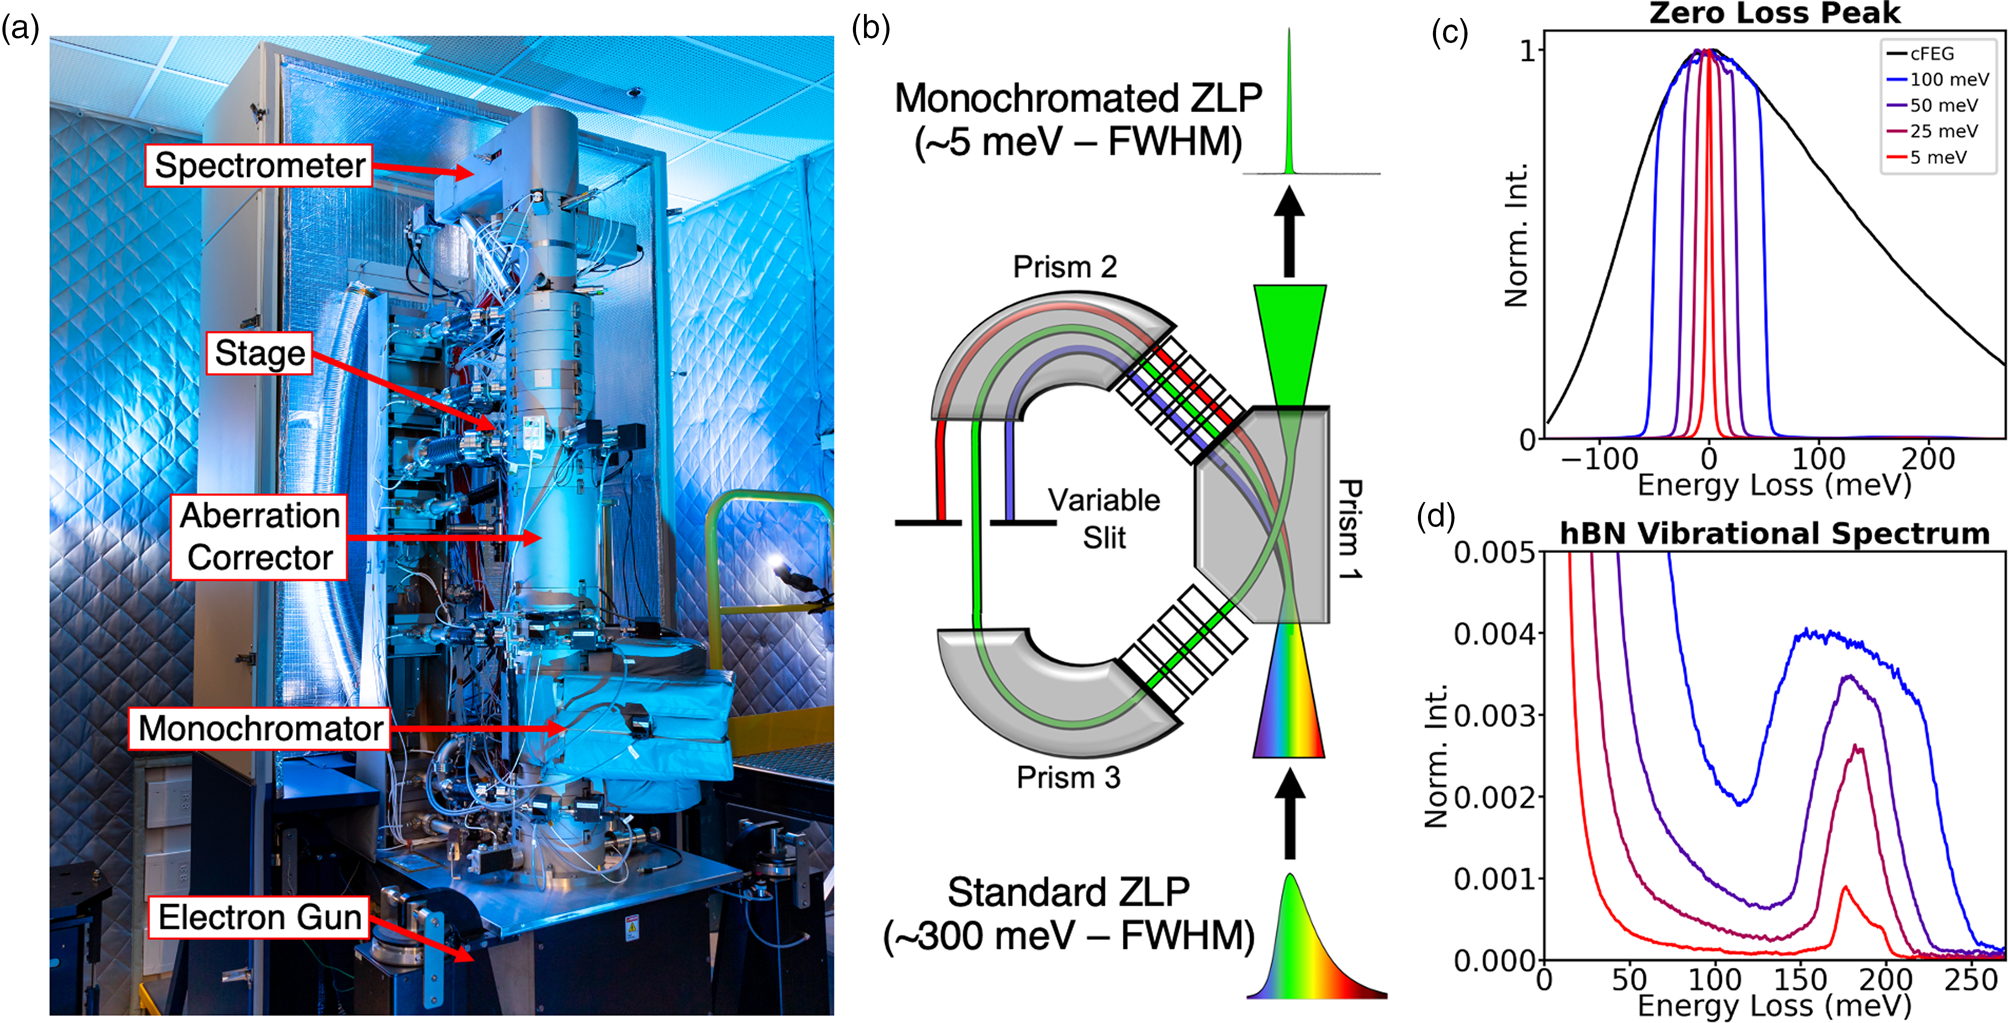
Figure 1: Monochromated EELS. (a) Photograph of the MAC-STEM at ORNL. (b) Schematic for electron monochromation. (c–d) The effect of monochromation on ultra-low energy excitations. (c) The spread of energies in the electron probe, as defined by the full-width at half-maximum (FWHM) of the zero-loss peak (ZLP) at four different levels of monochromation: 300 meV (unmonochromated), 100 meV, 30 meV, and 5 meV. (d) The vibrational structure of hBN at these four levels of monochromation.

Figure 2: Scattering mechanisms for vibrational spectroscopy. Fast electrons can excite vibrational modes through different means. (a) By scattering off of the nucleus of individual electrons, the beam can undergo highly localized impact scattering for atomic-resolution analysis. (b) By interacting with a polar material through a virtual photon, the beam can undergo delocalized dipole scattering for efficient, damage-free analysis. Moreover, impact scattering is dominant at high scattering angles, while dipole scattering is only dominant close to the optic axis, enabling microscopists to switch between the two effects by changing the position of the EELS collection aperture.
Here, we review recent results of isotopically resolved studies on beam-sensitive materials using the monochromated aberration-corrected STEM (MAC-STEM) at Oak Ridge National Laboratory (ORNL). The frequency of these vibrations was probed in the aloof mode with sub-meV precision and was able to identify molecular and isotopic species with nanometer resolution without damaging the sample. The technique opens the door for real-space tracking of isotopically labeled compounds, with vast implications for following nanoscale chemical reactions and metabolic pathways in soft matter and even living organisms.
Beam-Sensitive Materials for Vibrational Spectroscopy
Water, or liquid H2O, is arguably the most important chemical compound on earth and is the main component of all living organisms. Deuterated (heavy) water, D2O, is a widely applied isotopic tracer that has been extensively used in macroscopic vibrational spectroscopy to identify the resultants of chemical reactions and to track functional groups [Reference Atzrodt22]. Water, both H2O and D2O, have been extensively studied by various vibrational spectroscopy techniques [Reference Wang23,Reference Bakker and Skinner24], making it an excellent reference case for budding vibrational EELS.
In order to examine liquid water in the microscope it must be protected both from the vacuum, which can evaporate the liquid, and the electron beam, which can induce radiolysis and create new species including hydrated electrons and hydrogen gas [Reference Schneider25]. Recent advances in preparation of liquid cells (LCs) for use in TEM are based on thin layers of graphene [Reference Ghodsi26] and hexagonal boron nitride (hBN) [Reference Jokisaari11] that encapsulate the liquid, making it vacuum-compatible. The LCs are ideal for spectroscopy as the window thickness and liquid volume are both extremely small compared to traditional SiN liquid-cell TEM holders, enabling a higher fraction of the EELS signal to come from the sample, as opposed to the window. For many imaging applications, the rigidity of graphene is preferable for the LC material, but as a conductor graphene has a continuum of background states in the ultra-low loss EELS region that can obscure the weak vibrational signals. Thus, for vibrational EELS, boron nitride liquid cells (BNLCs) are optimal for isotopically sensitive EELS as they have a clean background in the spectral region of the water and heavy water vibrational modes.
For the BNLCs discussed here, CVD-grown hBN on copper foil was obtained from commercial sources. After etching the copper support, the hBN layer was cleaned several times in pure water and transferred to a copper TEM mesh grid. This was dried, and the water and heavy water samples were drop-cast onto the hBN film. Subsequently, a top layer of BN was added to encapsulate the liquid sample by dipping the grid onto another hBN layer that was floating on H2O or D2O, depending on the sample.
Another example of beam-sensitive materials that are highly relevant in the biological sciences are amino acids, since they are the fundamental building blocks that guide biological processes [Reference Wu27]. In this context, we will review our recent study of crystalline clusters of L-alanine with different isotopic labels. The samples were prepared from commercial powders that were ground to nanoscale clusters with a mortar and pestle and then dispersed on a TEM grid. The clusters ranged from 100 nm to several microns but were sparse enough for ample vacuum between clusters, allowing singling out of individual clusters for aloof spectroscopy.
Monochromated Electron Energy Loss Spectroscopy in the STEM
The NION high-energy resolution monochromated EELS-STEM (HERMES) [Reference Krivanek28] (Figure 1a), which allows for nanoscale vibrational spectroscopy in the electron microscope, was used for the studies summarized here. The major components of the microscope from bottom to top are the electron gun, the monochromator, the aberration-corrector, the stage (location of the sample), and the spectrometer. This configuration allows for us to achieve an electron probe at the sample that is both monochromatic and aberration-free, enabling simultaneously high spatial- and spectral-resolution. While the aberration-corrector is critical to atomic-resolution studies, the aloof experiments summarized in this article do not require sub-Ångstrom resolution, so we will focus on the monochromator.
The principle of monochromation is demonstrated schematically in Figure 1b. The HERMES uses a dispersing-undispersing α-style monochromator, consisting of two identical halves related by mirror symmetry. In the first half, the electron beam traverses two magnetic prisms, and the electrons are dispersed as a function of energy. A variable slit, placed in the midplane of the monochromator, permits only a narrow band of energies to pass through. The beam is then energy-undispersed in the second half of the monochromator and reinserted in the microscope column as an undispersed beam of greatly reduced energy [Reference Hachtel29].
Figures 1c and 1d show the low-loss EEL spectrum for hBN at different levels of monochromation with the elastic scattering peak or zero-loss peak (ZLP) in Figure 1c and the hBN phonon response shown in Figure 1d. The monochromation has two effects: it cuts off the extended low-energy tail of the cold field emission energy distribution (enabling the hBN phonons to be detected clearly, even with a modest energy resolution of 100 meV) and improves the energy resolution of all features in the spectrum. An energy resolution of 5 meV yields the correct shape of the vibrational peaks and allows many modes tightly bunched together to be individually resolved.
Damage-Free Aloof Spectroscopy
Aloof excitation of the vibrational signal was first demonstrated in 2014 and has since become a prized technique for analysis of beam-sensitive samples due to the ability to observe vibrational excitations without directly irradiating the sample [Reference Krivanek2]. This is demonstrated in Figure 3, which shows a dark-field image of an hBN flake (Figure 3a) and several spectra acquired at different distances away from the sample (Figure 3b). We see that as we get further away from the sample the vibrational intensity drops, but it is still detectable even from 500 nm away from the sample. This is due to the fact that the electric field of the beam extends far beyond the actual beam trajectory and can still interact with phonons. The strength of the interaction between the beam and a sample (as schematically shown in Figure 3c) can be expressed as the following,

where b is the impact parameter of the electron beam (distance from the sample), ω is the frequency of the excitation, v is the velocity of the electron (in terms of the accelerating voltage of the electron microscope), and K 0 is a modified Bessel function of the second kind [Reference Egerton21].

Figure 3: Aloof excitations in monochromated EELS. (a) Dark-field image of a flake of hBN. (b) The aloof spectrum acquired of the BN phonon response from different impact parameters. (c) Schematic of an aloof interaction. (d) The aloof interaction strength as a function of impact parameter and excitation frequency, demonstrating the capacity to probe infrared excitations efficiently without activating damaging UV phenomena.
The K 0 Bessel function results in an inverse quadratic-like decay as a function of impact parameter (as one might expect for an electromagnetic interaction), which shows why the intensity of the phonon response decays (but does not go away) in Figure 3b. However, we also see that the interaction strength is inversely proportional to the frequency. This is especially critical for organic materials where the higher energy excitations (that is, > 3.5 eV) bleach molecules and break apart bonds [Reference Gomes30], but excitations at the level of molecular vibrations do not damage the material [Reference Rez10]. In Figure 3d the aloof interaction strength as a function of impact parameter for an IR and an UV excitation is plotted, and the UV excitation strength is only significant very close to the sample. Thus, a regime where the beam is a small (but non-zero) distance from the sample (~30–50 nm) can be defined, exciting the ultra-low IR phenomena effectively without activating the UV excitations that will damage the sample. In this “sweet spot” we can acquire spectra for long periods of time to achieve excellent signal-to-noise without damaging sensitive organic materials, enabling the precise measurement of the vibrational fine structure in molecules.
Isotope-Resolved Spectroscopy in Liquid Water
The first demonstration of isotope-resolved vibrational EELS was reported for liquid-water BNLCs [Reference Jokisaari11], a schematic of which is presented in Figure 4a. These liquid cells are generally between 25 and 50 nm thick, and the aloof spectra are recorded and shown in Figure 4b, enabling the clear detection of the O-H stretch mode. We can also use aloof EELS on a BNLC filled with heavy water, the spectra of which is also shown in Figure 4b. Here, we observe the signals from both the O-H stretching mode and the O-D stretching modes. The presence of the O-H stretching peak in the D2O is due to mixing of the specimen, and in part due to the atmospheric water deposited during sample preparation. The spectrum compares well with the Raman data in Figure 4c, using BN floating on water, as well as Raman spectra collected from pure D2O and H2O specimens. The floating BN does show a C-H band, likely resulting from residue from the etching process. However, there was no evidence of this in the EEL spectrum.

Figure 4: (a) Schematic of a liquid cell. (b) EEL spectra of H2O liquid cells and D2O + H2O liquid cells. (c) Comparison of EEL spectra, Raman of BN floating on water after etching, and Raman of pure D2O and H2O droplets. Figure adapted from [Reference Jokisaari11].
There is a clear separation of the O-D and O-H peaks data, enabling the direct detection of D2O in the liquid cell. In fact, the difference is significant enough to indicate the potential for isotope-labeling using heavier atoms, with smaller differences in mass between different isotopes, particularly as the technique continues to evolve.
Isotope-Resolved Spectroscopy in Biomolecules
The change in mass between hydrogen and deuterium (D) is significant and results in a measurable shift of the stretching mode, however, the ultra-high resolution of the microscope affords us the precision to see even more subtle changes. This was observed by isotopically labeling the amino acid L-alanine [Reference Hachtel12], which has 13 atoms and 4 different elements, meaning isotopic-labeling can take many different forms.
In Figure 5, we show the vibrational EEL spectra, acquired with an energy resolution of ~6 meV, from samples with different isotopic labels, and compare them to macroscopic FTIR measurements. We specifically examine the naturally occurring L-alanine (Figure 5a), 13C-labeling in the carboxyl group (Figure 5b), and deuterium (2H)-labeling in the methyl group (Figure 5c). For each sample, we show the chemical formula (i) and the vibrational spectra for EELS and FTIR for the spectral range between 80 and 220 meV (ii-EELS, iii-FTIR) and the spectral 220 and 420 meV (iv-EELS, v-FTIR).

Figure 5: Isotopic-labeling in amino acids. EELS and FTIR of four different isotopic configurations of L-alanine are shown: (a) Naturally occurring, (b) 13C-labeling in the carboxyl group, (c) deuterium labeling in the methyl group. For each sample the chemical formula (i), EELS (ii) and FTIR (iii) for the spectral range 80–220 meV and EELS (iv) and FTIR (v) for the spectral range 220–420 meV are shown. Figure adapted from [Reference Hachtel12].
The vibrational response is clearly more complex than water, with dozens of peaks in the low-energy range and a continuum of excitations in the higher-energy range where we observed only the isolated O-H and O-D stretch modes before. This also demonstrates the importance of ultra-high energy resolution in EELS, which is capable of resolving this vibrational fine structure. The isotopic resolution can be seen by comparing the natural L-alanine spectrum with the 13C-labeled L-alanine shown in the second row. In the 80–220 meV regime, a clear shift of the dominant peak at ~200 meV is present, as observed both in the FTIR and the EELS. This corresponds to the C-O stretch mode in the carboxylate group [Reference Tajkhorshid31], which is where the isotopic-label is in the molecule. The peak shifts by a factor of 1.026 (2.6%), which matches closely to the change in the reduced mass of a C-O pair with a 13C instead of a 12C ( ${\sqrt{\mu^{13} CO / \mu^{12} CO}= 1.022}$). Moreover, the measurement precision of the peak frequency is better than 0.2 meV, which both demonstrates the clear identification of isotopic labels and demonstrates that isotope-resolved spectroscopy could be pushed even further to heavier isotopes with smaller differences in the reduced mass while still being unambiguous.
While isotopic identification is simple for the case of 13C-labeling at the carboxyl site in L-alanine (and probably in many molecules where the C-O stretch mode is a dominant vibrational feature), the results are often not so clearly understandable. For instance, the deuteration in the methyl group results in a much more complex change to the vibrational fine structure, as seen in Figure 5c (ii–v). In this molecule, 4 different atoms have changed their isotopic character (as opposed to one), and the difference in weight is more significant ( ${\sqrt{\mu C^2 H / \mu C^1 H} = 1.363}$). Furthermore, the hydrogen atoms play a vital role in intermolecular bonding while the C-O stretch mode does not; as a result, the H atoms contribute to many coupled modes through the response as opposed to being attributed to single definitive peaks. Thus, in the isotopically enriched molecule, the spectrum is significantly altered, to the extent where the vibrational fine structure is nearly unrecognizable. In fact, the only clear similarity between the naturally occurring alanine spectrum and the 2H-labeled spectrum is the 12C-O stretch mode.
While no significant changes were observed in the 13C-labeling for the 220–420 meV spectral range, we can observe significant changes due to the D labeling in both FTIR, Figure 5c (iv), and EELS, Figure 5c (v). However, once again differences are observed, but there is no obvious shift or spectral feature that could be rigorously attributed to the deuteration, especially if a high degree of noise is present in the spectrum.
These results demonstrate that the vibrational response of a molecule is extremely sensitive to isotopic labeling, but interpretation of the response is not always straightforward. Therefore, while some atomic sites (carboxyl C atom) and vibrational modes (C-O stretch mode) allow for unambiguous identification of isotopic labels, other sites and other peaks do not. Future work will have to be rooted in theory with a clear understanding of the expected shifts due to the isotopic labels at deliberately chosen atomic sites.
Spatially Resolved Identification of Isotope Labels
Monochromated EELS now offers comparable spectral resolution to macroscopic optical techniques, and it is the nanoscale spatial resolution that drives the impact of the STEM/EELS approach. To demonstrate the spatial resolution of aloof vibrational EELS, we examine crystalline clusters of L-alanine with the different samples from Figure 5 dispersed on the same TEM grid and use the vibrational response to perform nanoscale identification of isotopic labels.
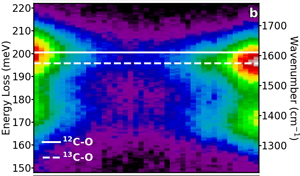
Figure 6a shows a dark-field image of two clusters of alanine separated by several hundred nm, one in its naturally occurring state (12C, same as in Figure 5a) and one with the isotopic enrichment at the carboxyl carbon site (13C, same as in Figure 5b). An EELS line scan was recorded, and each spectrum has the ZLP removed with a power law background subtraction and is plotted in Figure 6b. For each spectrum, the dominant C-O stretch (at 200 meV) is fit with a Lorentzian function, and the peak energies are plotted in Figure 6c. Here, we observe that a redshift is induced by the increased mass in the isotopically labeled molecules as a function of probe position. Additionally, while the measured peak values in Figure 6c clearly stabilize at the 12C-O frequency (naturally occurring) to the 13C-O frequency (isotopically labeled) at each end of the line scan, the delocalization of aloof mode spectroscopy measures the C-O frequency as a mixture of both, when the probe is between the two clusters. By calculating the strength of the interaction with each cluster as a function of separation of the two clusters, we estimate that aloof EELS can unambiguously determine the isotopic character of clusters separated by as little as 50 nm.

Figure 6: Spatially and isotopically resolved EELS. (a) Dark-field image of two alanine clusters: one with the natural occurring 12C isotope in the carboxyl site (left), and one with the 13C isotope (right). (b) The background-subtracted EELS from along the linescan, demonstrating the localization of the signal. (c) The dominant 200 meV peak (corresponding to the C-O stretch mode in the carboxyl group) is fit for each spectrum demonstrating the real-space visualization of the isotopic-redshift. Figure adapted from [Reference Hachtel12].
Conclusion
Monochromated EELS presents a powerful new option in the analysis of biological materials. The ultra-high energy resolution enables precise detection of the vibrational fine structure for straightforward identification of isotopic labels, and the aloof beam geometry enables beam-sensitive samples to be analyzed without incurring significant damage and sacrificing the nanometer spatial resolution. The examples shown here demonstrate the power of the technique, and they promise to lead to high spatial resolution analysis of whole-cell biological samples to enable real-space tracking of isotopically labeled molecules in the products of chemical reactions and metabolic pathways.
Acknowledgements
The authors would like to acknowledge Dr. Ilja Popovs of ORNL for his assistance with the FTIR data shown in Figure 5. Microscopy results shown here were supported by the Center for Nanophase Materials Sciences, which is a Department of Energy (DOE) Office of Science User Facility. Microscopy research was also performed, in part, using instrumentation within ORNL's Materials Characterization Core provided by UT-Battelle, LLC, under Contract No. DE-AC05- 00OR22725 with the DOE, and sponsored by the Laboratory Directed Research and Development Program of ORNL, managed by UT-Battelle, LLC, for the U.S. DOE. R.F.K. is supported in part by the Joint Center for Energy Storage Research (JCESR), an energy innovation hub funded by the U.S. DOE, Office of Science, Basic Energy Sciences.


