

United States
GDP growth, while erratic from quarter to quarter, has continued at an underlying annual rate of about 2 per cent (figure 4), with non-agricultural employment rising at an annual rate of about 1½ per cent – data that imply continuing weak growth of labour productivity. Unemployment fell in September to 4.2 per cent, the lowest since early 2001. Despite the apparent narrowing of output and employment gaps, consumer price inflation has remained below the Fed's longer-term objective of 2 per cent a year. Wage increases have picked up somewhat, but remain subdued. The Fed has not changed its target range for the federal funds rate since it raised it to 1.0–1.25 per cent in June. It began in October implementing the balance sheet normalisation programme that it had first described in June. Prospects for fiscal policy remain unclear; our forecast assumes unchanged policies. We expect GDP growth to continue at rates slightly higher than 2 per cent this year and next, little changed from our August projections.

Figure 4. US: GDP growth
After slowing in the first quarter of 2017 to 1.2 per cent at an annual rate, GDP growth picked up to 3.1 per cent, annualised, in the second quarter, the highest quarterly growth rate since early 2015. Taking the first half of 2017 as a whole, GDP growth relative to the preceding half-year was 1.8 per cent at an annual rate, somewhat higher than the 1.5 per cent growth rate of 2016. The strengthening of the expansion in the second quarter of this year is accounted for by a recovery in the growth of consumer spending and a halt to destocking, partly offset by a slowing of growth in fixed investment; net exports made a similar, slightly positive, contribution to GDP growth in the two quarters. More recent activity indicators have been affected by hurricanes that hit Texas in late August and Florida in late September, but they suggest continued moderate overall growth in the third quarter, of around 2–2½ per cent.
The growth of employment has continued to slow, no doubt reflecting, in part, the closing of the employment gap. Omitting the 33,000 drop in non-farm payrolls in September, which was significantly affected by disruptions caused by the hurricanes, the average monthly gain in non-farm jobs in July and August 2017 was 154,000, less than the average increase of 177,000 in the first half of the year and also below the average increases of 187,000 in 2016. Non-farm employment in July and August 2017 was 1.4 per cent higher than a year earlier – the lowest 12-month growth rate in six years. Unemployment, having stabilised between April and August in the 4.3–4.4 per cent range, fell to 4.2 per cent in September – a number not considered to have been affected significantly by the hurricanes. This is the lowest unemployment rate since February 2001, and 0.4 percentage point below the Fed's median estimate of its longer-term sustainable level. The labour force participation rate in August was 63.1 per cent, its highest level since early 2014.
Consumer price inflation has remained below the Fed's medium-term objective of 2 per cent, with little recent sign of upward movement, but the depreciation of the US dollar since late 2016 – by about 8 per cent in trade-weighted terms – is likely to put some upward pressure on prices in the coming months. Consumer price inflation in the year to August was 1.4 per cent in terms of the all-items price index for consumer expenditure (the Fed's preferred gauge for inflation) and 1.3 per cent in terms of the corresponding core index. In both cases, 12-month inflation has declined in recent months. Market-based measures of expected future inflation have generally remained close to the Fed's target: the 5-year breakeven rate has fluctuated between 1.5 and 2.0 per cent over the past year, and was about 1.7 per cent in late October. Meanwhile there has been some limited rise in wage growth. In the year to September, average hourly earnings were 2.9 per cent higher than a year earlier, the top of the range of 2.4–2.9 per cent annual increases seen over the past two years. The September data may, however, have been distorted upwards by hurricane effects, particularly in reducing the relative number of low-paid workers on payrolls.
As announced on September 20, the Fed began in October the balance sheet normalisation programme it had described in June (see August Review, F51). The programme will gradually reduce the size of the Fed's balance sheet by limiting the reinvestments of the proceeds from maturing Treasury securities and principal payments from agency securities. In the fourth quarter of 2017, the declines in the Fed's security holdings will be capped at $6 billion a month for Treasury securities and $4 billion a month in agency securities. The two caps will rise gradually to $30 billion and $20 billion respectively. The Fed also indicated that, as in June, its median expectation was that the federal funds rate would be raised by a further 25 basis points by the end of 2017 and a further 75 basis points by the end of 2018. However, its median expectation for the rate at end-2019 was lowered slightly to 2.7 per cent, and that for the longer run was lowered slightly to 2.8 per cent. Its median expectation for inflation remained that its 2 per cent objective would be met by 2019, with unemployment at 4.1 per cent, below its unchanged projection of 4.6 per cent for the longer-run sustainable unemployment rate.
With regard to overall financial conditions in the US, the decline in bond yields, the depreciation of the dollar, and increases in stock market prices since late last year have partly offset the actions of the Fed in reducing monetary accommodation.
Prospects for fiscal policy remain uncertain. President Trump signed into law on 8 September, ahead of the end-month deadline for action, a bill extending the government's funding and suspending its debt limit to 8 December. The measure also provided funding for assistance to areas affected by the recent hurricanes. Funding for the federal government and reactivation of the debt ceiling beyond December 8 need to be addressed in the coming weeks. At the same time, the Administration and Congress are formulating plans to cut taxes and boost infrastructure spending. In late September, the White House unveiled a ‘Unified Framework’ for tax reform, including cuts in corporate and personal income tax.Footnote 3 The proposals lacked specificity, but a preliminary analysis by the independent Tax Policy Center estimated that it would reduce federal revenue by $2.4 trillion over ten years, which would represent about 7 per cent of revenues at their level in the 2017 fiscal year.Footnote 4 Administration officials have questioned such calculations as ignoring the possible beneficial effects of the tax cuts on revenues through higher economic growth.Footnote 5
In early October, the Treasury released its second report on reform of financial regulation, following the report on reform of banking regulations published in June (see August Review, F51). The new report recommends the repeal of provisions of the Dodd-Frank Act that are considered to impede the formation of public companies, and calls for ‘recalibrating’ the rules governing the market in derivatives. Some of the proposed initiatives would require legislation but most could be implemented by regulators through the rulemaking process.
Canada
In the first half of 2017, the economy's growth performance was significantly stronger than expected. After solid quarterly growth of 0.9 per cent in the first quarter, GDP increased by 1.1 per cent in the second, reaching a level 3.7 per cent higher than a year earlier. Recent growth has been broadly based, with both domestic and foreign demand contributing positively. Consumer expenditure increased by 1.1 per cent in the second quarter, business investment by 1.7 per cent, and government consumption and investment by 0.6 and 0.1 per cent, respectively. The only component of domestic demand that contracted on a quarterly basis was housing investment, with changes to tax and housing finance policies implemented in the spring helping to cool down the housing market. While imports increased by 1.8 per cent in the second quarter, the global recovery helped to boost exports by 2.3 per cent. More recent indicators – including flat monthly GDP in July – point to a moderation of growth in the third quarter. We have raised our GDP growth forecast for 2017 as a whole to just above 3.0 per cent, from 2.7 per cent in the August Review. With capacity constraints likely to start to bind, we expect GDP growth to slow to rates slightly higher than 2 per cent next year and in 2019.
Unemployment stabilised at 6.2 per cent in August and September, after declining by 1.1 percentage points from the peak reached early last year and by 2.5 percentage points from the peak of 2009. Narrowing output and employment gaps have continued to feed only slowly into price and wage growth, and annual consumer price inflation has remained below the Bank of Canada's 2 per cent target. The all-items rate, on a 12-month basis, was 1.4 per cent in August – close to the middle of the range of inflation rates seen over the past year – and we expect it to remain close to this level in the coming months. The Bank of Canada's preferred measures of core inflation ranged between 1.4 per cent and 1.7 per cent in the year to August. Meanwhile, wage growth has remained subdued, at 2.2 per cent in the year to September.
In a move that was generally unexpected, the Bank of Canada raised its main policy rate on 6 September for the second time since July (and also since 2010), by 25 basis points to 1.0 per cent. In the context of below-target inflation, it cited stronger than expected data on economic activity, and stressed that it would continue to closely monitor evidence of inflationary pressures. These may be tempered by increases in productive capacity generated by the recent growth of business investment and by increases in the labour force. Structural changes related to the digital economy and seemingly well-anchored inflation expectations may also limit near-term increases in inflation. The Bank has also acknowledged that it will have to take account of the fact that the economy's sensitivity to interest rates has been increased by high household indebtedness.
The Bank will also need to take account of movements in the exchange rate. The evidence of an upturn in economic growth in recent months, together with the increases in official interest rates, led to a sharp appreciation of the Canadian dollar between early May and mid-September, by about 12 per cent both against the US dollar and in trade-weighted terms. Although a small part of this appreciation was reversed in the following month as the US dollar strengthened broadly against other major currencies, the rise of the Canadian dollar since the spring will itself have tightened financial conditions and borne down on inflation.
The main risks to our forecast are unexpected movements in oil prices and changes in US fiscal and trade policies. In August, the renegotiation of NAFTA officially started. Dispute settlements, labour standards, rules of origin, and a US proposal that the agreement be subject to confirmation by the three countries every five years are among the contentious topics. The deadline for negotiations is implicitly set at early 2018, ahead of presidential elections due to take place mid-year in Mexico. The free trade agreement between the EU and Canada entered into force provisionally in September.
Euro Area
GDP growth has clearly strengthened over the past year. Since late 2016 it seems to have settled at a pace of 2–2½ per cent a year following three years of growth generally in the range of 1½–2 per cent a year. However, unemployment remains high and its decline has stalled in recent months: at 9.1 per cent in June–August, it was 3.0 percentage points below its peaks of early 2013 but 1.8 percentage points above its March 2008 trough. Consumer price inflation has remained below the ECB's target – the 12-month all-items rate in August and September was 1.5 per cent – and wage increases have remained subdued. After its October meeting, the ECB announced no changes in its benchmark interest rates but indicated that from January 2018 its asset purchases would be scaled down to €30bn a month from €60bn.
The general appreciation of the euro between April and September – by about 7 per cent in trade-weighted terms – tightened financial conditions, partly counteracting the ECB's monetary policy stance, and is now restraining the rise of inflation (figure 5). The ECB revised its forecast of inflation in 2018 and 2019 down to 1.2 and 1.5 per cent, respectively, to take account of the euro's appreciation. It referred to the ‘recent volatility’ of the exchange rate as a ‘source of uncertainty’ and most members of the Governing Council expressed concern about the appreciation. More recently, the exchange rate has stabilised.

Figure 5. Euro Area: consumer price inflation and effective exchange rate
GDP rose by 0.6 per cent in the second quarter of 2017 to a level 2.3 per cent higher than a year earlier. Growth in the second quarter was marginally faster than in the first but was the same as in the final quarter of 2016. It continued to be driven mainly by domestic demand, with fixed investment again growing particularly strongly; net exports made a small positive contribution to GDP growth in the second quarter. More recent data, including from surveys, indicate continued steady and broad-based growth. Industrial production in August was 3.8 per cent higher than a year earlier, while the European Commission's economic sentiment indicator rose in September to its highest level since its pre-crisis peak in 2007. Our forecast for GDP growth this year and next has been revised up marginally from August, to around 2 per cent.
The unemployment rate fell by a full percentage point, to 9.2 per cent, in the year to April 2017, but more recently its decline has stalled at 9.1 per cent in June–August. This does not seem due to any significant weakening of employment growth: employment grew by 0.4 per cent in the second quarter, to a level 1.6 per cent higher than a year earlier. Unemployment continues to differ very widely among member countries: in August it ranged from 3.6 per cent in Germany to 9.8 per cent in France, 11.2 per cent in Italy, 17.1 per cent in Spain, and 21.2 per cent in Greece.
All-items consumer price inflation, on a 12-month basis, was 1.5 per cent in August and September 2017, having fallen back from the peak of 2.0 per cent reached last February, which reflected the partial recovery of global energy prices and depreciation of the euro over the previous year. The corresponding core inflation rate has been below the all-items rate since the end of last year: at 1.1 per cent in September, it was within the range of 0.9–1.2 per cent seen in the previous five months. Although higher than the rates of below 1 per cent that prevailed between late 2013 and late 2016, consumer price inflation thus remains below the ECB's medium-term objective of ‘below, but close to, 2 per cent’. The appreciation of the euro in recent months – by about 7 per cent on a trade-weighted basis between April and September – will be a factor weighing on inflation in the coming months.
Wage growth has recently been towards the upper end of the 1½–2 per cent range seen since early 2015. In the year to the second quarter, wages and salaries in the Area rose by 2.0 per cent while hourly labour costs rose by 1.8 per cent. Given the 0.7 per cent growth of output per employee in the year to the second quarter implied by the data for GDP and employment growth, recent wage growth still seems low in relation to the ECB's inflation objective. Differences in wage growth among member countries have remained somewhat helpful to a rebalancing of international competitiveness in the Area: in Germany, in particular, hourly labour costs rose by 2.3 per cent in the year to the second quarter, higher than the average for the Area as a whole.
After its monetary policy meeting on 26 October, the ECB announced that it had decided to leave its benchmark interest rates unchanged. With regard to official interest rates, it repeated its earlier guidance that it “expected them to remain at their present levels for an extended period of time, and well past the horizon of our net asset purchases”. It announced that its asset purchases would be reduced in January 2018 to €30 billion a month from €60 billion, and that it intended to continue purchases at that pace through September 2018 “or beyond, if necessary, and in any case until the Governing Council sees a sustained adjustment in the path of inflation consistent with its inflation aim.” After its earlier, September 2017, meeting, the ECB had indicated that, in light of recent data, the ECB staff's projection of GDP growth in 2017 had been raised to 2.2 per cent from 1.9 per cent last June, but its growth projections for 2018 and 2019 had been left unchanged, at 1.8 and 1.7 per cent, respectively. Their projections of inflation had been left unchanged for 2017 at 1.5 per cent, but lowered marginally for 2018 and 2019, to 1.2 and 1.5 per cent, respectively, to take account of the recent appreciation of the euro. The ECB also stated that it stood ready to increase its asset purchases if the outlook or financial conditions became less favourable.
The burden of non-performing loans has recently been reduced, partly by the Area's strengthening economic recovery, but they continue to constrain the supply of credit, particularly in certain countries, including Italy. In early October, the ECB proposed a rule change intended to encourage banks to realise losses. It would require lenders to post collateral within two years against the entire unsecured part of loans declared non-performing beginning in January 2018, and against the secured part within seven years. This would replace current, less stringent, requirements, under which many banks fall short of 100 per cent coverage. A public consultation will be held in November on the planned rule change.
Germany
The results of the federal elections on 24 September weakened the position of Chancellor Merkel, although she will remain in her post. A coalition between her CDU/CSU (Christian Democratic Union/Christian Social Union) bloc, the Greens, and the more market-liberal FDP (Free Democratic Party) is the likely outcome of current negotiations, her former coalition partner, the SDP (Social Democratic Party), having ruled themselves out of participation in the new government. Such a coalition seems unlikely to be more disposed than the previous government to reforms of the European Monetary Union involving more risk-sharing by member countries. In a compromise with the CSU, Merkel's CDU has agreed to limit the number of refugees entering Germany to 200,000 per year, except in exceptional circumstances. This will have only a limited effect on our unemployment forecast in the near term since refugee integration into the labour market is typically very slow. It will, however, lower the path of government spending and therefore GDP growth, all else being equal.
Box B. Simulation of French 5-year fiscal plan
Last May Emmanuel Macron was elected President of France and his manifesto promised to tackle the French economy's well-known challenges: a high level of taxesFootnote 1 and public spending, a competitiveness problem and high unemployment. On 27 September 2017, the French government presented its draft 5-year budget planFootnote 2 to be discussed by Parliament. The following analysis suggests that, if implemented, the French fiscal plan strikes a fine balance between improving the French economy's medium-term growth prospects, returning public finances to a more sustainable path and not hurting short-term GDP growth. By 2022, the budget balance would be improved by 1.3 per cent of GDP and GDP would be at about the baseline level.
This analysis first describes the main measures of the budget plan. It then uses the National Institute's Global Econometric Model (NiGEM), which includes a model of the French economy linked to the global economy by trade and financial markets, to simulate the impact on the main macroeconomic variables and discusses the results.
The budget plan can be summarised in five numbers: reduction in taxes by 1 per cent of GDP together with a reduction in public spending of 3 per cent of GDP, in order to achieve a reduction in budget deficit of 2 per cent of GDP and a reduction of debt of 5 per cent of GDP, all within five years. The tax cuts are designed to encourage investment in productive capital and raise the economy's competitiveness. For the purpose of simulating the plan in NiGEM, we grouped tax changes into three broad categories: corporate taxes that impact the user cost of capital and hence corporate profitability, direct taxes that impact household income and indirect taxes that impact domestic prices. Households would benefit from a €24 billion cut in direct taxes partly offset by a €14 billion increase in ‘green’ taxes over five years. We modelled the increase in ‘green’ taxes, mainly carbon and diesel taxes, by an increase in the indirect tax rate because it is expected to increase domestic prices (see Delannoy et al. (2012)Footnote 3 for an analysis of the fuel duty impact on the macroeconomy). Companies would also benefit from a reduction in the statutory corporate income tax (CIT) rate from 33⅓ to 25 per cent by 2022. Although part of this rate cut had been voted by the previous parliamentary majority,Footnote 4 it was not already included in our baseline, so we assume that the full effects of this measure rests on the current plan. Companies facing lower corporate tax are expected to respond by investing more in the domestic market, thus raising the tax base and partly offsetting the expected tax revenue loss. Indeed, between 2000 and 2016, the average statutory CIT rate in OECD countries declined from 32.2 to 24.7 per cent, but average revenues from CIT were stable at around 3 per cent of GDP.
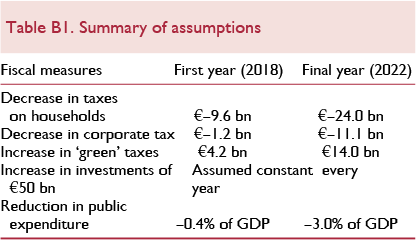
Fiscal consolidation would be mainly achieved by a progressive reduction in public expenditure compared to the trend reaching 3 per cent of GDP in the fifth year, which might be considered very ambitious. We assume that the cut in public spending, which aggregates a lot of different measures, is linear across time, and split into Footnote 2/3 from government consumption and ⅓ from transfers, the latter reflecting mainly cuts to social security spending. In order to spur future growth, the new government plans to increase public investments by around €50 billion over five years in order to reverse the 12 per cent decline in public investment between 2009 and 2016.Footnote 5
There is also a set of technical assumptions embedded in our scenario. The European Central Bank is assumed to react to deviations from inflation and nominal GDP targets in the Eurozone by moving short-term interest rates. The fiscal measures are calibrated to fit into a five-year window and the model computes the dynamic response assuming forward-looking expectations in wages, exchange rates, bond and equity prices.
A first result of our simulation is that the reduction in the CIT rate of 8⅓ percentage points acts as a positive supply shock. By reducing the user cost of capital, it is likely to encourage companies to invest more, and our simulation suggests a 10 per cent increase in private sector investment relative to baseline in five years. Companies which are more capital intensive are more productive and can afford to pay their employees a higher salary. In the long run, the economy benefits from having more capital, and potential output is higher (figure B1).

Figure B1. Impact on real private sector investment and real potential output
Households also benefit from (income) tax cuts and their real personal disposable income would be improved because the effect of the tax cut would dominate the reduction in transfers. We estimate that about half of the increased income would be saved. The other half would increase private consumption despite the hike in ‘green’ taxes pushing prices up. Increased domestic demand would create some inflationary pressure in the first year (0.2 percentage point higher), which would then recede as the growth in potential output pushes down the output gap. It would also lead to higher imports, and a worsening of the current account balance by up to 0.4 percentage points of GDP in 2022.
Despite the increased business activity, our simulation does not forecast a decrease in unemployment for two reasons. First, the increase in wages and the decrease in the user cost of capital make companies more likely to invest in capital than labour. Secondly, the public sector is expected to reduce its workforce to achieve the planned decrease in public expenditure.
While the budget plan would clearly lead to a consolidation of the government's budget, it seems to us that the quantitative objectives are too optimistic. As can be seen from figure B2, the front loading of the tax cuts and the initially moderate spending cuts mean that fiscal policy would actually be expansionary in the first year. In the following years, as the reduction of public spending becomes broader, the budget deficit would be reduced by up to 1.3 percentage points of GDP in year 5. Even though it goes some way towards achieving fiscal sustainability, it is still less than the 2 per cent in the government's plan for several reasons. First, the increase in government investment weighs on the deficit by up to 0.5 per cent of GDP per year. As this investment is presented as temporary, one can expect it to be removed from the structural budget balance thereafter. Secondly, the scale of the tax cuts naturally reduces the fiscal consolidation effort. This can be seen in the public debt ratio, which would decline by 2.9 percentage points of GDP, much less than the 5 per cent in the budget plan. Thirdly, our estimates of inflation and output growth are both lower than the government's forecast in 2021–2.

Figure B2. Impact on the general government's budget balance to GDP
In aggregate, the simulation suggests that the fiscal package has the potential to stimulate the supply side of the economy much more than the demand side. Real GDP would be only a quarter of a per cent higher in the fifth year than the baseline as the negative effect of the reduction in public spending almost completely offset the positive effect of tax cuts and increased investments (figure B3). But the structural shift towards lower taxes and lower public expenditure would significantly improve growth prospects in the medium term, once the fiscal consolidation is over.

Figure B3. Impact on real GDP of the main fiscal measures
There are several limitations to this simulation related to the assumptions we made. First the impact of corporate tax cut on private sector investment is very large in our simulation (10 per cent increase in five years). As many countries engage simultaneously in corporate tax cuts, it is possible that the effect may be weaker because of international competition. Another risk balancing the first one is that our simulation does not assume any direct competitiveness gains from a reduction in corporate taxes, for example in the form of an improvement in companies' market share abroad.
An additional risk is related to the timing of the public sector cut. By assigning a large majority of the reduction in public sector expenditure to the second half of the 5-year term, President Macron risks not having enough political capital left to enforce an unpopular measure at the end of his term, when he might be running for re-election and the economy might be in a less favourable part of the business cycle. In his term, President Hollande promised a growth of public spending of 0.5 per cent per annum in volume, but could only achieve 0.9 in 2013–2016. A smaller reduction in public spending would be positive for GDP and negative for the budget balance.
A final risk is that we do not take into account the potential of other measures, like the labour market reform, or the possible reduction of inefficient public spending, to raise French productivity and GDP.
Notes
1 The tax-to-GDP ratio was at 45½ per cent in 2016, the second highest in OECD countries behind Denmark.
2 ‘Projet de loi de finance 2018’ and its supplement ‘Rapport économique, social et financier 2018’
3 Delannoy, Holland, Liadze (2012), The impact of fuel duty on the macro-economy, NIESR Discussion Paper, No. 398.
4 Draft 2018 budget proposes starting from 2018 a reduced rate of 28% for profits over €0.5mn, 33⅓ otherwise. Statutory rate would then decline to 31, 28, 26.5 and 25 in 2019, 2020, 2021 and 2022 respectively. Small and medium sized companies will continue to benefit from a reduced rate of 25% for profits below €38,120.
5 NiGEM database.
Economic growth in the first half of 2017 was the strongest in three years. Output grew by 0.6 per cent in the second quarter, after 0.7 per cent growth in the first, reaching a level 2.1 per cent higher than a year earlier. Growth in the second quarter was more than accounted for by domestic demand, with net exports contributing negatively. More recent indicators suggest continued robust growth in the third quarter. We expect growth of 2.1 per cent in 2017 as a whole, slowing to 1.7 per cent in 2019 and 1.3 per cent in the medium term as capacity constraints bite. Downside risks to the forecast include the possibility of increasing protectionist measures by the US and disruptions to trade that could be associated with Brexit.
Unemployment fell to 3.6 per cent in August, its lowest level since unification. Nevertheless, there has been little sign of a significant rise in wage growth: in the year to the second quarter of 2017, hourly labour costs (as estimated by Eurostat) rose by 2.3 per cent, only marginally higher than the 2.2 per cent rise in the year to the second quarter of 2016. Subdued wage growth may be attributable partly to immigration, including of skilled workers. We expect unemployment to average 3.7 per cent this year and to rise slightly in 2018–19.
Consumer price inflation on a 12-month basis was 1.8 per cent in September, unchanged from August, driven by rising food and energy prices. We expect inflation to fall back to a little under 1½ per cent next year and in 2019.
The current account surplus remains very high but may be beginning to decline. It narrowed slightly to 8.3 per cent of GDP in 2016 from 8.6 per cent in 2015, and is projected to narrow further to around 7½ per cent of GDP in 2018 and 2019. Factors contributing to this slow adjustment include the gradual improvement in the competitive positions of Euro Area partners with larger output gaps and slower wage growth, as well as the strengthening economic recovery in Euro Area partner countries and the broader global economy. The general appreciation of the euro this year will also help the process.
France
The economy has maintained the improved growth performance it achieved late last year. In the second quarter of 2017 GDP grew, for the third successive quarter, by 0.5 per cent, reaching a level 1.8 per cent higher than a year earlier – the highest four-quarter growth rate in six years.
While quarterly GDP growth has recently been steady, its expenditure composition has been erratic. In the second quarter of 2017, a major contribution to growth came from a bounce-back in net exports, which contributed 0.6 percentage point to GDP growth following a negative contribution of similar magnitude in the first quarter. Exports increased by 2.4 per cent in the second quarter, while imports increased by only 0.3 per cent. Meanwhile fixed investment, which has played an important role in the economic recovery, decelerated to 0.9 per cent growth in the second quarter from 1.4 per cent in the first. Household consumption accelerated slightly to 0.3 per cent growth in the second quarter from 0.1 per cent in the first, supported by a boost to real incomes provided by a decline in consumer price inflation. This also allowed a small rise in the household saving ratio to 14.5 per cent in the second quarter from 14.1 per cent in the first.
More recent indicators suggest continued robust output growth in the third quarter. Industrial production grew by 2.4 per cent in the year to the three months ending in August 2017, and recent survey indicators of industrial activity and business confidence, including INSEE's business climate indicator, have shown the highest readings since 2011. Our forecast of GDP growth in 2017 as a whole has been revised up marginally to 1.7 per cent, and we expect growth to continue at this rate in 2018.
Despite the recent strengthening of economic growth, unemployment, which has been on a slow downward trend since it peaked at 10.5 per cent in mid-2015, turned up slightly in recent months, from a low of 9.5 per cent in May to 9.8 per cent in August. The downward trend is forecast to resume in the coming months, with the average rate falling towards 9 per cent next year and to 8½ per cent in 2019. A more favourable picture of the strength of the labour market is presented by the employment rate – the ratio of people in employment to the overall population – which rose to 65.3 per cent in the second quarter of 2017, the highest since 1980.
Labour market outcomes are likely to be affected by recent policy announcements. In late August, the government unveiled a second set of measures to liberalise the labour market, going further than the reforms of August 2016. Aimed at boosting job creation, the measures, which were enacted on 22 September, limit the damages that courts can require employers to pay in cases of wrongful dismissal; reduce the time limit within which employees can bring cases to court; enable small businesses to negotiate specific deals with employees and without union representation on areas including pay; enable large companies to negotiate ad hoc agreements with unions instead of having to abide by sector-wide rules; reduce the number of statutory bodies representing workers within companies; and increase by 25 per cent the size of severance packages.
Consumer price inflation, on a 12-month basis, has picked up somewhat in recent months, to 1.1 per cent in September from a low of 0.8 per cent in June and July. We expect it to remain in the 1.0–1.5 per cent range in 2018–19, below the ECB's medium-term objective. Wage growth has remained moderate, at 1.9 per cent in the year to the second quarter, with overall hourly labour costs rising by only 1.4 per cent in this period.
Low interest rates, together with moderately rising real wages and employment, have boosted the housing market. The volume of transactions reached an all-time high in the year to June 2017, and housing investment increased by 5.3 per cent in the year to the second quarter, the largest four-quarter increase since 2010. House price inflation in this period increased to 3.5 per cent from 2.7 per cent in the year to the first quarter.
The government published a draft of its 5-year fiscal plan on 27 September. It includes a broad range of measures on taxes and spending to reduce the budget deficit and improve economic growth. Box B discusses the main measures and their likely effects. Our simulation suggests that it would lead to a reduction in the budget deficit of 1.3 per cent of GDP by 2022. Output growth would be increased only in the medium term after the fiscal consolidation is over. As the plan has not yet been approved by the National Assembly, the only measure included in our baseline forecast is the progressive reduction in the corporate tax rate from 33⅓ to 28 per cent between 2018 and 2020 because it had already been approved by the previous Assembly; the new plan includes a further reduction in the rate to 25 per cent by 2022.
Italy
GDP grew by 0.3 per cent in the second quarter of 2017, the slowest rate in three quarters. But the pick-up in growth in the latter part of last year is reflected in the rise of four-quarter growth to 1.5 per cent in the second quarter of 2017, the highest such rate since 2011. The moderate strengthening of growth has been driven by domestic demand, supported by government reforms as well as accommodative monetary conditions. Our forecast is for annual growth to remain at about 1¼ per cent over the next two years.
Despite the recent strengthening of the economic expansion, the decline in unemployment has stalled since the spring: in August, the unemployment rate was 11.2 per cent, the same as in April. Though below its 2014 peak of 13.0 per cent, it remains much higher than its pre-crisis lows of around 6 per cent and well above the Euro Area average. We expect unemployment to resume its slow decline in the forecast period, to average around 11 per cent next year and in 2019.
After periods of deflation in 2014–16, the 12-month increase in consumer prices was within the 1–2 per cent range throughout the first nine months of this year. In September it was 1.3 per cent, little changed from the previous three months. We expect consumer price inflation to average around 1½ per cent in 2017 and 2018, before rising towards the ECB's target in the medium term.
In September, the government announced revised fiscal plans for 2018–20, with the budget deficit targeted to fall from 2.1 per cent of GDP in 2017 to 1.6 per cent in 2018, 0.9 per cent in 2019, and 0.2 per cent in 2020. On this plan, the primary surplus would rise from 1.7 per cent of GDP this year to 3.3 per cent in 2020. Public debt would post its first decline in a decade next year, to 131.6 of GDP from 132.0 per cent at the end of 2017, followed by further declines to under 125 per cent of GDP in 2020. As these plans have not yet been passed by parliament, they have not been incorporated into our forecast.
There are risks to our forecast on both the upside and the downside. On the upside, some indicators suggest a more vigorous acceleration in economic activity than we are forecasting, particularly in manufacturing. The growth of industrial production has continued to trend upwards, reaching 5.7 per cent in the year to August, and the PMI for manufacturing in September was the highest since early 2011. Recent indicators of business and consumer confidence have also been high. On the downside, weaknesses in the banking sector remain a significant risk, although there has been important progress in easing the burden of non-performing loans: in July, the stock of bad loans fell by almost 10 per cent – the largest monthly decline since records began in 1998 – to reach their lowest level since 2014. There are also significant political risks relating to the general election due by May 2018, with one of the leading parties promoting an agenda antagonistic to the EU.
Spain
The economy's relatively strong recovery reached a landmark in the second quarter of 2017, with GDP for the first time exceeding its pre-crisis peak. Output in the quarter rose by 0.9 per cent, slightly faster than average quarterly growth over the past two years, reaching a level 3.1 per cent higher than a year earlier. Growth has continued to be associated with a broad expansion of private domestic demand, although net exports have also contributed positively. More recent indicators, including PMIs, point to continued vigorous growth in the third quarter. We expect GDP growth of 3 per cent in 2017 as a whole, moderating a little to about 2½ per cent in 2018 and a little lower in 2019 as economic slack is reduced.
Unemployment stabilised at 17.1 per cent in June–August after falling steadily from its 2013 peak of 26.3 per cent. The latest unemployment rate is the lowest since early 2009, but it is still well above the average for the Euro Area and more than double the low of 7.9 per cent reached in Spain ten years ago. Given our forecast of economic growth, we expect unemployment to continue declining gradually, but to remain high, at an average of over 15 per cent next year and around 14 per cent in 2019.
Following a period of deflation between mid-2014 and mid-2016, in terms of 12-month changes in the consumer price index, inflation returned and reached a peak of 3.0 per cent in early 2017, largely reflecting rising energy prices; core inflation rose only slightly above 1 per cent. More recently, since May, the 12-month HICP inflation rate has ranged between 1.6 per cent and 2.0 per cent; in September it was 1.8 per cent. Nominal wage growth has remained very low, at 0.4 per cent in the year to the second quarter, implying declining real wages. With still substantial economic slack, there is little reason to expect significant domestic inflationary pressure in the near term. Consumer price inflation is projected to fall back into the range of 1–1½ per cent in 2018 before picking up slightly in 2019, while remaining below the ECB's target.
Downside risks to Spain's economic outlook stem from the recent dispute between the Spanish government and the government of the Catalonia region relating to a referendum organised by the regional government on 1 October on the issue of Catalonian independence. While the referendum was judged to be illegal by the Constitutional Court of Spain, more than 2 million votes were cast, of which 92 per cent favoured independence. On 21 October, the Spanish prime minister announced that the government would trigger Article 155 of the Spanish constitution, meaning that the current regional government would be removed, and local elections held within six months. Reactions to the dispute in financial markets have been muted: the spread between the yield on Spanish and German 10-year government bonds in late October was only about 15 basis points wider than in late July, and the Spanish stock market was only about 3 per cent lower. However, there are potentially significant fiscal and wider economic risks for Spain should the issue not be resolved.
Japan
Supported mainly by private consumption, exports, and government investment, output expanded by 0.6 per cent in the second quarter of 2017 – the sixth consecutive quarter of positive GDP growth, making this the longest spell of expansion in Japan since 2006. More recent indicators, including evidence of improved business conditions in the Bank of Japan's Tankan survey in September, point to continued moderate growth. Partly as a result of recent unexpectedly strong data, our forecast of GDP growth this year has been revised up slightly to 1.5 per cent. Growth is expected to slow somewhat next year to 1 per cent as private consumption growth moderates and to slow further towards 0.8 per cent in the medium term, which is our estimate of the economy's potential growth rate.
The labour market remains tight, with unemployment in June-August at 2.8 per cent, a 23-year low, and the job-offers-to-applicants ratio rising to 1.52 in July and August, the highest since 1974. In October, the Bank of Japan published an estimate that in the second quarter of 2017 output exceeded full capacity by 1.22 per cent – the widest positive output gap in nine years. Nevertheless, increases in wages and prices have remained subdued. Average nominal wages (defined as compensation per employee hour) have been increasing modestly since 2013, but their recent rate of increase is no more than 1–1½ per cent a year, as illustrated in figure 6. We expect the modest rise in wage growth to continue, as the tight labour market puts pressure on companies to fill vacancies and to convert part-time workers into full-time ones.

Figure 6. Japan: unemployment, inflation and wage growth
In recent months there has been some upward movement in 12-month consumer price inflation measured in terms of both the all-items price index and the ‘core’ index excluding fresh food: both reached 0.7 per cent in August, the highest in both cases since 2015. However, there has been almost no upward movement in the ‘core core’ inflation measure, which excludes energy as well as fresh food; it was 0.2 per cent in August, up from 0.1 per cent in July. The Bank of Japan aims to reach its 2 per cent target for inflation by around April 2019 – a target date that has been pushed forward six times. We do not expect inflation to reach this target in the next few years: we forecast inflation of around ½ per cent next year, rising to around 1 per cent in 2019. With wage growth expected to continue modestly exceeding overall price inflation, real incomes are expected to rise, supporting rising private consumption.
On 28 September, parliament was dissolved ahead of a general election on 22 October. The results gave Prime Minister Abe an increased parliamentary majority, which may accelerate progress with the reforms associated with ‘Abenomics’. Following the result, Mr Abe emphasised that he would continue to press firms to boost wages.
China
Economic growth in 2017 has continued to exceed, by narrow margins, both last year's average growth of 6.7 per cent and the official objective of ‘around 6.5 per cent’ for this year as a whole. After four-quarter growth of 6.9 per cent in the first two quarters of 2017 – the strongest expansion since the third quarter of 2015 – GDP increased by 6.8 per cent in the year ending in the third quarter. With recent economic performance supported by targeted fiscal and monetary measures, we have raised our growth projection for 2017 as a whole marginally to 6.8 per cent. We expect the secular slowing of the economy to resume in 2018, with GDP growth of around 6½ per cent, followed by about 6 per cent in 2019. We expect average growth in 2018–20 to be more than sufficient to meet the government's long-standing objective of doubling GDP in the decade to 2020.
Factors contributing to the prospective slowing of growth include measures to reduce overcapacity in industry and promote the rebalancing of the economy towards consumption and services, and also actions taken over the past year to tighten monetary conditions and strengthen regulatory oversight of the financial sector, aimed at reducing over-indebtedness in the corporate sector and reducing financial risk (figure 7). On the other hand, targeted fiscal and monetary stimuli – like the reductions in required reserve ratios announced in early October for bank lending to small businesses, which are to come into effect in 2018 – are likely to continue to be used to soften the impact of these policies in particular sectors.

Figure 7. China: growth of credit to non-financial corporations
Consumer price inflation, on a 12-month basis, has been below the official target of 3 per cent a year for four years. In recent months, it has fluctuated around 1.5 per cent; it was 1.6 per cent in September. Producer price inflation has been much more volatile. After almost five years of decline, producer prices picked up sharply late last year and by February 2017 were almost 8 per cent higher than a year earlier. The 12-month rate of producer price inflation has eased more recently, but in September it was still 6.9 per cent, driven mainly by rising prices of industrial raw materials. Consumer price inflation is forecast to pick up to a little over 2 per cent in 2018 and 2019, before reaching the 3 per cent target in the medium term.
The property market appears to have cooled, following the introduction of various measures by the authorities since March in the higher-tier cities. A new measure introduced in late September was the introduction in several major cities of a ban on the resale of homes within two to three years of purchase. Housing price growth has slowed: the average prices of new homes in 70 cities rose by 8.3 per cent in the year to August 2017 – the slowest increase in more than a year.
Since the beginning of the year, the renminbi has strengthened against the US dollar by about 5 per cent, but has remained broadly stable in trade-weighted terms (see figure 8). Foreign exchange reserves, measured in US dollars, have continued to rise, partly on account of valuation changes arising from the general depreciation of the dollar. After eight consecutive monthly increases, reserves stood at $3.11 trillion at the end of September, almost $100 billion higher than at the end of last year but still well below their mid-2014 peak of almost $4.00 trillion. Tighter regulations have stemmed capital outflows over the past two years. Upward pressure on the renminbi led the authorities in early September to ease such restrictions by removing both a reserve requirement imposed in 2015 on forward purchases of foreign exchange and a requirement that banks hold reserves onshore against offshore renminbi deposits.

Figure 8. China: trade-weighted and US dollar exchange rates
India
In each of the past three years, India was the world's fastest growing major economy, and after drawing with China this year it seems likely to regain its leading position in the league table of annual growth rates. Thus the significant slowing of growth in late 2016 and early 2017 is expected to be transitory. Output grew by 5.7 per cent in the year to the second quarter of 2017, the lowest four-quarter growth rate in more than three years and the third consecutive quarter of slowing four-quarter growth. The slowdown can be attributed partly to the lingering effects of disruptions associated with the currency exchange initiative introduced last November and partly to the transition costs of the introduction of a new national General Sales Tax (GST) on 1 July, 2017. We expect the growth-slowing effects of both reforms to be temporary and forecast that growth will strengthen to around 7½ per cent in 2018, before stabilising at about 7 per cent in the medium term.
The GST, despite the teething problems and flaws in its design – with a complicated system of six tax brackets and various exemptions – is likely to prove a significant improvement over the previous, notoriously complicated system of state-based sales taxes, and to provide a significant revenue boost as the scope for tax evasion is reduced. The finance minister has claimed that initial government revenue targets were met, and that further increases in revenue can be expected once problems with the online platform are solved.
The currency exchange initiative was also aimed partly at reducing tax evasion, and the number of tax returns submitted increased by 25 per cent in the fiscal year ending March 2017, compared to the previous fiscal year. However, in September, the Reserve Bank Annual Report stated that 99 per cent of the high-value notes demonetised had returned to it through the formal banking system, implying that the programme had not had the intended consequence of purging corrupt officials and businessmen of their illicit cash.
Apart from the transitory costs of these two initiatives, growth has continued to be constrained by the slow growth of investment, which has continued to be hampered by weaknesses in the banking system. In late October, the government announced a plan to recapitalise state banks over two years, partly through the issuance to the banks of recapitalisation bonds, partly through divestment of public stakes, and partly through budgetary support. The capital infusion is aimed at repairing state banks' balance sheets, thereby facilitating a recovery in both loans and private investment. Whether the scale of the plan is adequate remains to be seen.
Consumer price inflation, on a 12-month basis, was 3.3 per cent in September, unchanged from August's 5-month high, and within the 2 percentage points tolerance limits of the Reserve Bank's 4 per cent target. The Reserve Bank cut its key rate by 25 basis points to 6 per cent in August, in line with market expectations, leaving the benchmark rate at its lowest level since 2010. It stated that its decision represented a neutral stance of policy consistent with achieving its inflation target in the medium term, while supporting growth. We expect inflation to rise above the target to almost 5 per cent in 2018.
Brazil
The economic recovery that began early this year following the severe recession of 2014–16 is continuing at a modest pace, in the wake of substantial declines in inflation and interest rates since last year and in the context of persistent political uncertainty related to corruption allegations.
After an unexpectedly vigorous 1.0 per cent increase in the first quarter of 2017, GDP grew by only 0.2 per cent in the second quarter, to a level 0.3 per cent higher than a year earlier. More recent indicators suggest that expansion continued in the third quarter: industrial production in August was 4.0 per cent higher than a year earlier, and recent manufacturing PMIs point to continued modest growth. For 2017 as a whole, we forecast economic growth of 0.5 per cent, strengthening slowly to around 1 per cent in 2018 and just below 2 per cent in 2019.
Exports have made a significant contribution to the recovery of GDP growth while domestic demand has improved only slowly. During the recession of 2014–16, the compression of imports led to a gradual reduction in the current account deficit (figure 9). Since the beginning of this year, however, it is export growth that has improved the current account balance. Inward foreign direct investment has also increased. We expect the current account to be close to balance in 2017, for the first time in ten years.

Figure 9. Brazil: current account balance
Unemployment remains high: it was 12.6 per cent in August 2017, down from its historic peak of 13.7 per cent in March. High joblessness has been a factor contributing to weak consumer spending. Consumers have, however, benefited from growth in real wages − 3 per cent in the year to July – boosted by a sharp decline in consumer price inflation since early 2016 to the lowest rates in two decades. Consumer prices increased by 2.5 per cent in the year to September, below the Central Bank's target range of 3–6 per cent. The Central Bank reduced its benchmark ‘selic’ rate in early September by a further 100 basis points to 8.25 per cent, 6 percentage points below the rate that prevailed between July 2015 and October 2016. Looking ahead, the Central Bank indicated that it expected a ‘moderate reduction of the pace of easing’ and a gradual ending of the easing cycle. Despite the cap on real-term public spending imposed last year, the government's budget deficit was 9 per cent of GDP in the year to August, unchanged from 2016. With the government's plans for reforms of the pension system stalled in the legislature, it announced in August that it would begin a drive to privatise various state assets in order to raise revenue to improve the fiscal balance and boost infrastructure investment.
The announcement of the privatisation programme, together with actual and prospective declines in interest rates, has outweighed negative political news in boosting financial markets. Since late July, the stock market has risen by close to 20 per cent, while the exchange value of the real in terms of the US dollar has been broadly stable. Nevertheless, political risks remain high. The reforms implemented and planned by the government may be expected to enhance growth with a lag, but there are likely to be short-term costs such as a rise in income inequality. With elections scheduled for October 2018, the window of opportunity for additional reforms is closing while corruption scandals continue to hinder political decision-making.
Russia
The economic recovery that began in late 2016, following the recession of the previous two years, seems to have maintained its moderate momentum. GDP growth in the year to the second quarter of 2017 was 2.5 per cent, and more recent indicators suggest continued moderate growth in the third quarter. Industrial production in September was only 0.9 per cent higher than a year earlier, but PMIs indicate more vigorous growth in the services sector. Unemployment in the third quarter was around 5.0 per cent, down from 5.6 per cent at the beginning of the year and the peak of 6.0 per cent reached early last year.
The resumption of growth has been supported by the partial recovery of global oil prices during 2016 and by the substantial depreciation of the rouble in 2014–15 allowed by the flexible exchange rate policy. These factors will have dissipated to some extent this year as both oil prices and the exchange rate have stabilised. International sanctions remain a factor hindering the recovery. In addition to the EU's sanctions, extended last June to 31 January 2018, President Trump signed into law in early August new US sanctions in retaliation for the Russian government's alleged meddling in the 2016 US elections. Taking into account also the economy's long-established structural problems, we forecast GDP growth of 1.5 per cent in 2017 as a whole followed by around 2 per cent in 2018 and 2019.
Consumer price inflation, on a 12-month basis, fell to 3.0 per cent in September 2017 from 3.3 in August. Having peaked at 16.9 per cent in the year to March 2015, inflation has, since August, been below the Central Bank's target of 4 per cent a year. Following a bumper harvest, food price inflation, on a 12-month basis, slowed from 3.8 per cent in July to 2.6 per cent in August, and this has been a factor behind the recent reduction in inflation. Another factor has been the appreciation of the rouble against the US dollar, by about 5 per cent, since the beginning of this year. Underlying these factors, however, has been the monetary policy of the Central Bank, based on its framework of an inflation target with exchange rate flexibility. The Bank lowered its benchmark rate, for the fourth time this year, in mid-September by 50 basis points to 8.5 per cent. The Governor suggested that the rate may reach a 6.5–7.0 per cent neutral level in 2019. We expect inflation to remain slightly below the target as the economy continues its recovery in 2017–18.
With regard to fiscal policy, President Putin signed a federal law on a new budget rule passed by the Federation Council on 25 July. This is Russia's fourth attempt in the past two decades to formalise budget discipline after the original attempt in 2004–7 was abandoned in the midst of budgetary pressures arising from the global financial crisis. The aim, as previously, is to delink public spending from volatile oil prices so as to reduce fiscal pro-cyclicality and promote economic stability. The new rule consists of three pillars: an expenditure benchmark, a sovereign fund, and public borrowing rules. The expenditure benchmark centres on a fixed (real) oil price of $40 a barrel (in 2017 prices) – instead of a backward-looking price formula under the old rule – and a zero primary balance target at the benchmark price, versus a 1 per cent overall deficit under the old rule. The sovereign fund will handle excess oil revenues in a modified version of current official foreign exchange market intervention, and the public borrowing rules will safeguard the sovereign fund from being used for non-oil budget revenue shortfalls. The new rule is due to come into effect in 2019, when the budget is expected to be close to balance.
The performance of the banking sector has improved over the past year with the economic recovery. However, in September the Central Bank announced that it would nationalise two of the country's largest private banks following runs on deposits. The bailouts highlighted the strains still being suffered by large non-state banks from lower oil prices, sanctions, and the legacy of bad loans from the financial crisis and the recession.
Russia's agreement with OPEC in December 2016 to cut oil output by 300,000 barrels a day in the first half of 2017 appears to have been implemented. In late May, the agreement was extended to the first quarter of 2018, and it is expected to be reviewed following OPEC's ministerial meeting in November.


