

United States
The economy has continued to expand at a moderate underlying pace and the labour market has continued to strengthen. Quarterly GDP growth has remained erratic. After GDP growth of 2.1 per cent, at an annual rate, in the fourth quarter of 2016 – close to its recent trend rate – the expansion slowed to 0.7 per cent in the first quarter of 2017, the slowest quarterly growth in three years. This slowing is accounted for mainly by a marked deceleration of consumer spending and reduced stockbuilding, only partly offset by stronger growth of business fixed investment and a revival of net exports. The weak growth of GDP in the first quarter repeats the typical pattern of recent years, which has raised questions about the seasonal adjustment of the data. It contrasts with recent strong survey data, including PMIs and measures of consumer and business confidence: one measure of consumer confidence in March reached a 16-year high, and one measure of business confidence reached a 13-year high in January. Our forecast for GDP growth is unchanged for this year, at 2.1 per cent, and revised only marginally upwards for 2018, to 2.3 per cent.
With growth thus expected to continue, in July 2017 the economy will enter its ninth year of expansion after the recession of December 2007–June 2009. In March, the expansion became the third longest US expansion since the Civil War, according to the NBER's Business Cycle Dating Committee.Footnote 6
Growth in non-agricultural employment slowed somewhat further in the first quarter of 2017, but unemployment in March reached 4.5 per cent, the lowest since May 2007 and below the Fed's recent ‘central tendency’ range estimate of 4.7–5.0 per cent for the normal, longer-term level of unemployment. This estimate may need to be revised down again slightly in the period ahead if wage inflation remains subdued.
Consumer price inflation has continued to edge up, and has recently been close to the Fed's longer-run objective of 2.0 per cent a year. All-items inflation was 1.8 per cent in the year to March (in terms of the price index for personal consumption expenditures) with the corresponding core rate at 1.6 per cent. Inflation expectations seem to remain reasonably well anchored at rates close to the Fed's medium-term objective: the five-year break-even inflation rate, derived from yields on indexed and non-indexed Treasury securities, has fluctuated between 1.3 and 2.0 per cent over the past year; it was 1.8 per cent in late April.
Wage inflation has also continued to pick up moderately: average hourly earnings rose by 2.7 per cent in the year to March, within the 2.6–2.9 per cent range prevailing since last September. The employment cost index, which provides a broader measure of employee compensation, rose by 2.4 per cent in the year to March 2017. Assuming a trend growth rate of about 1 per cent a year in labour productivity, recent wage inflation still seems somewhat below rates consistent with the Fed's objective for price inflation.
The Fed raised its target range for the federal funds rate by a further 25 basis points, to 0.75–1.00 per cent, in mid-March, but left unchanged its median projections for the rate at the end of this year and 2018. This implies that two further increases of 25 basis points are expected this year, followed by another three next year. With inflation now close to the Fed's medium-term objective, the FOMC stated that it would “carefully monitor actual and expected inflation developments relative to its symmetric inflation goal”. At her subsequent press conference, Chair Yellen clarified that “this seemed an appropriate time to introduce that word (‘symmetric’) into the Committee's statement” after a number of statements where it had been absent, “to remind Americans” that 2 per cent is an objective, not a ceiling, and that “there will be some times when inflation is above 2 per cent”. This is a clear indication that after several years of inflation below its objective, the Fed is now prepared to tolerate some limited excess.
The minutes of the Fed's March meeting recorded that “Provided the economy continues to perform about as expected, most participants … judged that a change in the committee's reinvestment policy would likely be appropriate later this year”. The Fed therefore expects to begin shrinking its balance sheet later this year, following the extraordinary expansion that arose from its large-scale asset purchases during 2008–14.
The new administration has taken a number of steps to implement its deregulation agenda, but prospective fiscal policies and policies on international trade remain unclear (see discussion in the Overview, above).
Box C. US monetary policy and its impact on emerging market economies
The continued strengthening of the US job market, with unemployment recently below the Federal Reserve's range estimate of its longer-run level, and the increase in inflation close to the Fed's longer-run objective of 2 per cent a year, led the Federal Open Market Committee (FOMC) to raise its target range for the federal funds rate by 25 basis points, to 0.75–1.0 per cent, in March 2017. This followed a similar increase last December, the second since the onset of the financial crisis. The FOMC expects two further increases of 25 basis points in the federal funds rate this year – making three in total, unchanged from the FOMC's projections in December 2016.
Changes in the federal funds rate have broad effects on US interest rates and financial markets, and on the exchange value of the US dollar, with the scale and timing of these effects importantly dependent on expectations.Footnote 1 Changes in the federal funds rate can also have significant repercussion beyond US borders, especially given the size of the US economy, the importance of US international trade and financial flows, and the US dollar's role as a global reserve currency. These repercussions occur partly via changes in the dollar's exchange rate. The magnitude of the effects of changes in US monetary policy on other economies varies and is dependent on a combination of factors including: whether a country's currency is tied through its exchange rate arrangement to the US dollar; the scale of dollar-denominated debt owed by the government, corporations and households; the share of US dollar-denominated assets in a country's foreign reserves; and a country's dependence on US foreign direct investment. While other developed economies are certainly affected by US monetary policy, the vulnerability of emerging market and developing economies tends to be greater as they are more exposed through the above factors, including a greater preponderance of US dollar-denominated debt.
The 2016 Annual Report of the Bank for International Settlements (BIS) shows that the US dollar debt of non-bank residents in emerging market economies both in Latin America and in Asia rose between 2010 and 2015. While in Latin America it increased from about 13 per cent of GDP at the end of 2010 to approximately 22 per cent at the end of 2015, in Asia it rose to about 34 per cent of GDP from around 25 per cent over the same period.Footnote 2 The negative impact of dollar appreciation on the balance sheets of dollar borrowers may be mitigated if the borrowers hedge their currency risk, but there is little information on the extent of hedging.
International repercussions of changes in US monetary policy have been evident in recent years. In the 2013 ‘taper tantrum’, fear by markets of an earlier than previously expected withdrawal of monetary stimulus through reduced asset purchases by the Fed led to significant depreciations of a number of emerging market currencies against the US dollar. Subsequent increases in the federal funds rate since December 2015 have contributed to a general shift in interest differentials in favour of US dollar-denominated assets.
Since 2008, the unprecedentedly low yields on US and European bonds encouraged investors to invest in higher yielding emerging market stocks and bonds, leading to a significant increase in capital flows to those countries. An actual or expected increase in US interest rates may reverse this trend, as investors move capital back to the US, with capital outflows from emerging markets potentially damaging their economic prospects. The ‘taper tantrum’ in 2013 caused equity prices to fall in many emerging economies (see figure C1); following the increases in the fed fund rate at the end of 2015 and 2016 they were substantial but noticeably less.
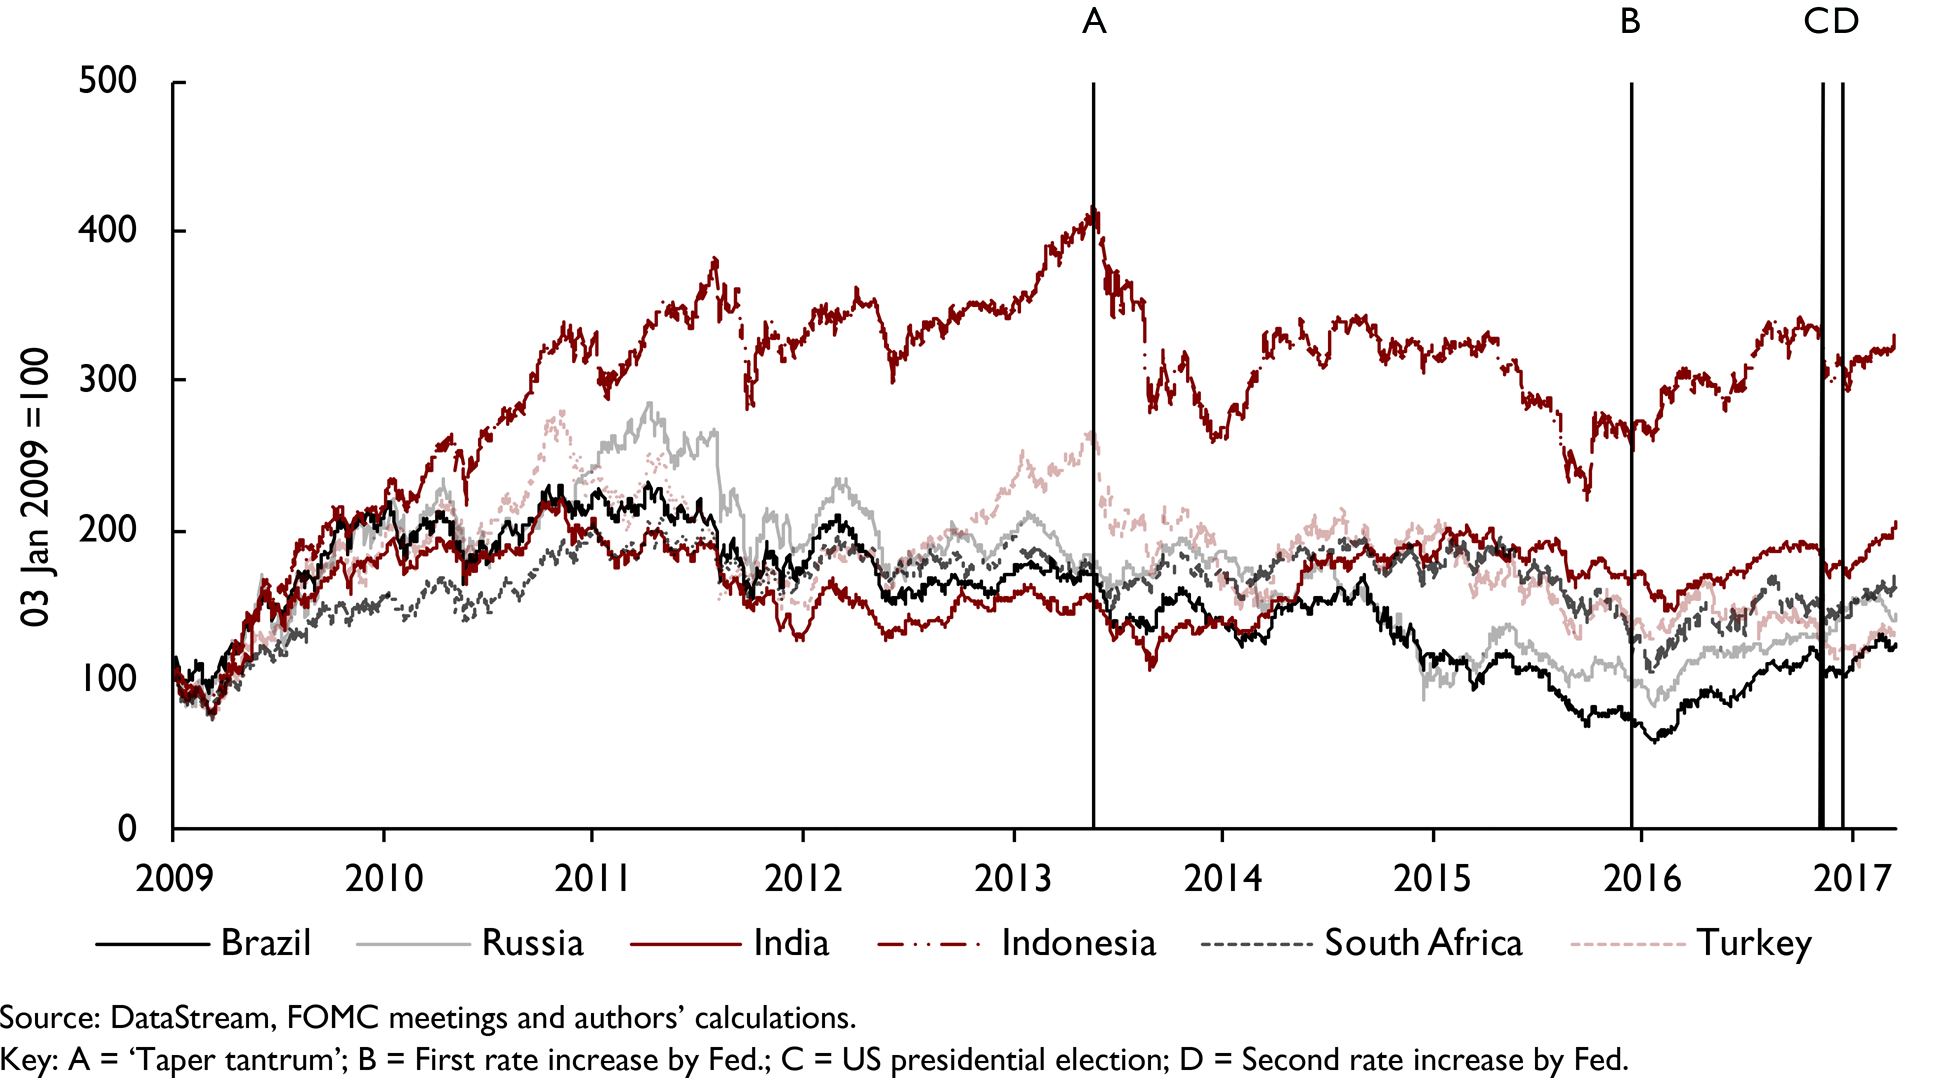
Figure C1. Equity price indexes for selected developing economies (in US$)
The impact on an emerging market economy of an increase in US interest rates will depend not only on the currency denomination of its foreign assets and liabilities but also on its dependence on short-term foreign financing, which depends on its external current account balance and the scale of its net longer-term capital inflows. The emerging market economies that suffer the largest impacts from a rise in US interest rates will tend to be those running large current account deficits (see figure C2) not substantially financed by long-term capital inflows. Reliance on short-term rather than long-term foreign financing increases vulnerability to sudden interest rate and exchange rate fluctuations.

Figure C2. Current account to GDP ratio for selected developing economies
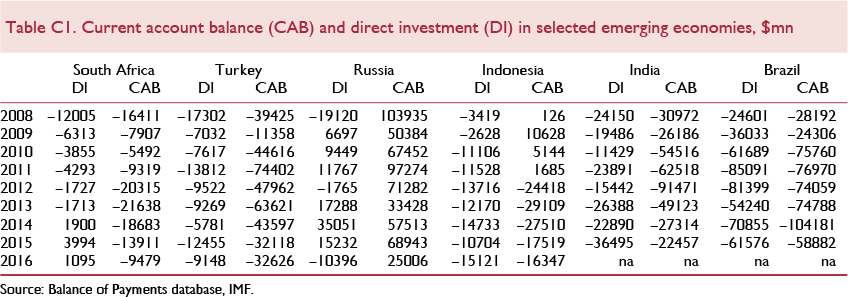
Table C1 below lists current account balances and net direct investment for selected emerging economies. The gap between the two measures can be interpreted as a proxy for the economy's reliance on short term funding of the current account deficit – the larger the gap, the greater is the need for short term financing. It can be seen that, in the past several years, among the economies presented in the table, the largest current account deficits were observed in Turkey and South Africa, with the share of direct investment in Turkey's current account deficit being only about a third. Russia is the only economy in the sample that has been running current account surpluses consistently throughout the sample period, with outward direct investment exceeding inward direct investment in most years. However, irrespective of the heterogeneity among the emerging market economies, most of them became more globally integrated over the past decade (both through financial and economic linkages) leading to a probable larger spillover impact to the advanced economies from possible effect from changes in US monetary policy on the emerging markets.
Notes
1 The Fed's announcement in March 2017, for example, had been widely anticipated, except that markets seem to have incorrectly expected the FOMC to steepen the path of expected future increases, so that market interest rates in the US eased slightly in the wake of the announcement and the dollar weakened slightly.
2 86th Annual Report, BIS, June 2016, Graph 3.7, p.57.
The President presented his ‘budget blueprint’ proposals on discretionary spending to Congress on 16 March. They involve significant increases in spending on defence and homeland security, with offsetting cuts in other discretionary spending programmes. An outline of proposed tax cuts followed on 26 April. More comprehensive budget proposals are expected from the administration by the end of May, possibly including further tax reforms and plans for increased infrastructure spending. Policies on government spending and taxes beyond the current fiscal year will require Congressional approval and it seems unlikely that they will be enacted before the final quarter of 2017. No significant economic impact of new fiscal policies is therefore likely until next year, and the full effects will take longer to come through. Our forecast is based, as usual, on the assumption of currently established policies, and thus makes no assumption about possible fiscal changes.
One of the main objectives of President Trump's proposed fiscal policy changes and deregulatory reforms is to raise the growth rate of the US economy. It seems that his fiscal plans may presume success in achieving this objective by incorporating an assumption of a higher GDP growth rate, of 3 per cent a year or higher, than the recent trend rate of about 2 per cent. The recent trend rate has been roughly composed of 1 per cent employment growth and 1 per cent growth of labour productivity. Given that the economy is close to full employment, policies can raise output growth significantly and in a sustained way only by boosting either the growth rate of the labour force or the growth rate of labour productivity. Both of these have slowed in recent decades (figure 3). With immigration becoming subject to increased restrictions, faster growth of the labour force would have to rely on significant increases in fertility or labour force participation, which seem unlikely. Faster growth of labour productivity is one of the most important objectives of economic policy, but also among the most elusive. Significantly faster economic growth thus seems a dangerous assumption on which to base fiscal policy.
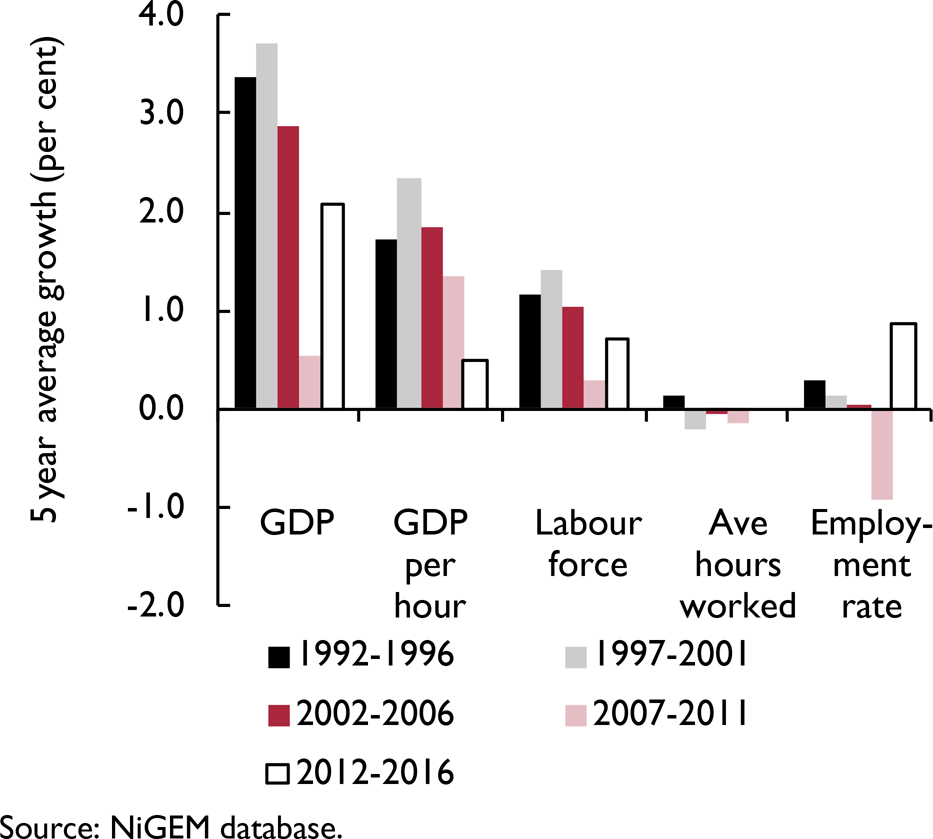
Figure 3. US GDP growth decomposition
With regard to the measures already implemented by executive action, particularly deregulation in some areas and increased restrictions on immigration, we currently assume that they will have no significant effect on demand or potential output. The deregulation measures may boost both domestic demand and potential output, while the restrictions on immigration may reduce both. Such effects, like the effects of changes in fiscal policy and trade policy not yet determined, present risks to our forecast.
To consider the possible effects of a potential protectionist turn in US trade policies, we used the National Institute's Global Econometric Model (NiGEM)Footnote 7 to run stylised scenarios to investigate the impact of 20 per cent permanent increases in tariffs on US imports.Footnote 8 Tariff increases are assumed to be applied by the US on imports from China, Canada and Mexico, which are its largest trading partners, and we also assume retaliation in the form of increases in tariffs on these countries' imports from the US. The simulation indicates that the effects on US macroeconomic variables would include a sustained reduction in GDP (averaging about 2.2 per cent over five years), and a real appreciation of the US dollar, together with a temporary widening of the US external current account deficit and increase in inflation (average of about 0.7 percentage point over five years) as illustrated in figure 4. Reductions in domestic demand in the four economies, coupled with reduced trade, leaves world GDP permanently lower, by about 1.2 per cent, while rising prices of both imports and exports result in a temporary jump in world inflation, of about 0.9 percentage point, but permanently higher prices. These results are, of course, based on particular assumptions, including those embedded in our macroeconomic model.
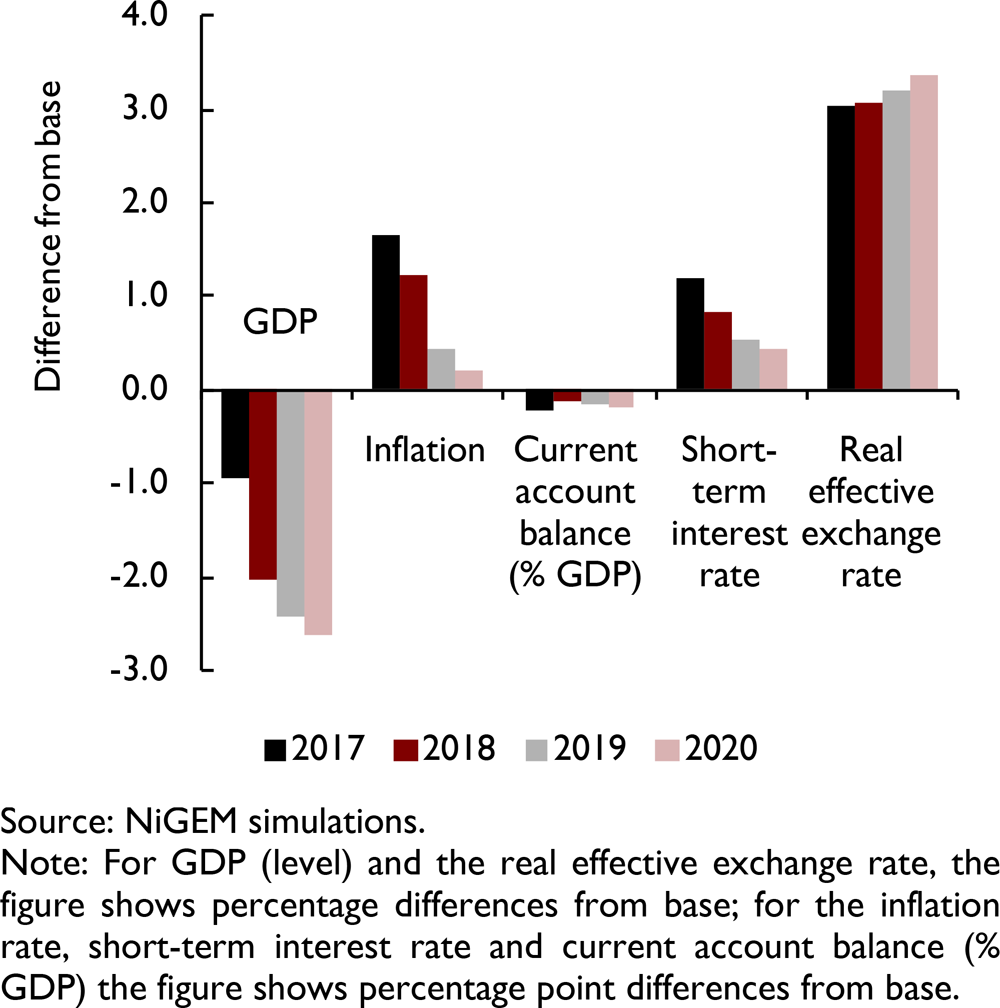
Figure 4. Impact on selected US macroeconomic variables of tariff increases by the US and its three main trading partners
Canada
Economic growth has continued its recovery after the slump in oil prices that reached its trough in early 2016. GDP growth slowed to 0.6 per cent in the final quarter of 2016 from 0.9 per cent in the previous quarter, but preliminary indications are that in the first quarter of 2017 growth recovered to about its third-quarter rate, which is well above trend. In the fourth quarter, output was supported by a contraction in import volumes of 3.5 per cent after a large one-off import of oil-sector equipment in the third quarter, and also reflecting a fall in imports of energy products related to the recovery of domestic oil production following last May's wildfires. Investment remained weak, with business fixed investment falling by 2.1 per cent, the ninth consecutive quarterly decline. In the first quarter of 2017, activity was boosted by resumption of growth in investment in the energy sector and by strong consumer spending and residential investment. We forecast output to grow by 2.5 per cent in 2017 and 2.3 per cent in 2018.
Unemployment declined to 6.6 per cent in February 2017 from a peak of 7.3 per cent reached a year earlier, but picked up to 6.7 per cent in March. In our forecast, unemployment remains broadly stable around recent levels, with averages of 6.6 per cent in both 2017 and 2018, indicating continuing economic slack.
Consumer price inflation, on a 12-month basis, reached a two-year high of 2.1 per cent in January, before falling back to 2.0 per cent in February and 1.6 per cent in March. The continuing effects of lower oil prices have helped to bring inflation back below the Bank of Canada's 2 per cent target, but all of the Bank's measures of core inflation were also below 2 per cent in the year to March, some as low as 1.2–1.3 per cent. Key policy interest rates were left unchanged in April, in line with market expectations, and monetary policy is expected to remain accommodative this year. We expect inflation to average 1.8 per cent both this year and in 2018.
Fiscal policy is expected to support growth this year and next. The 2017 federal budget projects a higher deficit of CAD$28.6 billion for the current fiscal year, with deficits subsequently declining steadily through 2021. It includes CAD$5.2 billion worth of measures designed to help Canadians adapt to a diversifying economy through education and training.
The Comprehensive Economic and Trade Agreement (CETA), a free trade agreement that removes 98 per cent of tariffs between Canada and the EU, was approved by the European parliament in February. The Canadian government estimates that this will boost trade between Canada and the EU by 20 per cent, and raise Canadian GDP by up to 2½ per cent per year.
Uncertainties relating to the trade policies of the new US administration, including the prospective renegotiation of the NAFTA, represent a significant downside risk to our growth forecast. Concerns about the Canada/US trade relationship, as well as unexpectedly low domestic inflation and weaker global oil prices seem to have contributed to the depreciation of the Canadian dollar against other major currencies in recent months.
Euro Area
Economic growth gathered pace in the course of 2016 reaching an annual rate of about 2 per cent in the fourth quarter. Growth has been sufficient to bring further significant declines in unemployment, though joblessness remains high overall and very uneven among member countries. Annual headline consumer price inflation has recently risen closer to the ECB's target of ‘below, but close to, 2 per cent’, but this is mainly due to the partial recovery of energy prices; core inflation remains well below 2 per cent although it jumped above 1 per cent in April, and wage increases have remained subdued. At its March meeting, the ECB left its policy parameters unchanged but adjusted its forward guidance to indicate that the risk of deflation had disappeared.
Box D. European bond yields – political risk
Recent political turmoil in France and Italy has led to falling government bond prices in these countries as investor confidence has waned. The premia that investors are demanding in order to hold French and Italian debt can be measured by the spread between their respective sovereign bond yields and the benchmark German Bund. As can be seen in figure D1, these premia have been rising throughout 2016 and early 2017. Investors have been flocking towards the safe haven provided by German sovereign bonds. German 10-year bund yields dipped into negative territory briefly in June 2016, before turning negative again for a more prolonged period in the aftermath of the UK's referendum on EU membership.

Figure D1. Spreads relative to German Bunds
Another measure of investor confidence is the term premium, i.e. the yield investors require to hold long-term bonds as opposed to a series of short-term bonds. This reflects the risk associated with investors' short-term interest rate forecasts, which rises when uncertainty picks up. As we can see from figure D2, the term premium in Italy has been elevated relative to that in other European countries since 2010, while French and Belgian term premia have recently diverged from those in Germany and the UK.

Figure D2. Term premia
Ten-year yields in many European countries fell following the UK's referendum, reflecting investors' desire to hold less risky assets. Somewhat counterintuitively, government bond yields also fell in the UK which can be explained by investors seeking to reduce risk while keeping their assets denominated in sterling.
Rising French sovereign bond yields reflect fears over the potential election victory of the far right National Front candidate Marine Le Pen, who has pledged to take France out of the euro. On 21 February, the difference between French 10-year sovereign bonds and the German Bund rose to their highest level since 2012 following François Fillon's announcement that he would not withdraw his candidacy, sparking fears that this would boost support for Le Pen. French 10-year bond yields dropped by 11 basis points the day after centrist Emmanuel Macron received the largest share of the votes in the first round of the election, making him the favourite to win the presidential election on 7 May.
Italian bond yields have increased as the split in the ruling Democratic party has deepened following former Premier Matteo Renzi's resignation in the wake of his defeat in the referendum over constitutional reform, triggering a leadership election which was scheduled for 30 April. The spread between Italian and German 10-year sovereign bond yields reached 212 basis points on 13 April, the highest level since February 2014. Movements in Italian (and German) bond yields after 30 April will depend on investors' view of the new Democratic party leader.
This box was prepared by Rebecca Piggott.
GDP grew by 0.5 per cent in the fourth quarter of last year − 0.1 percentage point higher than the third quarter – to a level 1.8 per cent higher than a year earlier. There was a broad expansion of domestic demand in the fourth quarter, but a small decline in net exports. Growth seems to have become somewhat more evenly spread among member countries in the fourth quarter, although output in Greece fell back by 1.2 per cent. Some more recent indicators, especially survey data, suggest that activity in the Area may have accelerated in early 2017: thus for March, both the composite PMI and the European Commission's economic sentiment indicator were the highest in more than five years. Recent data for industrial production and retail sales, however, have shown no clear acceleration. We forecast GDP growth of 1.6 per cent in 2017 as a whole and 1.7 per cent in 2018, revised slightly upwards in both cases since February.
Unemployment fell to 9.5 per cent in February and March, its lowest level since April 2009. This is 2.6 percentage points below the peak reached in March 2013 and 2.2 percentage points above the March 2008 trough. Unemployment rates remain extremely uneven, ranging in March from 3.9 per cent in Germany to 10.1 per cent in France, 11.7 per cent in Italy, 18.2 per cent in Spain, and 23.5 per cent in Greece. Employment in the Area grew by 1.1 per cent in the year to the fourth quarter of 2016, implying labour productivity growth (in terms of GDP per head) of 0.7 per cent in this period.
Consumer price inflation, on a 12-month basis, increased over the past year towards the ECB's medium-term objective of ‘below, but close to, 2 per cent’, reaching 1.9 per cent in April 2017, according to Eurostat's ‘flash’ estimate, up from −0.2 per cent in April 2016. This increase mainly reflects the rise in global energy prices. However, 12-month core inflation, having been stable, in the 0.7–0.9 per cent range, for several months, jumped in April to 1.2 per cent, apparently on account of an increase in inflation in the services sector. This is still well below the ECB's inflation objective; it remains to be seen whether it is the harbinger of a more substantial rise in underlying inflation. There has been no clear sign of any acceleration in wages: in the fourth quarter of 2016, they were 1.6 per cent higher than a year earlier – an increase slightly smaller than that in the year to the fourth quarter of 2015. In Germany, where unemployment is low, there has been some sign of a moderate pick-up in wage growth, to 2.9 per cent in the year to the fourth quarter of 2016 from 2.5 per cent in the preceding year.
At its March policy meeting, the ECB kept its policy rates unchanged and maintained its forward guidance that it expected rates “to remain at present or lower levels for an extended period of time, and well past the horizon of our net asset purchases”. It also confirmed its previously announced asset purchase programme, with net purchases of €80 billion in March 2017 followed by net purchases of €60 billion a month until the end of 2017 “or beyond, if necessary, and in any case until the Governing Council sees a sustained adjustment in the path of inflation consistent with its inflation aim”. The only change from the ECB's previous forward guidance was the deletion of the statement that, “If warranted to achieve its objective, the Governing Council will act by using all the instruments available within its mandate”. President Draghi indicated that this deletion signified that there was no longer a sense of urgency prompted by a risk of deflation.
Germany
GDP grew by 0.4 per cent in the final quarter of 2016, broadly in line with its recent trend, to a level 1.8 per cent higher than a year earlier. In the fourth quarter, robust consumer spending, combined with strong growth in fixed investment and government consumption, was partly offset by a decline in net exports. More recently, survey measures of economic activity and business confidence, including PMIs and the Ifo business climate index, reached six-year highs in March. However, hard data on activity paint a more mixed picture. Thus industrial production has been erratic; in February 2017 it was 1.6 per cent higher than a year earlier. We project output to grow by 1.7 per cent in 2017 and 1.6 per cent in 2018.
Consumer price inflation rose to 2.2 per cent in the year to February 2017, a 4½ year high, but fell back to 1.5 per cent in the year to March. Concerns over rising inflation appear to have dampened consumer confidence, with the GfK consumer climate indicator falling in April to its lowest level in five months. Our forecast is for inflation of 1.7 per cent this year and 1.3 per cent in 2018.
Unemployment fell to a 36-year low of 3.9 per cent in November 2016 and remained at this level through March. Wage increases, 2.9 per cent in the year to the fourth quarter of 2016 on Eurostat data, have continued to exceed the Euro Area average, which was 1.6 per cent in the same period, but there has been little sign of any recent pick-up in wage increases despite the low unemployment rate. In real terms, wages rose just 1.1 per cent in the year to the final quarter of 2016. However, indices of agreed earnings indicate a modest acceleration in February and March this year. We expect unemployment to remain close to its recent levels, at 3.8 per cent on average in 2017 and 3.9 per cent in 2018.
A record annual trade surplus of €253bn was reached in 2016, with the current account surplus at an all-time high of 8.3 per cent of GDP. The surplus is projected to narrow to 7.2 per cent of GDP this year and 6.3 per cent of GDP in 2018.
The largest fiscal surplus since reunification, €23.7bn in 2016 (0.8 per cent of GDP), has prompted calls for tax cuts and higher public spending. A five-year budget plan announced in mid-March included no expansionary fiscal measures. Ahead of the federal elections due in September, the incumbent CDU party has promised tax cuts while the rival SD party plans to increase spending on training, education and investment.
France
GDP growth picked up to 0.4 per cent in the fourth quarter of 2016, reaching the Euro Area average, from 0.2 per cent in the third quarter. The pick-up in growth in the fourth quarter was driven mainly by a rebound in consumer spending, which grew by 0.6 per cent after 0.1 per cent growth in the third quarter. But there were also upturns in business fixed investment and net exports, with partly offsetting downturns in government investment and inventory accumulation. Reflecting the cold winter, energy consumption increased by 3.7 per cent in the fourth quarter. More recent indicators, including strong PMIs and indicators of consumer confidence, suggest continued moderate growth in the first quarter. With INSEE's consumer confidence indicator in March 2017 at its highest level for more than nine years, we expect household consumption to continue to be the main driver of growth in the coming quarters, even though real wage gains are likely to be slowed by somewhat faster price inflation.
Consumer price inflation, which was marginally negative in the year to March 2016, increased to 1.4 per cent in the twelve months to March 2017, mainly as a result of increases in energy and fresh food prices. Core inflation has remained subdued, at 0.4 per cent in the year to March. In the absence of any sudden spike in energy prices, we expect inflation to stay well below 2 per cent throughout 2017.
Progress in reducing unemployment has stalled. The unemployment rate in March was 10.1 per cent, no different from a year earlier and much closer to the peak of 10.6 per cent reached in May 2015 than to the early 2008 pre-crisis low of 7.2 per cent. With output growth projected at 1.2 per cent this year and 1.4 per cent in 2018, it seems unlikely that unemployment will be lowered substantially in the period ahead without a change in policies. Despite unemployment somewhat above the Euro Area average, wage growth, at 1.5 per cent in the year to the fourth quarter of 2016, has remained close to the average for the Area as a whole, which was 1.6 per cent in the same period. However, this is significantly higher than in Italy (0.1 per cent), where unemployment is higher, but lower than in Germany (2.9 per cent), which is close to full employment.
The external current account deficit widened from 0.2 per cent of GDP in 2015 to 0.9 per cent in 2016. Particularly noticeable was a further decline of the surplus in services; this downward trend started in 2012 and the surplus nearly reached zero in 2016 (figure 6).

Figure 5. Real consumer wages in selected Euro Area economies
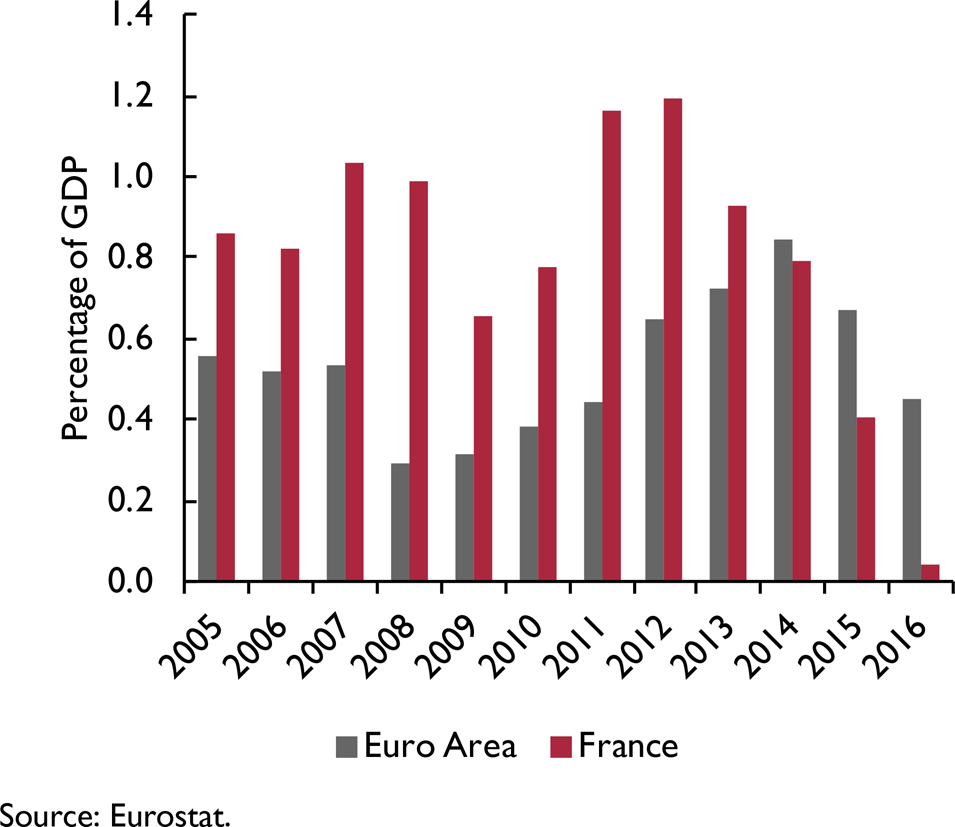
Figure 6. France: trade balance in services
The programme of fiscal consolidation is essentially on hold this year, reflecting the presidential and assembly elections. The path of future fiscal policy will become clearer after the second round of the presidential election in early May and the elections for the National Assembly in June. Of the two candidates in the second round of the presidential election, Ms Le Pen has proposed a programme of fiscal expansion, with increased spending and reduced taxation, while Mr Macron has proposed reductions in both public spending and taxes. Both fiscal programmes would provide support for demand and activity initially because in the Macron programme tax cuts would precede reductions in public spending.
Italy
Italy's tepid economic recovery continued in the fourth quarter of 2016 with growth of 0.2 per cent, raising GDP to a level 1.0 per cent higher than a year earlier. Gross fixed investment and government consumption were the main engines of growth in the fourth quarter, partly offset by a decline in stockbuilding; private consumption and net exports were virtually flat. Estimates by the Bank of Italy suggest that output expanded at the same rate, 0.2 per cent, in the first quarter of 2017, and indicators suggest that modest growth will continue in the remainder of this year. Indicators of economic sentiment have improved slightly relative to last year, and wage moderation, together with strengthening growth in Italy's main trading partners, is expected to boost exports. However, unemployment remains elevated and concerns regarding the banking sector persist. We forecast output growth of 1.0 and 1.1 per cent this year and next, respectively.
The decline in unemployment from its 13.0 per cent peak in late 2014 went into reverse late last year, with an increase from 11.5 to 11.8 per cent between May and December. This rise was partially reversed in the first three months of this year, with unemployment falling back to 11.7 per cent in March. The fact that unemployment is still so high – more than double the pre-crisis 2006 low of 5.7 per cent – is a cause of considerable concern, although it is accounted for partly by an increase in labour force participation, which has offset growth in employment (which was 1.3 per cent in the twelve months to February 2017). The slack in the labour market has been reflected in stagnant wages; in the year to the fourth quarter of 2016 they increased by only 0.1 per cent, well below the Euro Area average of 1.6 per cent. Recent contractual agreements, some of which have included indexation to low core price inflation suggest that the moderation in wages will continue this year.
Consumer price inflation has risen sharply over the past year, to 1.4 per cent in the year to March 2017 from −0.2 per cent in the year to March 2016, mainly owing to the partial recovery of global oil prices. Core inflation remained at 0.5 per cent in the year to March 2017, suggesting that the spike in inflation is likely to be transient and that underlying inflationary pressures are weak, reflecting stagnant wages and ample economic slack.
Problems in the banking sector have continued to weigh on the economy. The share of non-performing loans in total bank loans edged up by ¼ percentage point to just above 12½ per cent in March 2017 relative to three months earlier. After Monte dei Paschi di Siena (MPS) failed last December to secure a €5 billion injection of private capital, the government prepared a €20 billion package to recapitalise several weak banks, including MPS. The restructuring plan for MPS is still being discussed by the Italian authorities and the European Commission, and concerns about the viability of several Italian banks remain. UniCredit, the largest Italian bank, recently wrote down a third of its investment in the Atlante fund, the private equity fund promoted by the authorities last year and dedicated to the recapitalisation of other Italian banks.
The government posted a budget deficit of 2.4 per cent of GDP in 2016. The improvement relative to the deficit in the previous year came from a reduction in interest payments as well as an improvement in the primary surplus. The European Commission has set a new target budget deficit ratio of 2.1 per cent of GDP for 2017 in order to ensure that Italy's high debt-to-GDP ratio begins to decline in 2018.
Spain
The relatively strong momentum of economic growth in 2014–16 has begun to moderate. In 2016 as a whole, as in 2015, GDP grew by 3.2 per cent, with four-quarter growth slowing from 3.4 per cent in the first quarter to 3.0 per cent in the fourth. The Bank of Spain estimates that GDP expanded by 0.8 per cent in the first quarter of 2017. Spain's economic recovery has benefitted from various tailwinds including highly accommodative monetary conditions, the easing since 2014 of fiscal consolidation, the decline in oil prices, and a tourism boom apparently related to terrorist incidents and political unrest elsewhere in the Mediterranean region. Spain's international competitiveness has also benefitted from slower growth in labour costs than elsewhere in the Euro Area. As some of these factors dissipate, we expect growth to continue to slow gradually. Accordingly, we forecast output to expand at 2.6 and 2.4 per cent this year and next, respectively.
Both domestic demand and net trade contributed to GDP growth in the fourth quarter of 2016. Within domestic demand, both private consumption and private fixed investment made positive contributions while the contribution of public expenditure was neutral. We expect this pattern to persist as Spain seeks to comply with EU mandates to reduce the government budget deficit. Moderate expansion in demand from Spain's closest trading partners, gains in cost competitiveness, and subdued oil prices suggest that net trade will continue to contribute positively to growth in 2017 and 2018.
Unemployment has declined significantly in recent months, reaching 18.2 per cent in March 2017, 8.1 percentage points below the peak reached in early 2013. However, Spain's unemployment rate is still the second highest in the Euro Area, after Greece, and far above the low of 7.9 per cent reached in mid-2007. High unemployment has been accompanied by a sharp slowdown in the annual growth of wages, from a peak of 6.2 per cent in 2008 to an average of about 0.5 per cent since 2010. In the year to the last quarter of 2016 wages grew by 0.2 per cent, well below the Euro Area average of 1.6 per cent.
Consumer price inflation has risen markedly in recent months, mainly owing to the upturn in oil prices. The 12-month inflation rate, which was −1.0 per cent in March last year, rose to 3.0 per cent in February 2017 before easing to 2.1 per cent in March. Core inflation has remained subdued, at just 0.7 per cent in the year to March. We expect underlying inflationary pressures to remain weak owing to the ample slack in the labour market coupled with subdued wages.
A new government was elected in October 2016, putting an end to a year-long caretaker government. As a result, a new budget was sent to, and approved by, the European Commission with target deficits of 3.1 and 2.2 per cent of GDP for this year and next. Nevertheless, the Commission has warned that on current policies these targets are unlikely to be met.
Japan
The economy grew by 0.3 per cent in the final quarter of 2016, bringing GDP growth in the year as a whole to 1.0 per cent, slightly below the 1.2 per cent growth rate in 2015. Growth in the fourth quarter was driven by both domestic demand and the external sector. On the domestic front, private fixed investment and government consumption both contributed positively, growing at 1.7 and 0.3 per cent respectively, while household consumption was flat, halting the trend of sluggish but consistent growth earlier in the year. Net exports contributed 0.2 percentage point to GDP growth in the fourth quarter, with the growth of export volumes, at 2.6 per cent, double that of import volumes.
Figure 7 illustrates the contributions to GDP growth in each of the years 2014–18 of the major expenditure components, including the forecast years 2017–18. This highlights how, following the April 2014 increase in the consumption tax, the recovery in the private components of domestic demand was extremely slow. In 2015, of these components only stockbuilding contributed positively to GDP growth, while household consumption contracted and private investment was flat. The return to positive growth of both private investment and private consumption in 2016 may suggest the beginnings of a sustainable recovery in final private demand. A moderate strengthening of domestic demand growth forms the core of our GDP forecast, with both consumption and investment expected to help drive growth this year and next, while the external sector is expected to be broadly neutral as domestic demand growth draws in imports. We forecast GDP growth of 0.8 and 0.7 per cent, respectively, in 2017 and 2018.

Figure 7. Japan: contributions to GDP growth
The key risk around these projections is unchanged from the February Review, namely the extent to which the increasingly tight labour market translates into growth in household incomes. Unemployment fell further to 2.8 per cent in March, the lowest level since June 1994, while the ratio of job offers to applicants has remained steady at 1.43 since December 2016, close to its highest level since July 1991. Nevertheless, wage growth has remained weak, with average monthly cash earnings up by just 0.4 per cent in the twelve months to February. Furthermore, the outlook for wage rises in the fiscal year 2017, which began on 1 April, look relatively poor. The Japan Trade Union Confederation reports that the results from the ‘Shunto’ spring wage negotiations indicate increases of around 2.0 and 1.9 per cent, for large and small firms respectively.Footnote 9 Both numbers are in line with results from the past three years, where the outturn for base pay was an average contraction of 0.4 per cent in 2014, followed by growth of 0.3 per cent in each of the next two years.
While wage growth has remained weak, the growth of aggregate labour incomes has risen. Total employee compensation increased by 2.3 per cent on average in 2016, the largest annual increase since 1997. The deviation between the growth rates of aggregate and average wages can be explained partly by the growth of employment, reflecting an increase in the supply of labour. The participation rate increased from around 73 per cent in the 2009 to around 77 per cent in 2016, with increased participation most marked among the female and older demographics.
Alongside this increase in the supply of labour, the increased importance of part-time employees – which now account for one third of the workforce of firms with a staff greater than five, compared with one tenth in the early 1990s – who are in general paid less per hour than their full-time counterparts, may have led to a compression in average earnings. There is evidence though that wages for part-time employees have recently been responding to shortages of labour. The annual increase in average hourly wages for part-time workers was 2.4 per cent in February 2017, having steadily risen from 1.3 per cent at the end of 2015.Footnote 10 Furthermore, since the beginning of 2015, the average growth of cash earnings of part-time workers has been greater than that of full-time workers, at 0.8 per cent compared with a contraction of 0.1 per cent. On the other hand, hours worked by part-time workers have been declining steadily since 2013, which will have added some downward pressure to average part-time earnings. Overall, however, the increase in the total wage bill, even if spread across more workers, is likely to support consumption growth this year and next.
The ‘headline’ rate of consumer price inflation was 0.2 per cent in the year to March – the fifth consecutive month of positive annual inflation after eight months of annual deflation. However, the ‘core-core’ measure of annual inflation, which excludes fresh food and energy, declined in March to −0.1 per cent. The March 2017 Tankan survey indicates that expectations are that inflation will remain well below the Bank of Japan's 2 per cent objective over all time horizons. Five-year ahead inflation expectations in the Tankan survey have been stable at around 1 per cent over the past year, suggesting at the BoJ's attempts at anchoring expectations at the target rate have, thus far, been unsuccessful. Given the 7.5 per cent depreciation of the yen in trade weighted terms since the third quarter of 2016, the moderate rebound in commodity prices, as well as more robust domestic demand, we expect inflation to pick up this year to around 0.6 per cent before easing to 0.5 per cent in 2018.
The BoJ's monetary stance has remained unchanged since last September, with interest rates on part of banks' reserves at −0.1 per cent and asset purchases of about Yen 80 trillion a year regulated to maintain 10-year government bond yields at around zero.
China
The gradual slowing of economic growth that began in 2010 was interrupted in late 2016, with GDP growth from four quarters earlier picking up from 6.7 per cent in the third quarter to 6.8 per cent in the fourth and 6.9 per cent in the first quarter of this year, the highest four-quarter growth rate in 1½ years. Growth in 2016 as a whole, at 6.7 per cent, met the official target of 6.5–7.0 per cent. The new growth target for 2017, announced in March, is “around 6.5 per cent”, with the government indicating that it will “aim to do better in practice”, which suggests that 6.5 per cent is to be considered a lower bound, and that there has been only a marginal change from the growth target for last year. Economic policy management to achieve the target and ensure social stability may be expected in the run-up to the party's 19th National Congress, due to take place in November this year. Given also the recent momentum of growth, we have upgraded our forecast for GDP growth this year marginally to 6.7 per cent. However, the medium- to long-term challenges facing the economy remain substantial.
The fiscal deficit target for 2017 is set at 3.0 per cent of GDP; last year it was 3.8 per cent of GDP. The new budget puts increased emphasis on reductions in taxes and fees, aimed at supporting private business investment. Outside the government's general budget, there is a planned increase in the issuance of local government bonds from Rmb 400 billion in 2016 (0.6 per cent of GDP) to Rmb 800 billion (1.1 per cent of GDP) in 2017, intended to support infrastructure investment.
There is little indication of any acceleration in the speed of structural reforms, and progress has remained uneven. There has been significant advance in recent years in shifting resources to services from industry and in liberalising financial markets, but less success in moderating credit growth, improving corporate governance, and hardening the budget constraints facing state-owned enterprises. Thus vulnerabilities remain in a number of areas. At the conclusion of the National People's Congress in March, the government emphasised the need to control financial risks, including risks relating to banks' non-performing assets, shadow banking, and the high leverage of non-financial firms, and also promised to act “to contain excessive home price rises in hot markets”. Another priority task is reducing industrial overcapacity.
Double-digit credit growth (measured in terms of either broad money or total social financing), outstripping output growth (figure 8), has continued, but the annual rate of growth decreased marginally in February and March. This slowing may reflect actions taken by the People's Bank of China (PBoC) since last December to tighten liquidity and guide interest rates higher in the money market, while leaving its benchmark rates unchanged. It seems that the PBoC's aim has been primarily to affect the price of loans between banks, and thereby to dampen activity in the bond market, and to reduce associated financial risks. Credit growth has been on a slightly declining trend since the beginning of 2016 and seems likely to continue to slow given the government's emphasis on financial stability and deleveraging.

Figure 8. China: money supply (M2) to GDP ratio
Rapid housing price inflation in several cities has remained an important issue despite successive measures introduced in recent months by large cities to restrict lending and demand. Prices of new houses (based on a composite index for 70 large and medium- size cities) were 11.3 per cent higher in March than a year earlier, not much lower than the recent high of 12.6 per cent reached in November last year.
Recent increases in housing prices have contributed to a recent upturn in the non-food component of consumer price inflation, but this has been outweighed by a downturn in food price inflation, which turned negative in the year to February. Overall, on a 12-month basis, consumer price inflation in March was 0.9 per cent, well below the official 3 per cent target for 2017. By contrast, 12-month producer price inflation has risen markedly, from around −6 per cent in late 2015 to a recent peak of 7.8 per cent in February 2017 and 7.6 per cent in March. Looking ahead, consumer price inflation is expected to remain comparatively low in 2017 but to pick up next year.
After a period of depreciation contained by official intervention in the foreign exchange and an associated decline of China's foreign exchange reserves, the renminbi has been notably stable against the US dollar since late 2016 (figure 10). With China's foreign exchange reserves also having stabilised, at close to $3 trillion (compared with the peak close to $4 trillion in mid–2015), the explanation for the more stable exchange rate does not seem to be increased intervention. It may lie more in increased capital controls imposed by the authorities over the past year and partly in the recent tightening of monetary conditions by the PBoC. In any event, the stabilisation of the renminbi may have helped to reduce the attention paid to the currency by the US administration (see Overview above).

Figure 9. China: inflation

Figure 10. China: trade-weighted and US dollar exchange rates
India
Despite last November's move to demonetise notes representing more than 80 per cent of the rupees in circulation, the economy maintained its robust growth performance in the final quarter of last year, with GDP 7.0 per cent higher than a year earlier. Domestic demand was the driver of growth in this period, with household consumption growing by 10 per cent and government consumption by 20 per cent. Private investment was subdued, expanding by only 3.5 per cent owing to weakness in the first quarter of last year. Net exports subtracted from GDP in the year to the fourth quarter with the growth of import volumes outpacing that of exports.
The GDP outturn for the fourth quarter of last year was surprisingly strong given the chaos reported to have been associated with the demonetisation and the impact that it seemed likely to have had on such a cash-dependent economy. This is especially true of the apparently robust private consumption growth, which seems at odds with various high-frequency data as well as anecdotal evidence. One of the explanations for the higher than expected GDP estimate for the fourth quarter may be a lack of timely data for the informal economy, which is where the worst of the adverse effects of the demonetisation would be expected to have occurred. As data for the informal sector are collected and incorporated over time, GDP may be revised downwards. Nonetheless, the stronger than expected estimate currently available has led us to revise our growth forecast up to 7.3 per cent for this year and 7.8 per cent for 2018.
The headline rate of 12-month consumer price inflation rose to 3.8 per cent in March 2017 from 3.2 per cent in January, which was the lowest inflation rate in the five-year history of the CPI series. Inflation is thus now close to the Reserve Bank's target of 4 per cent; it has been within the tolerance limits of 2 and 6 per cent since last August. The Reserve Bank's benchmark interest rate has been held at 6.25 per cent since last October. The recent appreciation of the rupee – by about 5.5 per cent against the US dollar since late January – will weigh on inlation in the period ahead, helping to offset the influences of the recent recovery of global commodity prices and strong domestic demand. On balance we expect inflation to increase moderately this year and next, averaging 3.5 in 2017 as a whole and 5.6 in 2018.
In late March, parliament passed legislation authorising the introduction of the long-awaited nationwide goods and services tax, which the government is aiming to implement in July. The tax will replace at least fifteen different tax codes at central and state levels, and the associated efficiency gains are expected by some analysts to boost national output by as much as 2 per cent. The tax features four different rates and the allocation of items to the bands has yet to be agreed, leading some to question whether the targeted implementation date of 1 July may be over-ambitious.
Brazil
Brazil's recession intensified in the last quarter of 2016 with a 0.9 per cent contraction of GDP, the eighth consecutive quarterly drop. Output in 2016 as a whole fell by 3.6 per cent, only slightly smaller than the decline in 2015. More recent data indicate that activity has begun to stabilise, and the economy should come out of recession in the course of this year, although a further fall in GDP seems likely in the year as a whole. Industrial production in February was only 0.8 per cent lower than a year earlier, and the manufacturing PMI for March was the highest in two years, although it still indicated contraction. With price inflation down markedly, real wages have begun to recover; in February they were 1.4 per cent higher than a year earlier. Indicators of economic sentiment are higher than a year ago, and both the exchange value of the real and the stock market have recently been buoyant. In late March, the Central Bank lowered its forecast of GDP growth in 2017 to 0.5 per cent, but this still appears somewhat optimistic. We forecast a further contraction of output in 2017, of 1.4 per cent, and resumption of growth in 2018, at the rate of 1.0 per cent.
Underlying the decline in output in the final quarter of 2016 were contractions of all major components of domestic demand except public expenditure, together with a negative contribution from net trade. Data for the balance of trade in goods up to February 2017 suggest a turnaround in trade's contribution to GDP growth in the first quarter. Private consumption, though supported recently by rising real wages, is continuing to be weighed down by high unemployment and tight fiscal policy. Unemployment rose sharply further in the first two months of this year, from 12.0 per cent last December to a record high of 13.2 per cent in February, more than double the low of 6.5 per cent that prevailed in late 2014.
Consumer price inflation, on a 12-month basis, declined to 4.6 per cent in March 2017, a seven-year low, almost matching the Central Bank's target of 4.5 per cent, and sharply lower than the peak of 10.7 per cent reached in January 2016. Following three cuts, amounting to 125 basis points, in the fourth quarter of last year, the Central Bank reduced its benchmark ‘selic’ interest rate by 75 basis points in late February and by a further 100 basis points in mid-April, to 11.25 per cent. The success achieved in lowering inflation towards its target, the still high level of interest rates in real terms, the slack in the economy, and the recent decline in ten-year government bond yields to below 10 per cent all point to the scope for further reductions in official rates in the near term.
In the twelve months to February 2017, the government budget deficit was 8.5 per cent of GDP, 0.8 percentage point smaller than in the year ended November 2016. Most of the decline is accounted for by lower interest payments; the primary deficit improved by a mere 0.1 percentage point to 2.3 per cent relative to that in the year to November. Nevertheless, progress is being made in tackling the fiscal deficit, partly by regaining investor confidence. Having achieved, last December, the passage of a law to freeze spending in real terms for 20 years, the government is currently preparing a set of measures to rein in pension costs.
Russia
Although recent indicators have been mixed, economic activity seems to have stabilised in late 2016 after the recession that began in mid-2014. Thus GDP growth in the year to the fourth quarter of 2016 was 0.3 per cent and indications are that positive growth continued at a modest rate in early 2017. The resumption of growth, in spite of continued international sanctions, is attributable mainly to the recovery of global oil prices since early last year, and to the limited rise in unemployment during the recession with nascent real wage growth supporting a recovery in consumer confidence. The prolonged contraction in consumers' non-food spending throughout 2015–16 turned to moderate growth of 0.3 per cent in the year to March. Industrial production rose by 0.8 per cent in the year ended March.
Consumer price inflation, on a 12-month basis, has continued to fall, reaching 4.3 per cent in March 2017, down from the March 2013 peak of 16.9 per cent and the lowest inflation rate since June 2012. Inflation thus seems close to the Central Bank's target of 4 per cent, with our forecast coinciding with this by the end of this year. The decline in inflation has been helped by continued conservative monetary policy and the appreciation of the rouble since early last year, in the wake of the recovery of oil prices. The Central Bank lowered its benchmark rate from 10 to 9.75 per cent in March 2017 and again to 9.25 per cent in late April. It signalled the possibility of further cuts in the remainder of the year whilst noting caution on inflation expectations failing to anchor at 4 per cent. With ten-year government bond yields recently at about 8.1 per cent, market interest rates also suggest expectations of further cuts.
Geo-politically Russia has remained prominent. The unprecedented agreement of December 2016 by Russia and nine other oil producing countries to join OPEC in reducing production in the first half of 2017 – by 300,000 barrels a day in Russia's case – had by late March been only one-third implemented by Russia, according to the International Energy Agency. Renewal of the agreement for the second half of the year is being considered. Between the election and inauguration of President Trump the rouble appreciated by about 8 per cent in terms of the US dollar, but it is unclear whether this was due to expectations of improved US-Russia relations and an easing of sanctions, or the significant rise in oil prices that occurred during this period. Since the inauguration, the rouble has appreciated somewhat further even though oil prices have weakened somewhat and prospects of an improvement in Russia's relations with the US seem to have diminished. Rising confidence in economic recovery in Russia may be part of the explanation. Overall, our forecast sees recovery showing through in 2017 with GDP growth of 0.5 per cent in the year as a whole, followed by growth of 1.3 per cent in 2018.


