


Introduction
Body size represents an intriguing interface between ecology and evolution (Hunt et al. Reference Hunt, Wicaksono, Brown and Macleod2010). Theoretical and empirical work on body size has found differences in the evolutionary processes driving size evolution at different levels in the genealogical hierarchy (Jablonski Reference Jablonski1997; Heim et al. Reference Heim, Knope, Schaal, Wang and Payne2015; Smith et al. Reference Smith, Payne, Heim, Balk, Finnegan, Kowalewski and Lyons2016; Congreve et al. Reference Congreve, Falk and Lamsdell2018). Higher-order trends toward large body size are well supported (Heim et al. Reference Heim, Knope, Schaal, Wang and Payne2015; Smith et al. Reference Smith, Payne, Heim, Balk, Finnegan, Kowalewski and Lyons2016), while observations of body-size increase within species or populations may represent statistical artifacts (Jablonski Reference Jablonski1997) or the result of passive trends (McShea Reference McShea1994). At the population level, body size may be more often influenced by natural selection than other morphological characters, possibly due to its relative flexibility compared with the genetic and functional constraints limiting other morphological trait change (Stanley and Yang Reference Stanley and Yang1987; Clyde and Gingerich Reference Clyde and Gingerich1994; Gilchrist and Partridge Reference Gilchrist and Partridge2001; Kingsolver and Pfennig Reference Kingsolver and Pfennig2004; Hunt Reference Hunt2007). Perhaps relatedly, body size is substantially influenced by climate, resource availability, and ecological interactions, bringing it to the forefront in ecological investigations (Hone and Benton Reference Hone and Benton2005; Kingsolver and Huey Reference Kingsolver and Huey2008; Crampton et al. Reference Crampton, Cooper, Beu, Foote and Marshall2010; Watson et al. Reference Watson, Peck, Tyler, Southgate, Tan, Day and Morley2012; Clavel and Morlon Reference Clavel and Morlon2017). In marine organisms that construct a carbonate shell, ultimate size can be limited by the combination of temperature, life span, the saturation state of CaCO3, and food availability (Graus Reference Graus1974; Watson et al. Reference Watson, Peck, Tyler, Southgate, Tan, Day and Morley2012; Anderson and Allmon Reference Anderson and Allmon2020). This suggests that adaptive benefits to large size leading to enhanced fitness may exist, but evolutionary trade-offs may limit giantism.
At the organismal level, large size provides a variety of ecological and biological benefits (Peters Reference Peters1983; Calder Reference Calder1984; Schmidt-Nielsen Reference Schmidt-Nielsen1984; Smith Reference Smith1992; Andersson Reference Andersson1994; Kingsolver and Huey Reference Kingsolver and Huey2008; Smith and Lyons Reference Smith and Lyons2013). In a literature survey of plants, birds, and insects, Kingsolver and Pfennig (Reference Kingsolver and Pfennig2004) found that size had a positive effect on survival, fecundity, and mating success. Studies on decapod crustaceans and on 15 orders of fishes found that egg quantity and egg volume scale allometrically, interpreted as a positive effect of size on fecundity (Ramirez Llodra Reference Ramirez Llodra2002; Barneche et al. Reference Barneche, Robertson, White and Marshall2018). In predator–prey relationships, larger animals usually make more effective predators and are also more likely to escape as prey (Stanley Reference Stanley1979; Ray and Stoner Reference Ray and Stoner1995; Benton Reference Benton and Pagel2002; Hunt et al. Reference Hunt, Wicaksono, Brown and Macleod2010; Smith et al. Reference Smith, Payne, Heim, Balk, Finnegan, Kowalewski and Lyons2016). Larger organisms can better compete for resources (Bonner Reference Bonner1988), use more resources (Brown and Maurer Reference Brown and Maurer1986), and use those resources more efficiently (Peters Reference Peters1983). However, large body size can act as both an ecological and evolutionary restriction at both the organismal and species levels. Morphological and metabolic constraints, including gas exchange, circulation, diffusion, and enzyme activity, may all provide limits on an organism's ability to grow ever larger (Peters Reference Peters1983; Hone and Benton Reference Hone and Benton2005). Large size may also be limited by niche availability and competition among large species for resources (Ramirez Llodra Reference Ramirez Llodra2002; Hone and Benton Reference Hone and Benton2005; Hunt et al. Reference Hunt, Wicaksono, Brown and Macleod2010; Barneche et al. Reference Barneche, Robertson, White and Marshall2018). For example, some polychaete worms and the bivalve Mytilus have been shown to take advantage of nutrient blooms to grow larger and produce larger offspring (Ramirez Llodra Reference Ramirez Llodra2002 and references therein).
At the species level, large size has been linked to background and mass extinction resistance and species longevity, likely mediated by geographic range and life-history traits (Crampton et al. Reference Crampton, Cooper, Beu, Foote and Marshall2010; Harnik Reference Harnik2011; Monarrez et al. Reference Monarrez, Heim and Payne2021; but see Payne and Heim Reference Payne and Heim2020). However, because larger organisms require more resources, these species are likely to have lower population densities (Smith et al. Reference Smith, Payne, Heim, Balk, Finnegan, Kowalewski and Lyons2016), which can result in a higher statistical risk of extinction (Wallace Reference Wallace1876; Blanckenhorn Reference Blanckenhorn2000; Congreve et al. Reference Congreve, Falk and Lamsdell2018). Larger species have longer developmental time, resulting in longer generation times, and therefore reduced fecundity (Kingsolver and Pfennig Reference Kingsolver and Pfennig2004; Hone and Benton Reference Hone and Benton2005; Hunt et al. Reference Hunt, Wicaksono, Brown and Macleod2010; Smith et al. Reference Smith, Payne, Heim, Balk, Finnegan, Kowalewski and Lyons2016). Limitations on reproductive rate can have severe consequences in the face of extreme environmental changes experienced at intervals of mass extinction, during which species with long developmental times and slow generational turnover may be unable to produce the variations necessary to adapt to extrinsic pressures (Van Valen Reference Van Valen1973; Stanley Reference Stanley1975; Bakker Reference Bakker and Hallam1977; Martin Reference Martin, Chivers, Wood and Bilsborough1984; LaBarbera Reference LaBarbera, Raup and Jablonski1986; Bonner Reference Bonner1988; McLain et al. Reference McLain, Burnette and Deeds1993; Arnold et al. Reference Arnold, Kelly and Parker1995; Brown Reference Brown1995; McKinney Reference McKinney1997; Kozłowski and Gawelczyk Reference Kozłowski and Gawelczyk2002; Kingsolver and Pfennig Reference Kingsolver and Pfennig2004; Hone and Benton Reference Hone and Benton2005). Pronounced changes in body size within clades, and associated demographic variables, can have long-term consequences on evolutionary rates within clades (Berv and Field Reference Berv and Field2018), as shorter generation times have also been shown to correspond to higher rates of molecular evolution (Thomas et al. Reference Thomas, Welch, Lanfear and Bromham2010).
At the organismal level, smaller individuals can have higher fecundity per adult mass unit (Nekola et al. Reference Nekola, Barker, Cameron, Pokryszko, Smith and Lyons2013). By only growing to a small size, individuals reach reproductive age with low relative energy investment (Charlesworth Reference Charlesworth1980; Lande Reference Lande1982; Blanckenhorn Reference Blanckenhorn2000) and tend to experience earlier ontogenetic onset of sexual maturity, thus avoiding the accumulating risk of predation with aging (Ramirez Llodra Reference Ramirez Llodra2002; Kingsolver and Pfennig Reference Kingsolver and Pfennig2004; Kingsolver and Huey Reference Kingsolver and Huey2008; Kruuk Reference Kruuk2017).
The species-level benefits of small size include ease of environmental dispersal, leading to enhanced colonization potential and a broad geographic range (Blanckenhorn Reference Blanckenhorn2000). Earlier onset of reproduction also leads to high generational turnover (Blanckenhorn Reference Blanckenhorn2000; Kingsolver and Pfennig Reference Kingsolver and Pfennig2004; Kingsolver and Huey Reference Kingsolver and Huey2008; Kruuk Reference Kruuk2017). Small species are often r-strategists that produce abundant offspring without overinvesting in offspring size (Rollinson and Rowe Reference Rollinson and Rowe2015). Taken together, high generational turnover, broad geographic range, and large population size contribute to decreased extinction risk of small-bodied species (Jablonski Reference Jablonski1986; Blanckenhorn Reference Blanckenhorn2000; but see Payne and Heim Reference Payne and Heim2020; Monarrez et al. Reference Monarrez, Heim and Payne2021).
A variety of patterns of organismal size evolution have been noted relating to the geographic, environmental, and historical patterns of body-size distribution within clades. Larger size in poikilotherms at cooler temperatures has been extensively documented (Schmidt et al. Reference Schmidt, Thierstein, Bollmann and Schiebel2004; Hunt and Roy Reference Hunt and Roy2006; Hunt et al. Reference Hunt, Wicaksono, Brown and Macleod2010 and references therein), but not explained (Smith et al. Reference Smith, Payne, Heim, Balk, Finnegan, Kowalewski and Lyons2016). In contrast, a study of gastropod and bivalve size evolution throughout the Cenozoic (Chattopadhyay and Chattopadhyay Reference Chattopadhyay and Chattopadhyay2020) found no general pattern in molluscan body size with temperature. One of the most well-known higher-level patterns is Cope's rule, which states that a taxonomic lineage's body size tends to increase through geologic time (Cope Reference Cope1885; Stanley Reference Stanley1973; Brown and Maurer Reference Brown and Maurer1986; Alroy Reference Alroy1998; Kingsolver and Pfennig Reference Kingsolver and Pfennig2004; Van Valkenburgh et al. Reference Van Valkenburgh, Wang and Damuth2004; Hone and Benton Reference Hone and Benton2005; Hone et al. Reference Hone, Dyke, Haden and Benton2008). However, this “rule” is merely an observation of a common pattern and does not ascribe a mechanism (Gould and MacFadden Reference Gould and MacFadden2004). In addition, a sensu lato definition of Cope's rule has frequently been employed across the literature with implications for modeling and interpreting its theoretical underpinnings. Cope gave his own reason in his original expanded version of the rule, which is that the start of a clade lies in a small, unspecialized organism whose upper evolutionary limit for body size far exceeds the lower limit (Stanley Reference Stanley1973; Gould Reference Gould1988). This “law of the unspecialized” was reexamined by Stanley (Reference Stanley1973), who identified a rationale for this lower boundary, or “left wall,” of physiological constraints and design limitations thus causing body size to increase by default (Pearson Reference Pearson1948; McShea Reference McShea1994; West et al. Reference West, Woodruff and Brown2002; Clauset and Erwin Reference Clauset and Erwin2008). Gould (Reference Gould1988) proposed that a clade's increase in maximum body size (Cope's rule) is symptomatic of an increase in variance of body size as the clade diversifies from a small-sized ancestor. Hone and Benton (Reference Hone and Benton2005) point out that while Cope's rule likely represents a statistical artifact resulting from increasing variance, large size may still frequently be the result of directional selection.
Evolutionary trends may be the result of passive (diffusion bounded by the aforementioned left wall; Fig. 1A) or driven processes (the result of active sorting or selection; Fig. 1B) (Cope Reference Cope1885; Stanley Reference Stanley1973; Fisher Reference Fisher, Raup and Jablonski1986; Vermeij Reference Vermeij1987; Gould Reference Gould1988; McShea Reference McShea1994; Hunt Reference Hunt2007; Sookias et al. Reference Sookias, Butler and Benson2012). In the former, the left wall represents the absolute minimum in body size that cannot be passed due to physiological constraints (Stanley Reference Stanley1973). To help distinguish whether or not changes within a clade are active or passive, McShea (Reference McShea1994) presented three tests. First, if changes are passive, the minimum body size will not shift. Instead, it will act as a bounded wall that rebounds, extinguishes, or adheres to lineages whose decrease in body size approaches the boundary (Fig. 1A). Second, in a passive system, increases and decreases in body sizes will occur equally, where in a driven system, a directional trend is anticipated (Fig. 1B). Third, in a passive system, where a right-skewed trend may be caused by a left wall, a subclade within the right tail of the distribution will not be skewed but will instead show a normal distribution, because its size distribution has escaped the restrictions of the lower bound (McShea Reference McShea1994).
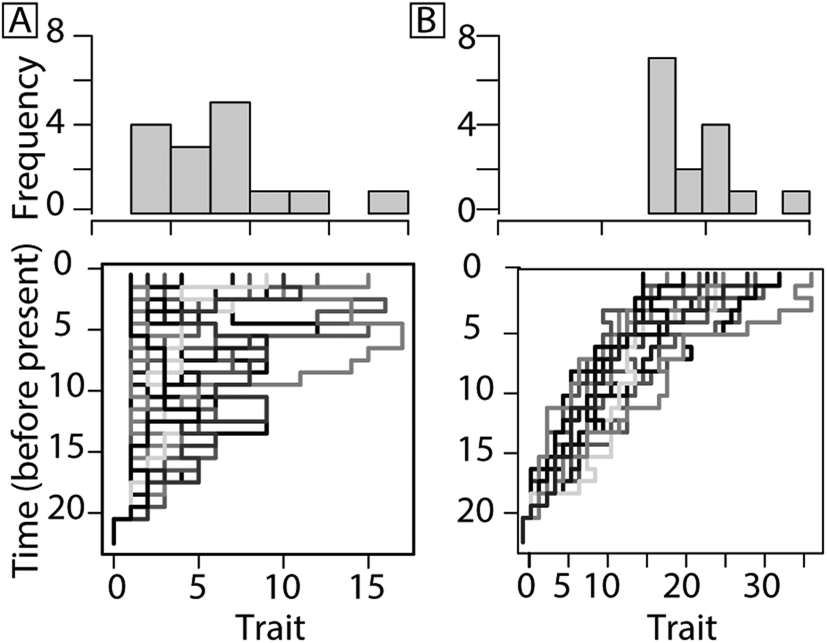
Figure 1. Models for trait change based on McShea (Reference McShea1994). A passive trend resulting in increasing mean size is favored by Stanley (Reference Stanley1973) and Gould (Reference Gould1988) (A) compared with a driven (selection or sorting) trend (B). Models provided for illustration were produced using simFossilRecord in the package paleotree (Bapst Reference Bapst2012). See Supplementary Material for model parameters.
A driven evolutionary trend in body size is governed by a selective advantage to be larger or smaller (Fig. 1B). In a driven system, a subclade selected from the right tail of the clade distribution would also be right-skewed, as both size distributions are controlled by the same factors (McShea Reference McShea1994). A driven trend in body size within a clade may be the result of (1) differential rates of extinction among species at one end of a distribution (e.g., eliminating smaller species through extinction, increasing average size within the clade), (2) differential rates of speciation among species at one end of a distribution (e.g., larger species speciate more frequently, so a larger proportion of species are large, even if extinction rate is the same for large and small species), (3) directional bias during speciation (e.g., descendant lineages tend to be larger than ancestors), or (4) a combination of any of these processes.
Marine animals show an increase in mean body size throughout the Phanerozoic, driven by the diversification of clades with larger body size rather than an increase in size within all considered clades (Heim et al. Reference Heim, Knope, Schaal, Wang and Payne2015). Whether the same selective pressure directs each species in a diversifying clade or whether each species experiences a different set of selective pressures that ultimately generate the same clade-level pattern remains unknown (McShea Reference McShea1994; Hunt Reference Hunt2006; Smith et al. Reference Smith, Payne, Heim, Balk, Finnegan, Kowalewski and Lyons2016). Marine invertebrate clades have exhibited both driven and passive trends in size evolution at different intervals in their geologic history. Brachiopods, arthropods, and echinoderms show driven size increases in the Paleozoic (Novack-Gottshall Reference Novack-Gottshall2008) followed by random fluctuations of body size in the post-Paleozoic (Zhang et al. Reference Zhang, Augustin and Payne2015). Analyses of Paleozoic brachiopods and Mesozoic decapod crustaceans found no support for directional trends at lower taxonomic levels (genus and species, respectively), with changes in brachiopod and decapod body size progressing through differential diversification at higher taxonomic scales (families, classes) (Novack-Gottshall and Lanier Reference Novack-Gottshall and Lanier2008; Klompmaker et al. Reference Klompmaker, Schweitzer, Feldmann and Kowalewski2015). Witts et al. (Reference Witts, Landman, Hopkins and Myers2020, Reference Witts, Myers, Garb, Irizarry, Larina, Rashkova and Landman2022) examined two species of Cretaceous ammonites and found support for size stasis over species ranges of 200 to 400 kyr.
To address the interface of evolution and ecology in driving body size, we investigate the size evolution of turritelline gastropods (Family Turritellidae: Subfamily Turritellinae; sensu Marwick Reference Marwick1957), a well-sampled and globally distributed extant group of marine gastropods (Allmon Reference Allmon2011) that originated in the Upper Jurassic (Das et al. Reference Das, Saha, Bardhan, Mallick and Allmon2018). Turritellines are not morphologically representative of an “average” gastropod shape; high-spired gastropods peak in proportional subfamily diversity in the Mesozoic (Vermeij Reference Vermeij1987), and they are unusual as sessile suspension feeders, as mobile carnivores are the most taxonomically diverse of Cenozoic gastropods (Todd et al. Reference Todd, Fortunato, Jackson, Miller and Jung2016). Turritelline gastropods are often used for paleoclimate research and are recognized as one of the most abundant and widespread marine body fossils, justifying their use as a research organism (Allmon Reference Allmon2011; Plotnick Reference Plotnick2018). A species-level size database for turritelline gastropods was compiled to examine whether size change throughout their evolutionary history is best described as passive or driven. We also tested this dataset for patterns of size and latitudinal distribution, size and temporal distribution, and size compared with proxies for climate change, productivity, and pH in order to evaluate possible environmental drivers of body-size trends in turritelline history. We expect high productivity to release suspension feeders from metabolic trade-offs (Teusch et al. Reference Teusch, Jones and Allmon2002; Anderson and Allmon Reference Anderson and Allmon2020; Shin et al. Reference Shin, Allmon, Anderson, Kelly, Hiscock and Shin2020) and normal to high levels of carbonate saturation for shell construction (Allmon Reference Allmon2007; Anderson and Allmon Reference Anderson and Allmon2020) to favor increased growth and therefore larger size in turritelline gastropods.
Methods
We compiled shell lengths of 316 turritelline gastropod species from descriptions or specimen images from the literature to create a global dataset spanning the entire evolutionary history of the group (Jurassic to Recent) representing 18.5% of known fossil and Recent species (Allmon Reference Allmon2022) (Supplementary Dataset 1). First appearance is based on the entire species’ stratigraphic history (not just that of the type specimen) and is resolved to the lower, middle, and upper portion of each Cenozoic epoch and the Early and Late Cretaceous. This dataset is composed of one representative for each species from the following categories: 198 holotypes, 59 other primary types, 10 maximum reported sizes, and 49 figured specimens when types could not be located. Analyses were conducted on both the complete species dataset and type-only dataset (Kosnik et al. Reference Kosnik, Jablonski, Lockwood and Novak-Gottshall2006; Krause et al. Reference Krause, Stempien, Kowalewski and Miller2007). The lengths of broken specimens with more than 4 whorls present were extrapolated following the method of Johnson et al. (Reference Johnson, Anderson and Allmon2017), while specimens with substantial loss of body whorls (fewer than 4 whorls total) were excluded. All shell lengths were natural log-transformed before analyses (Payne Reference Payne2005; Benson et al. Reference Benson, Godoy, Bronzati, Butler and Gearty2022). While type specimens are generally biased toward large individuals with little interspecific or secular differences in this bias (Kosnik et al. Reference Kosnik, Jablonski, Lockwood and Novak-Gottshall2006; Krause et al. Reference Krause, Stempien, Kowalewski and Miller2007; Whitaker and Kimmig Reference Whitaker and Kimmig2020), we examined the suitability of holotype length as a proxy of maximum size by comparing 17 holotypes with conspecifics from the collections at the Paleontological Research Institution (PRI) (Fig. 2, Supplementary Datasets 2A, 2B). These species range from the upper Paleocene to upper Pliocene and include specimens from North and South America, Europe, and Africa.

Figure 2. Box plots of natural log-transformed length distributions of 17 turritelline gastropod species with the green triangles indicating the log length of the species’ holotype (Supplementary Datasets 2A, 2B, Supplementary Table 1). These 17 holotype origins span a geologic range from the upper Paleocene to the upper Pliocene and a geographic range including specimens from North and South America, Europe, and Africa. Midlines of boxes represent the median natural log-transformed shell length of specimens. Whiskers represent the lowest and highest natural log-transformed shell lengths within 1.5 interquartile range (IQR) from the lower (bottom edge of box) and upper (top edge of box) quartiles; the filled circles represent outliers, any data that extend beyond the 1.5 IQR. Sample size is indicated by the number above each species’ name.
Most holotypes were significantly larger than the mean for samples of non–type specimens (Fig. 2, Supplementary Table 1); only two of the holotypes were smaller than the 3rd quartile of their conspecifics, and one was not significantly different from the species’ distribution. Previous comparisons of types with bulk samples (Kosnik et al. Reference Kosnik, Jablonski, Lockwood and Novak-Gottshall2006; Krause et al. Reference Krause, Stempien, Kowalewski and Miller2007) have found that types are generally larger than average size for the species and have suggested correcting for this bias. Because of the mostly consistent bias in size difference between types and non-types, however, we chose to use holotype size as a proxy for species size without correction, as we do not find any reason to believe that the degree or direction in bias associated with the selection of holotypes varies through geologic time or geographic region (Whitaker and Kimmig Reference Whitaker and Kimmig2020).
To test for passive versus driven trend in mean turritelline gastropod body size we used time series analysis (paleoTS; Hunt Reference Hunt2019) to assess models of an unbiased random walk (URW; no selective pressure on body size), a generalized random walk (GRW: biased trend in body size, either increase or decrease), and stasis (fluctuation around a mean, no directional change) (Hunt Reference Hunt2006, Reference Hunt2019). The analysis used the joint parameterization, which calculates likelihood based on the distribution of the entire sample and therefore does not require a resolved phylogeny (Hunt Reference Hunt2006, Reference Hunt2019). Akaike weights (Akaike information criteria [AIC]) were evaluated to determine model support (Akaike Reference Akaike1974). Time series analysis was also applied to temporal subdivisions of turritelline gastropod geologic range to examine potential shifts in evolutionary mode at event boundaries. Hunt et al. (Reference Hunt, Hopkins and Lidgard2015) found that AIC will inflate support for complex models, those with changes in evolutionary mode, and proposed parametric bootstrapping to compare the simple and complex models (Hunt Reference Hunt2019). We conducted a bootstrap analysis of 99 replications to compare the likelihood of the complex models versus simple evolutionary models (Hunt Reference Hunt2019).
To provide an additional test for an evolutionary trend in turritelline body size over time, Spearman's rank was used to test the significance of the relationship of shell length through time; from the Upper Jurassic to the Recent, (n = 21 time bins) as well as the Mesozoic and Cenozoic independently (R Core Team 2017). Data were binned into approximately 5 Myr (±0.5 Myr) intervals based on species’ first appearances following the intervals used by Cárdenas and Harries (Reference Cárdenas and Harries2010) adjusted from the 2004 Geologic Time Scale to the 2012 Geologic Time Scale using the method of Wei and Peleo-Alampay (Reference Wei and Peleo-Alampay1993) (Supplementary Datasets 3A, 3B). The mean shell length was calculated for each time bin, and the largest and smallest species lengths for each time bin were selected. This analysis approximates tests for unbiased (equal chance for size increases and decreases), lower-bounded (equal chance for size increases and decreases with a lower boundary), and size-biased (greater chance for size increase) models of body-size evolution through time (Heim et al. Reference Heim, Knope, Schaal, Wang and Payne2015). A Bonferroni-corrected α value of 0.006 was applied to adjust for the multiple comparisons of the three time frames and three types of size data following Hochberg (Reference Hochberg1988). To address how changes in sample size (species richness) through time might influence size variance and possible maximum and minimum size trends, a permutation test was conducted. To model the null hypothesis, that increasing sample size drives shell length variance, sample lengths were randomly assigned to a time bin without replacement, maintaining the original number of samples (species richness) per bin. Each permutation was used to generate slopes of maximum and minimum size through time. After 1000 permutations, a distribution of maximum and minimum slopes was compared with the trends from the primary data. One-sided permutation tests of significance were performed by determining the threshold for the 95th percentile of the maximum length sampling distribution and the 5th percentile of the minimum length sampling distribution.
To test the effect of paleoenvironmental conditions on species size, time series analysis was applied to five environmental proxies using the covariate tracking function of paleoTS (Hunt Reference Hunt2019). To visualize the comparisons of five environmental proxies, oxygen (δ18O), carbon (δ13C), sulfur (δ34S), and strontium (87Sr/86Sr) isotopes and pH, with turritelline size, first differences (change from the previous time step) of natural log body size and of each environmental proxy were calculated to reduce the spurious autocorrelation of time series data (Cárdenas and Harries Reference Cárdenas and Harries2010). Global records of oxygen (δ18O), carbon (δ13C), sulfur (δ34S), and strontium (87Sr/86Sr) isotope data reported in Cárdenas and Harries (Reference Cárdenas and Harries2010) were adjusted to the 2012 Geologic Time Scale (Wei and Peleo-Alampay Reference Wei and Peleo-Alampay1993) (Supplementary Datasets 3A, 3B) for comparison to turritelline shell length (Supplementary Methods). Oxygen isotopes were used to estimate global temperature trends from the Jurassic to the Recent; carbon isotopes provide an estimate of primary productivity; while sulfur (a proxy for phosphate recycling) and strontium (a proxy for continental weathering and seafloor spreading) were used as proxies for nutrient availability (Shields Reference Shields2007; Cárdenas and Harries Reference Cárdenas and Harries2010). Values of pH representing the last 160 Myr were digitally extracted from figures in Pearson and Palmer (Reference Pearson and Palmer2000) estimated from boron isotopes from the Cenozoic and from Ridgwell (Reference Ridgwell2005), who modeled pH using CO2 atm for the Mesozoic record and two Oligocene time bins missing in Pearson and Palmer (Reference Pearson and Palmer2000). pH is used instead of Ω (carbonate saturation) because it likely has the most direct physiological impact on an organism's ability to calcify (Bach Reference Bach2015; Cyronak et al. Reference Cyronak, Schulz and Jokiel2016; Kottmeier et al. Reference Kottmeier, Rokitta and Rost2016). Spearman's rank was applied to each data pair to test the significance of a relationship between each of five environmental parameters and three size datasets (mean, minimum, and maximum shell length) within each ~5 Myr time bin. A Bonferroni-corrected α value of 0.003 was applied to adjust for the 15 total comparisons of environmental proxies and size data following Hochberg (Reference Hochberg1988). Each lagged proxy value was also compared with turritelline species richness with a Bonferroni-corrected α value of 0.01. This process omitted the Recent time bin with 72 species, as it has no corresponding lag proxy data.
To examine how the size of turritelline gastropod holotypes varies with latitude, each fossil species’ natural log size was compared with the midpoint of its paleolatitudinal range, and each modern species’ natural log size was compared with the midpoint of its known latitudinal range. To assign paleolatitude, each specimen was assigned a modern latitudinal and longitudinal range based on the geographic-range information available from the literature for each species (Supplementary Dataset 1). Next, modern latitudes were adjusted for the paleolatitude of the geologic interval inhabited by the species using the tool at Paleolatitude.org (van Hinsbergen et al. Reference van Hinsbergen, De Groot, van Schaik, Spakman, Bijl, Sluijs, Langereis and Brinkhuis2015). Natural log shell length and the midpoint of each species’ latitudinal range were compared using Spearman's rank. Analysis focused on range mean to avoid distortion due to variable paleontological effort, which may impact turritelline species range data more than the parameters under evaluation.
To evaluate whether species size covaries with species latitudinal range, a linear correlation of paleolatitudinal range and mean size was conducted. A log10 transformation was used to normalize paleolatitudinal range data and the correlation considered only the first standard deviation. This approach removed the smallest latitudinal ranges, which could represent understudied species with artificially truncated ranges, and species with the greatest latitudinal ranges, which might represent species that are lacking close taxonomic scrutiny and are overrepresented geographically.
To examine the effect of species size on species longevity, each species’ mean natural log size was compared with the geologic duration using Spearman's rank. Species’ first and last appearances are resolved to lower, middle, and upper periods or epochs (Supplementary Dataset 1). A log10 transformation normalized duration data, and a conservative analysis considering only the first standard deviation was performed to remove species with the shortest durations, which primarily removed Recent species, and the longest-lived species, which might have artificially long durations as the result of poorly defined taxonomy rather than extreme longevity.
Results
The natural log-transformed evolutionary history dataset appears to demonstrate an increase in size variance throughout the evolutionary history of turritelline gastropods (Fig. 3A), and the time series analysis (PaleoTS) strongly supports a pattern of stasis (Akaike weight = 0.995) (Fig. 3B, Supplementary Table 2). In the complex model fit, which examines potential breakpoints in evolutionary mode through time, a pattern of stasis retained support with no evolutionary mode shifts detected (Akaike weight = 0.99) (Supplementary Table 3). When time series analysis was applied to the 257 species in the type-only dataset (excluding maximum sizes and specimens), stasis retained high support in simple and complex models (Akaike weight = 0.997 and 0.992, respectively) (Supplementary Tables 4, 5). The covariate model results compared simple, complex, and environmental proxy covariate models and also found the highest support for stasis (Akaike weight = 0.895) (Supplementary Tables 6, 7). Comparisons of five environmental proxies, oxygen (δ18O), carbon (δ13C), sulfur (δ34S), and strontium (87Sr/86Sr) isotopes and pH, with mean, minimum, and maximum turritelline size from corresponding time bins resulted in no significant correlations under the Bonferroni-corrected α level 0.0003 and no significant correlations with species richness under the Bonferroni-corrected α level 0.01 (Supplementary Fig. 1, Supplementary Tables 8, 9). The same analysis conducted with the type-only dataset also found no significant relationship (Supplementary Fig. 2, Supplementary Table 10).
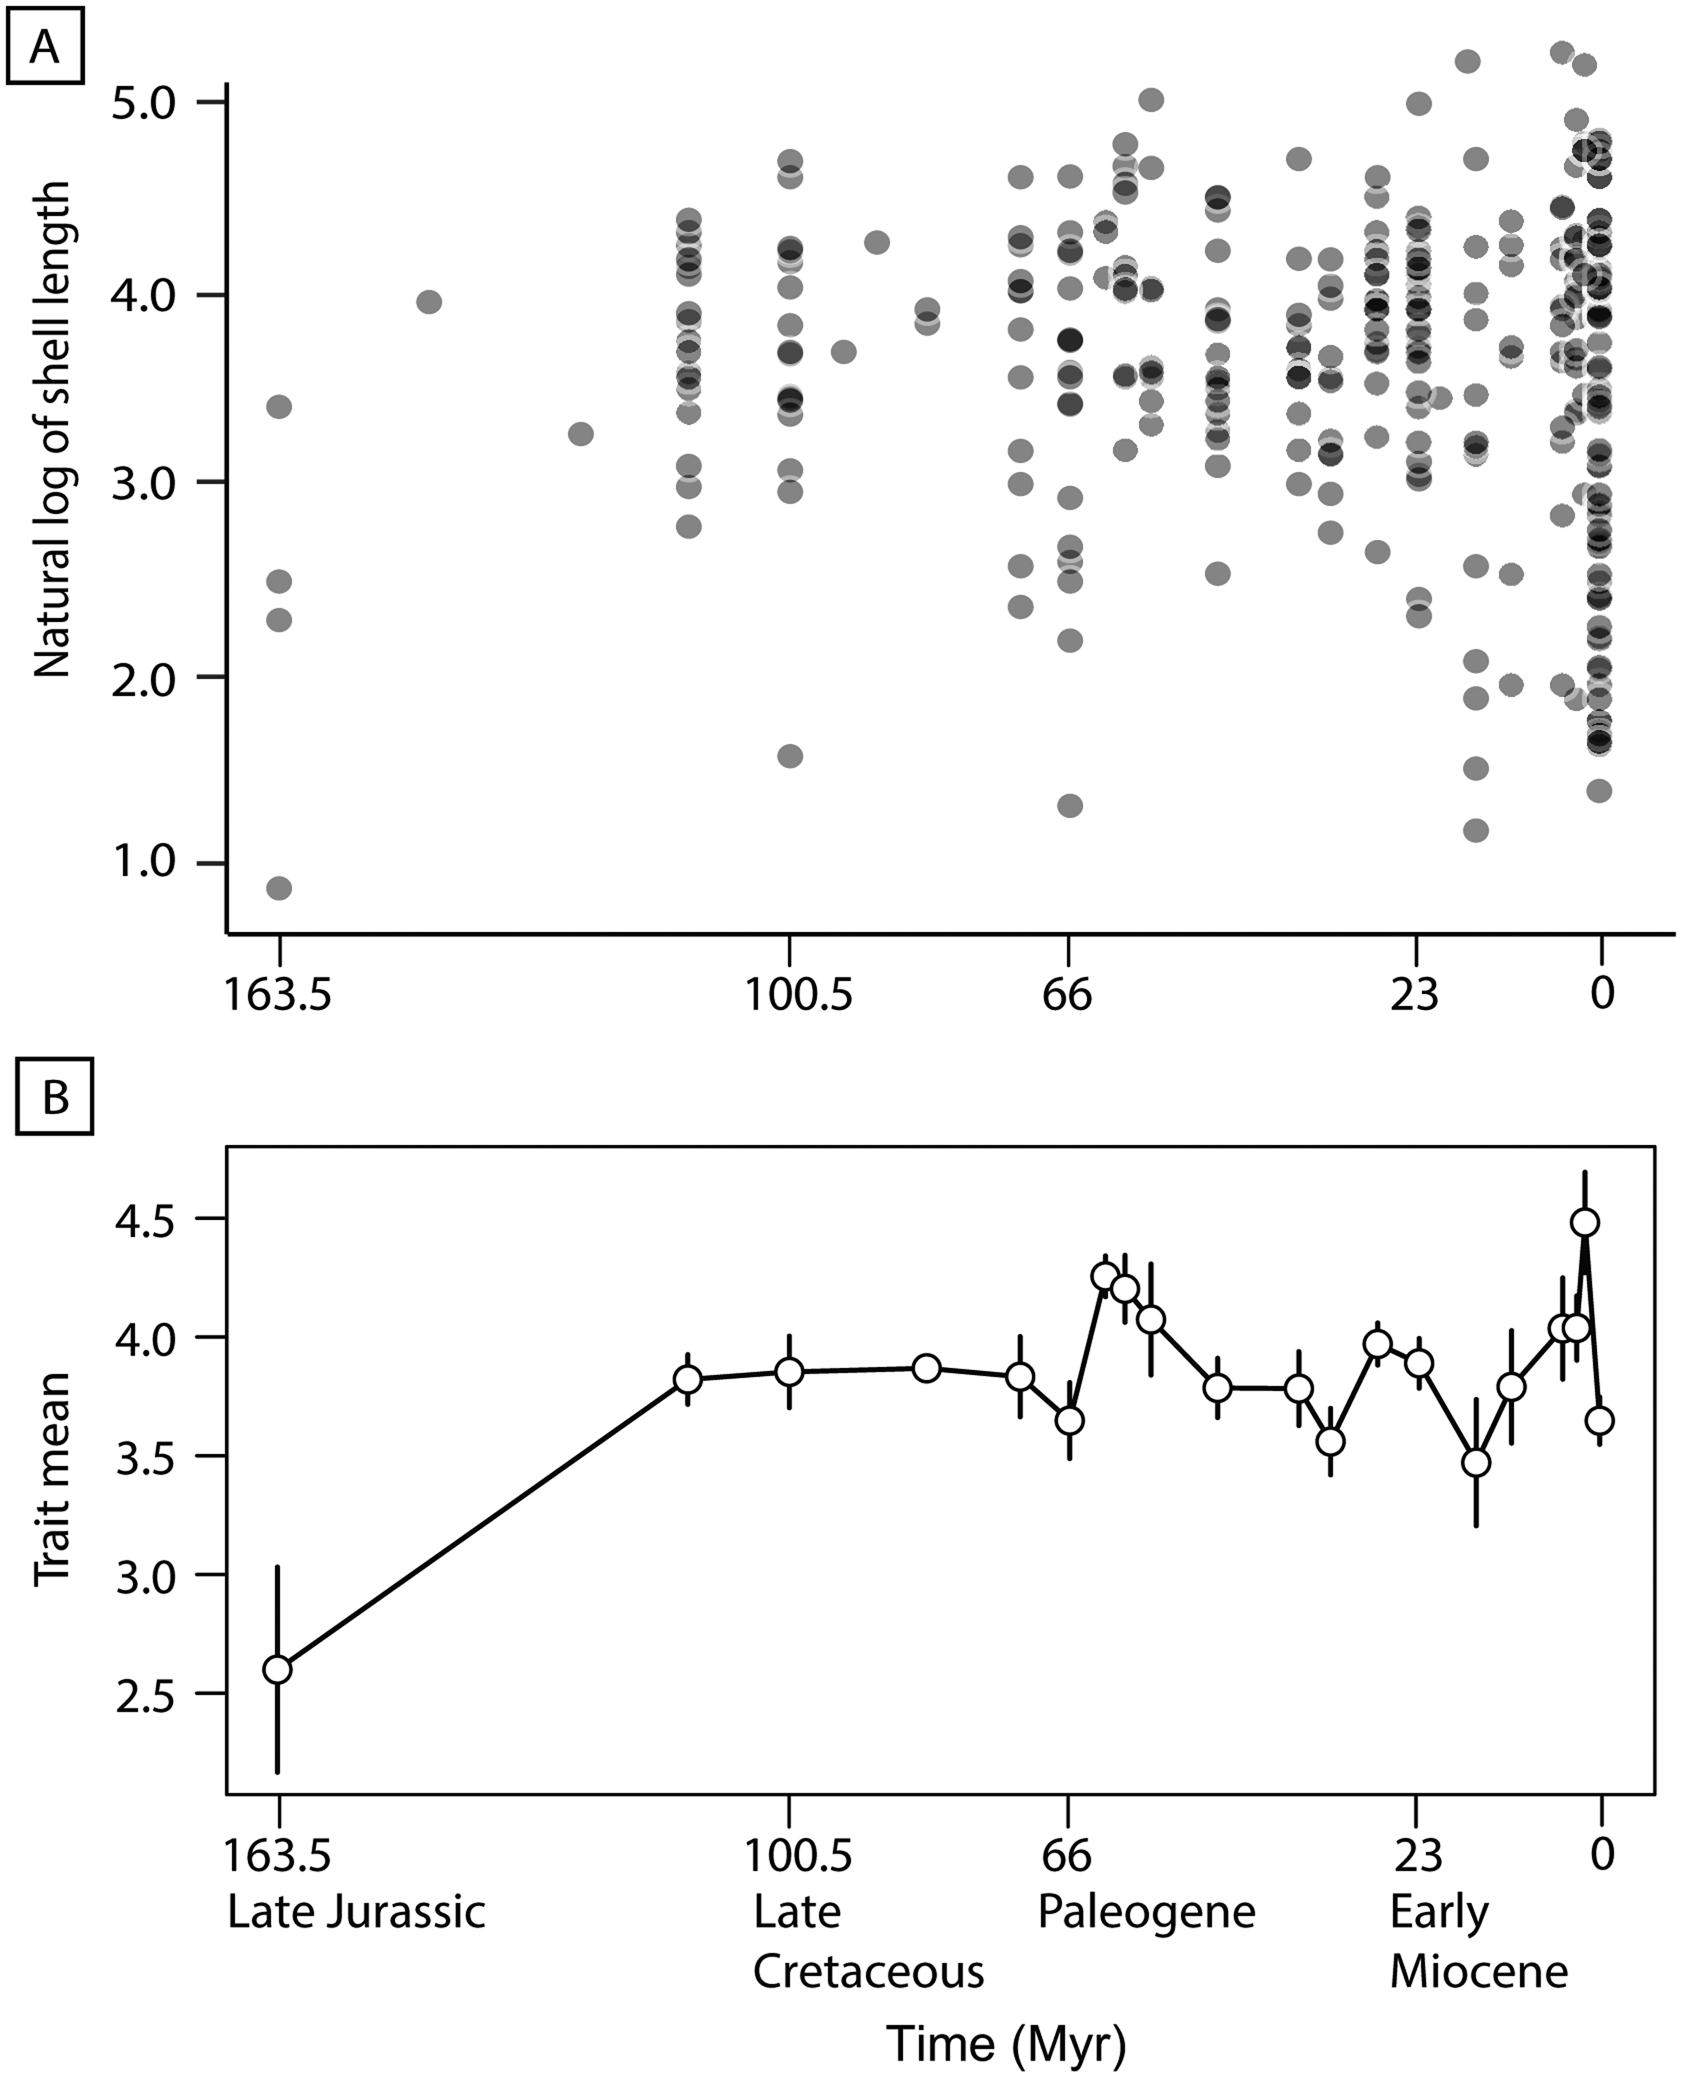
Figure 3. A, Plot of natural log-transformed length of each species’ representative for the entire evolutionary history dataset compared with specimen age (n = 316). B, Evolutionary trend of mean natural log-transformed shell length produced at each time bin by paleoTS (Hunt Reference Hunt2006) from the Upper Jurassic to Recent; error bars represent variance.
Spearman's correlation revealed no significant monotonic trend in average shell length from the Upper Jurassic to the Recent (20 bins) (Fig. 4). Linear correlation shows that the maximum shell length (the length of the species with the longest shell in that time bin) significantly increased over time and minimum size decreased notably throughout the evolutionary history of turritelline gastropods (Supplementary Fig. 3, Supplementary Table 11). In an analysis that removed the 72 species that most recently originated (final time bin from 78,000 yr BP to modern) and in a separate analysis of type-only data, the major trends in turritelline size remained the same: maximum size increases significantly throughout their entire evolutionary history and minimum size in the Cenozoic decreases substantially, but not enough to be statistically significant (Supplementary Figs. 4, 5, Supplementary Tables 12, 13). When compared with the resampled permutation, the maximum slope is significantly steeper than the 95th percentile of slopes detected through permutation, which suggests sample size alone was not responsible for this significant size increase through time (Supplementary Table 14). The slope of decreasing minimum size falls within the distribution of subsampled data and cannot be distinguished from an increase in size variance due to increasing sample size. Improved preservation could also be responsible for decreasing body size, although the appearance of some of the smallest type species in the Mesozoic and early Paleogene record, as well as the observed pattern of type specimens as often being substantially larger than their species size distribution (Fig. 2), suggests preservation is not the primary driver of recovered size patterns.
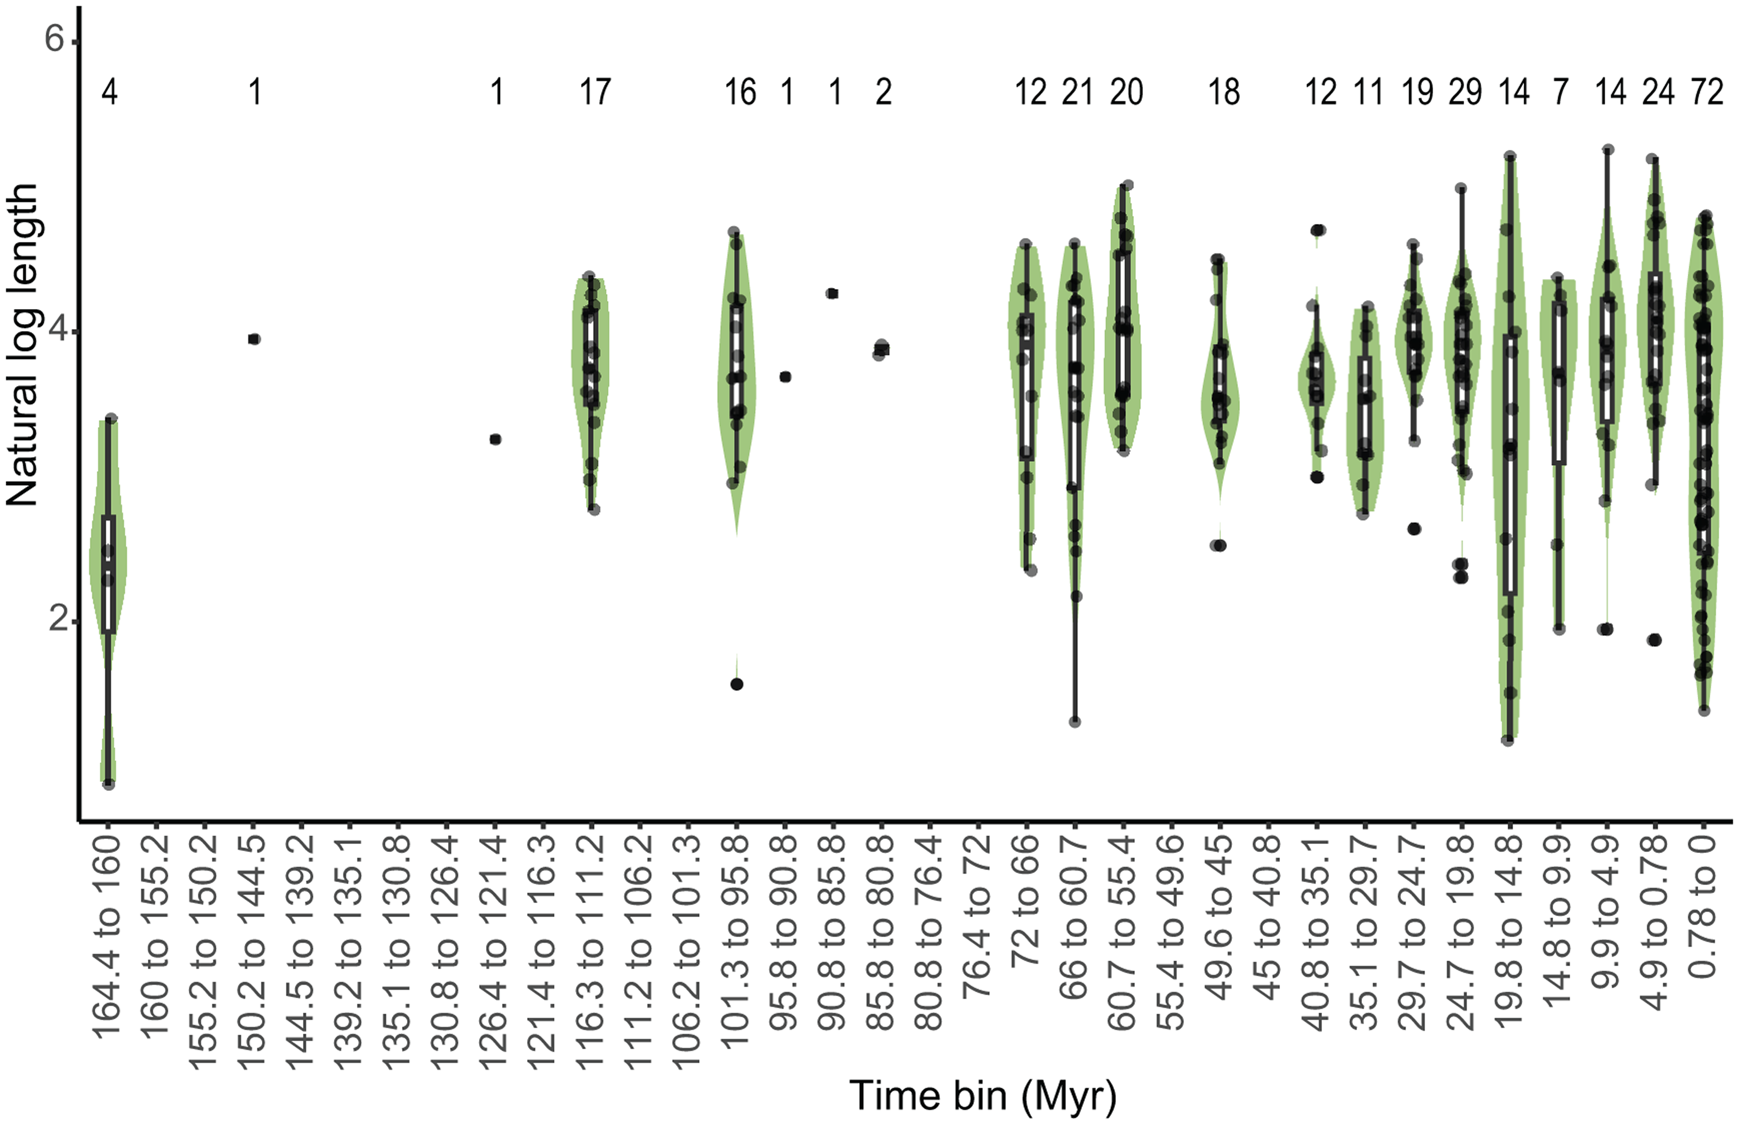
Figure 4. Distribution of turritelline size through time. The width of the violin plots shows the distribution of the size data within each ~5 Myr time bin. Midlines of box plots represent the median natural log-transformed shell length of specimens within the time bin. Whiskers represent the lowest and highest natural log-transformed shell lengths within 1.5 interquartile range (IQR) from the lower (bottom edge of box) and upper (top edge of box) quartiles; the filled circles represent outliers, any data that extend beyond the 1.5 IQR. The raw data are shown as grayscale points. The horizontal offset of point data within each violin plot is not representative of temporal distribution. Sample size is indicated by the number above each time bin.
From turritellines’ Late Jurassic first appearance in what is present-day western India, their geographic range expanded throughout the Cretaceous to include the Northern Hemisphere midlatitudes (25°N to 45°N) (Fig. 5B, Supplementary Table 15). During this Cretaceous geographic range expansion, turritelline shell length increased from their moderate-sized origins (2.4 to 30 mm shell length) to range from 10 to 100 mm by the end of the Mesozoic (Figs. 3A, 4). During the Paleogene, turritellines diversified in tropical latitudes (0° to 20°) of both the Northern and Southern Hemisphere and ranged into high latitudes (60°N to 80°N) in the Northern Hemisphere, but with little corresponding change in body-size distribution (Fig. 5C). During the Neogene, turritellines diversified into the midlatitudes of the Southern Hemisphere (30°S to 50°S) (Allmon Reference Allmon1992, Reference Allmon2007). The increase in species richness of small turritellines in the Southern Hemisphere drove a significant decrease in the average of species shell lengths that continues to define the modern size and latitude distribution of turritellines (t-test Northern Hemisphere mean natural log size = 1.78, Southern Hemisphere mean natural log size = 1.23, p << 0.0001) (Fig. 5D,F). When the type-only dataset is examined, these observations remain consistent (Supplementary Fig. 6, Supplementary Table 16). There was no clear trend in paleolatitudinal range and species length (rho = 0.0462, p = 0.4515); the majority of species have a paleogeographic range under 10° latitude, though larger species tended to have larger geographic ranges (Supplementary Fig. 7). When the data were log transformed and only 1 SD was analyzed, a significant inverse trend was recovered, with smaller species spanning larger latitudinal ranges (rho = 0.1499, p = 0.0259) (Supplementary Fig. 7). Species geologic duration and shell length have a positive, though insignificant relationship (rho = 0.0804, p = 0.1539). When the data were log transformed and only 1 SD was analyzed, a significant negative relationship was recovered: a decrease in species duration with increasing size (rho = −0.1774, p = 0.0144) (Supplementary Fig. 8). The ability to further interpret these patterns is hampered by the limited resolution of species duration data.
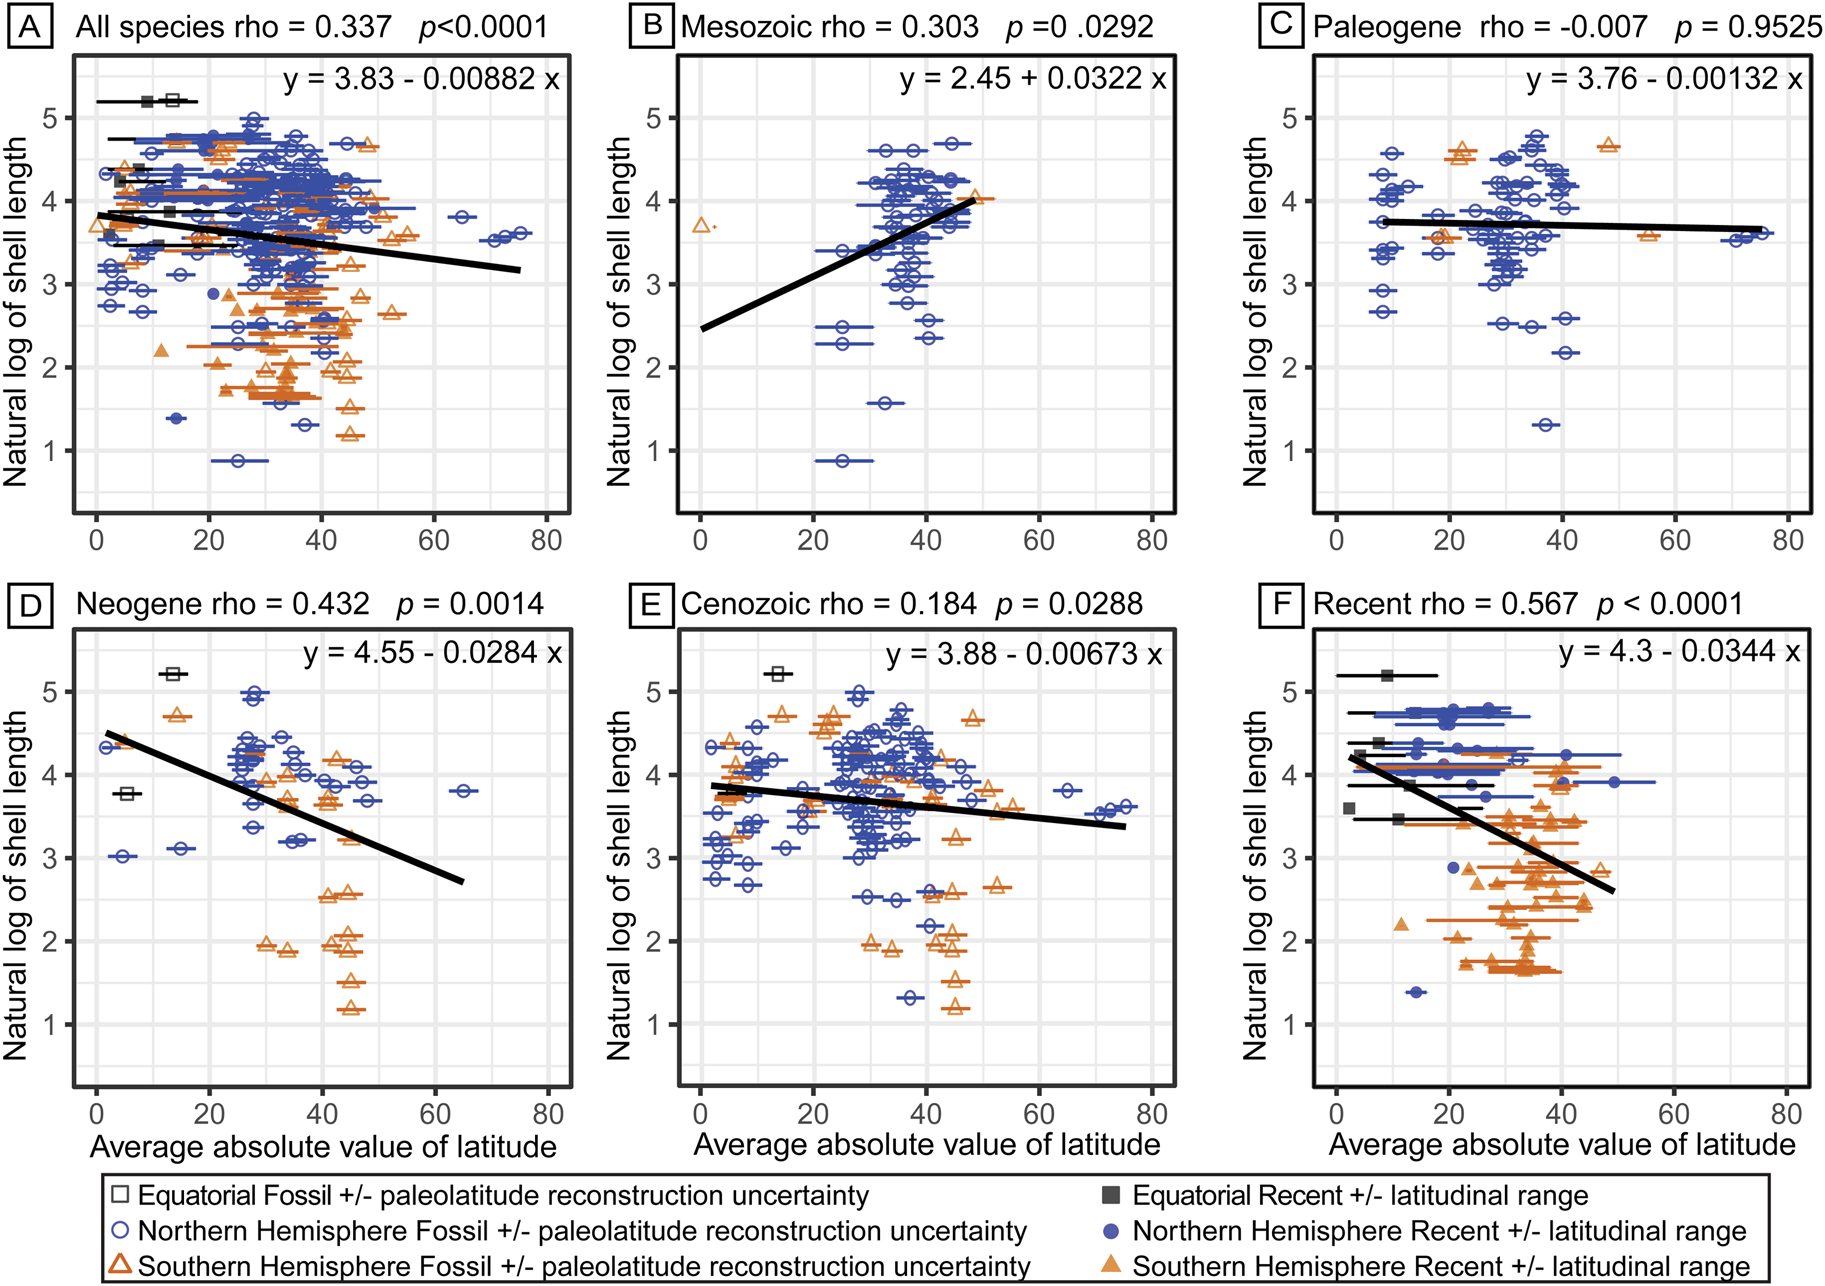
Figure 5. Natural log-transformed shell length is displayed according to the absolute value of the midpoint of the latitudinal range for each species. A, The entire evolutionary history dataset; B, species with origins in the Mesozoic; C, species with origins in the Paleogene; D, species with origins in the Neogene, excluding species that range into the Recent; E, species with origins in the Cenozoic, excluding species that range into the Recent; and F, species that range into the Recent. Filled shapes represent species extending to the Recent, and corresponding error bars represent their latitudinal ranges. Open shapes represent specimens only known from the fossil record, and those error bars represent the uncertainty of paleolatitude reconstruction. Gray squares represent species that span the equator; blue circles represent species with ranges only in the Northern Hemisphere; orange triangles represent species with ranges only in the Southern Hemisphere.
Discussion
Taphonomic and Sample Size Concerns for Size Biases
The patterns described here could be a result of taphonomic bias in the preservation of certain size classes. If so, the expectation would be that younger collections would preserve more delicate, small-sized specimens as well as more complete specimens of tall turritelline shells (Alroy et al. Reference Alroy, Aberhan, Bottjer, Foote, Fürsich, Harries and Hendy2008; Hendy Reference Hendy, Allison and Bottjer2011; Smith et al. Reference Smith, Payne, Heim, Balk, Finnegan, Kowalewski and Lyons2016). An additional concern is the loss of small turritelline shells to increasing durophagous predation through time (Vermeij Reference Vermeij1977, Reference Vermeij1987; Walker and Brett Reference Walker and Brett2002). However, our approach using holotypes eliminates the concern that would be present if sample distributions of shell length were used to represent each species. Holotypes selected generally represent larger specimens within a species size range, but there is no reason to expect a secular trend in the size of the holotype relative to the maximum size attained by that species (Fig. 2).
An additional concern is that increasing sample size (species richness) through time could lead to increased size variance and therefore decreasing minimum and increasing maximum size trends. A permutation test resampled shell length data while preserving the observed pattern of increasing species richness through time and found that turritelline maximum size increased more than would be expected from increasing sample size (Supplementary Table 14). This result supports the linear correlation analysis that recovered a significant increase in maximum length over turritellines’ evolutionary history (Supplementary Tables 11–13, Supplementary Figs. 3–5). The decrease in minimum slope cannot be distinguished from an increase in sample variance. This result corresponds to the linear correlation analysis that found minimum shell length decreases through time, though not significantly (Supplementary Fig. 3).
Evolutionary Drivers/Mechanisms of Size Variance
We find that turritelline size evolution does not fully fit McShea's predictions for a passively evolving system (McShea Reference McShea1994; Fig. 1). The size history of turritelline gastropods is one of an increase in size variance, partially due to increasing sample size (Fig. 3). In a passive system, McShea (Reference McShea1994) predicted a left wall that is sticky or rebounding, assuming that new lineages originate at small size (Cope Reference Cope1885; Stanley Reference Stanley1973; Fisher Reference Fisher, Raup and Jablonski1986; Gould Reference Gould1988; McShea Reference McShea1994) (Fig. 1A). In turritelline gastropods, minimum size experiences a substantial decrease over their evolutionary history from a moderate-sized ancestor, but this change cannot be initially distinguished from a passive decrease in shell length due to increasing sample size (Figs. 3, 4). In a passive system, McShea (Reference McShea1994) also predicted equal chance for increases and decreases in body size. In turritelline gastropods, size decrease and increase are not of equal magnitude. Turritelline maximum size shows a significant increase over their entire evolutionary history, from ~30 mm in the Late Jurassic to 190 mm in the Neogene, while minimum size decreases from ~20 mm to ~7 mm (Supplementary Fig. 3). Maximum size trends show no clear connection to latitudinal range shifts or environmental proxy data, which could suggest maximum size increase in turritelline gastropods is due to a passive increase in size variance (Gould Reference Gould1988). Turritelline size decrease does not show a statistically significant pattern over their entire evolutionary history, which would support passive diffusion into an ever-expanding range of body size, except for the significant decrease in average body size in the Neogene associated with a latitudinal range shift into the Southern Hemisphere (t-test p = 1.528−9, Figs. 4, 5D). This result is interpreted as a directional selective shift during the Neogene (see later discussion) that is best represented as passive size evolution until some origination event produces a driven trend (McShea Reference McShea1998: fig. 2E).
The evolutionary benefits of small size most relevant to turritellines are the potential for increased reproductive output and lower energy requirements to attain sexually mature size. Early reproduction is most advantageous during phases of population growth (Lande Reference Lande1982; Charlesworth Reference Charlesworth1994; Blanckenhorn Reference Blanckenhorn2000), and turritelline gastropods are well known for their population booms recorded in a fossil record of numerous “turritelline-dominated assemblages” throughout the history of the group (Allmon Reference Allmon2007; Anderson et al. Reference Anderson, Hendy, Johnson and Allmon2017; Shin et al. Reference Shin, Allmon, Anderson, Kelly, Hiscock and Shin2020). Extinction risk across stage boundaries is more often higher for small-bodied genera (Payne and Heim Reference Payne and Heim2020; Monarrez et al. Reference Monarrez, Heim and Payne2021), but in this analysis, smaller turritelline species tend to have longer geologic durations (Supplementary Fig. 8). Studies of molluscan size and species longevity have recovered conflicting trends or a lack of relationship between size and species duration (Jablonski Reference Jablonski, Jablonski, Erwin and Lipps1996; Crampton et al. Reference Crampton, Cooper, Beu, Foote and Marshall2010; Harnik Reference Harnik2011). A study of Cenozoic mollusk species of New Zealand by Crampton et al. (Reference Crampton, Cooper, Beu, Foote and Marshall2010) found larger gastropods did correspond to longer geologic duration, whereas bivalves did not show a significant pattern. When compared with work by Jablonski (Reference Jablonski, Jablonski, Erwin and Lipps1996) in the Cretaceous U.S. Gulf and Atlantic Coastal Plain, a trend of body size and species longevity in mollusks was not recovered. Harnik (Reference Harnik2011) examined species from three superfamilies of bivalves in the Cenozoic U.S. Gulf and Atlantic Coastal Plain and found that body size had different effects on species longevity for different superfamilies. The absence of a consistent trend between body size and geologic duration across clades has been interpreted as an interaction of size with other functional life-history traits or the influence of size on species geographic range, which in turn affects species duration (Crampton et al. Reference Crampton, Cooper, Beu, Foote and Marshall2010; Harnik Reference Harnik2011). The modest size of turritellines along with their frequently large population sizes may contribute to their long geologic history and survival through the Cretaceous–Paleogene extinction, Paleocene–Eocene thermal maximum, and Eocene-Oligocene transition. Determining whether body size is itself linked to increased speciation rate and/or extinction risk in turritellines requires a phylogenetic framework and is beyond the scope of this paper, but large size does not appear to convey a net advantage, as the model most closely followed by turritellines is one of stasis with increasing variance.
Possible Drivers of Stasis
The evolutionary history of turritelline gastropod body size is characterized by stasis, implying no consistent macroevolutionary trend in body size (Fig. 3, Supplementary Tables 2–7). Hunt and Rabosky (Reference Hunt and Rabosky2014) suggest that stasis will be the most common evolutionary pattern for clades, like turritellines, that encompass a broad geographic range. Here we extrapolate mechanisms for stasis within a species to those that might operate at the clade level. One proposed mechanism for stasis within geographically widespread species is that evolutionary change might occur in local populations, possibly in response to heterogeneous environmental conditions, but that gene flow among populations with different local conditions will average out across the species’ trait means (Eldredge et al. Reference Eldredge, Thompson, Brakefield, Gavrilets, Jablonski, Jackson, Lenski, Lieberman, McPeek and Miller2005). At the clade level, if optimal size varies among species depending on their geography or aspects of their ecology (and if size is not intrinsically related to speciation rate or extinction risk), then the aggregate result of a clade's global distribution may be the maintenance of a similar clade-level average size among species over time. In contrast, differential diversification in a new region that favors either large- or small-bodied species (such as the case of small-bodied turritelline species in the Neogene Southern Hemisphere; see later discussion) may lead to changes in the average size of the clade. Additionally, while a species might adapt (anagenetically) to environmental change, abiotic conditions will not necessarily follow a directional trajectory or might fluctuate within some set of bounded conditions, leading the species’ response to appear as stasis (Hunt and Rabosky Reference Hunt and Rabosky2014; Hunt et al. Reference Hunt, Hopkins and Lidgard2015). Differential diversification of species tracking shifting environmental conditions and encountering abiotic limits to upper and lower size can also result in an overall clade-level appearance of stasis (Eldredge et al. Reference Eldredge, Thompson, Brakefield, Gavrilets, Jablonski, Jackson, Lenski, Lieberman, McPeek and Miller2005).
While there is evidence for directional selection for ever-larger body size of marine chordates (Heim et al. Reference Heim, Knope, Schaal, Wang and Payne2015), stasis within invertebrate lineages is more commonly documented (Hunt Reference Hunt2007; Hunt and Rabosky Reference Hunt and Rabosky2014; Hunt et al. Reference Hunt, Hopkins and Lidgard2015; Witts et al. Reference Witts, Landman, Hopkins and Myers2020, Reference Witts, Myers, Garb, Irizarry, Larina, Rashkova and Landman2022). This “paradox of stasis,” which violates Cope's rule, could be the result of the counterbalancing selective forces of (1) increased body size to enhance survival and (2) earlier reproductive onset in smaller-bodied organisms (Ramirez Llodra Reference Ramirez Llodra2002; Kingsolver and Pfennig Reference Kingsolver and Pfennig2004; Kingsolver and Huey Reference Kingsolver and Huey2008; Kruuk Reference Kruuk2017; Payne and Heim Reference Payne and Heim2020). Juveniles need to achieve large size to escape predation or gain sufficient body volume to maintain homeostatic functions. Simultaneously, selection pressures for earlier initiation of reproduction and other life-history strategies for increased fecundity detract resources from growth. Selection for increased fecundity could place an efficiency limit on body size; once the gastropod is large enough to effectively feed and evade predation, resources are reallocated to reproduction (Ramirez Llodra Reference Ramirez Llodra2002 and references therein). An additional set of counterbalancing forces in the size-versus-fecundity efficiency calculation is the initial size of the eggs and subsequent larvae. Rollinson and Rowe (Reference Rollinson and Rowe2015) demonstrate positive selection for larger juveniles, but with depleting return on investment at ever-increasing juvenile size, which is balanced by selection on adults for high fecundity. Therefore, especially in clades engaging in r-selected reproductive strategy, parents should not “overinvest” in the size of each offspring (Rollinson and Rowe Reference Rollinson and Rowe2015). This limits the initial size of each juvenile and produces an early disadvantage against large adult size (Rollinson and Rowe Reference Rollinson and Rowe2015). Despite observations of significant increase in maximum size throughout turritelline evolutionary history (Figs. 3A, 4, Supplementary Fig. 3), the clade appears to have retained an r-selected life history. Based on isotope sclerochronology, their life history generally shows rapid growth to adult size in their first year of life followed by an additional year or two of reduced growth rate associated with energy reallocation toward reproductive fitness (Allmon et al. Reference Allmon, Jones and Vaughan1992, Reference Allmon, Jones, Aiello, Gowlett-Holmes and Probert1994; Jones and Allmon Reference Jones and Allmon1995; Andreasson and Schmitz Reference Andreasson and Schmitz1996, Reference Andreasson and Schmitz1998, Reference Andreasson and Schmitz2000; Schmitz and Andreasson Reference Schmitz and Andreasson2001; Teusch et al. Reference Teusch, Jones and Allmon2002; Latal et al. Reference Latal, Piller and Harzhauser2006; Haveles and Ivany Reference Haveles and Ivany2010; Allmon Reference Allmon2011; Huyghe et al. Reference Huyghe, Merle, Lartaud, Cheype and Emmanuel2012; Waite and Allmon Reference Waite and Allmon2013, Reference Waite and Allmon2016; Baltzer et al. Reference Baltzer, Mokeddem, Goubert, Lartaud, Labourdette, Fournier, Bourillet, Maanan and Robin2015; Anderson et al. Reference Anderson, Hendy, Johnson and Allmon2017; Ivany et al. Reference Ivany, Pietsch, Handley, Lockwood, Allmon and Sessa2018; Anderson and Allmon Reference Anderson and Allmon2020). The maximum size of turritelline gastropods is likely limited by their short maximum life spans and apparently near-universal attainment of reproductive age and associated decline in growth rate at around 1 year of age. This strongly conserved life-history strategy could provide a constraint on the upper bound of turritelline species size.
Latitudinal Trends
Soon after their Jurassic origin, turritellines have a midlatitude (25°N to 45°N) Tethyan distribution (Fig. 5B). In the Neogene, fewer tropically centered range distributions and an expansion of turritellines into Southern Hemisphere temperate latitudes (30°S to 50°S) are both associated with a significant decrease in average species body size (Fig. 5D) (Allmon Reference Allmon2007). One possible explanation for reduction in size in cooler, temperate zones observed during the Neogene range contraction is that metabolic rate is depressed for poikilotherms in cooler conditions, thereby reducing growth rates (Allmon Reference Allmon2007). This is consistent with work by Watson et al. (Reference Watson, Peck, Tyler, Southgate, Tan, Day and Morley2012), who found smaller sizes (and thinner shells) in gastropods toward the poles due to the challenges of calcification under colder temperatures. Global cooling and nutrient redistribution in the mid-Cenozoic likely led to a shift in the distribution of turritelline-dominated assemblages and restricted the ranges of individual species (Allmon Reference Allmon2007; Anderson and Allmon Reference Anderson and Allmon2020). Following their Jurassic origin and Cretaceous expansion, turritellines were distributed in warm, high-nutrient conditions and were especially abundant in carbonate-rich environments (Allmon Reference Allmon2007). The global shift to warm, low-nutrient carbonate environments (tropics) as these environments evolved and cold, high-nutrient conditions during late Cenozoic cooling correspond to turritelline range retraction to a more temperate latitudinal distribution where there were opportunities for multiple, seasonal nutrient blooms and abundant upwelling zones compatible with turritellines’ affinity for high-nutrient conditions (Angel 1977; Allmon Reference Allmon2011; Crame Reference Crame2020). In a study on Turritella abrupta, the largest species of turritelline gastropods, Anderson and Allmon (Reference Anderson and Allmon2020) found that it followed the common turritelline growth pattern of rapid growth in the first year followed by reduced growth rates in the subsequent 4 years. This species experienced a range contraction following Miocene cooling and reduction in carbonate deposition and loss of high-nutrient waters in the western Atlantic after the closure of the Central American Seaway (CAS; Anderson and Allmon Reference Anderson and Allmon2020). Sang et al. (Reference Sang, Friend, Allmon and Anderson2019) found turritelline larval shell size increased following the CAS closure, interpreted as multiple lineages transitioning to non-planktotrophic larva, indicating increased parental investment following the decreased availability of planktic nutrients. The range restriction and ultimate extinction of these species are vignettes that might support global cooling and latitudinal nutrient distribution as an explanation for clade-wide range constriction of turritellines and size reduction at temperate latitudes. Reduction in latitudinal range is also observed in several gastropod families that originated in the Tethys and experienced range contraction during the Cenozoic (Allmon Reference Allmon1992 and references therein).
Other studies of marine mollusks have found complex patterns in the relationship of body size with latitude, often without a clear underlying intrinsic or extrinsic driving force. Roy et al. (Reference Roy, Jablonski and Martien2000) found no significant relationship between latitude and body size in modern bivalves (915 species across 70° of latitude) except at the species and family levels on regional scales. In another study of modern bivalves (297 species across 80° of latitude), Moss et al. (Reference Moss, Ivany, Judd, Cummings, Bearden, Kim, Artruc and Driscoll2016) found no significant variation of maximum size with latitude but did find evidence that this resulted from changes in life history, with longer maximum life spans counterbalancing slower growth rates at higher latitudes. In contrast, there do not appear to be significant changes in life span to explain shifts in turritelline body size through time and space (Allmon et al. Reference Allmon, Jones and Vaughan1992, Reference Allmon, Jones, Aiello, Gowlett-Holmes and Probert1994; Jones and Allmon Reference Jones and Allmon1995; Andreasson and Schmitz Reference Andreasson and Schmitz1996, Reference Andreasson and Schmitz1998, Reference Andreasson and Schmitz2000; Schmitz and Andreasson Reference Schmitz and Andreasson2001; Teusch et al. Reference Teusch, Jones and Allmon2002; Latal et al. Reference Latal, Piller and Harzhauser2006; Haveles and Ivany Reference Haveles and Ivany2010; Huyghe et al. Reference Huyghe, Merle, Lartaud, Cheype and Emmanuel2012; Waite and Allmon Reference Waite and Allmon2013, Reference Waite and Allmon2016; Baltzer et al. Reference Baltzer, Mokeddem, Goubert, Lartaud, Labourdette, Fournier, Bourillet, Maanan and Robin2015; Anderson et al. Reference Anderson, Hendy, Johnson and Allmon2017; Ivany et al. Reference Ivany, Pietsch, Handley, Lockwood, Allmon and Sessa2018; Anderson and Allmon Reference Anderson and Allmon2020). Berke et al. (Reference Berke, Jablonski, Krug, Roy and Tomasovych2013) used a synoptic dataset of modern marine bivalves (4845 species in 59 families over all latitudes) to test the relationships between body size and temperature, productivity, and latitude. Significant relationships with latitude were found for specific lineages or geographic regions, but no global patterns were revealed. They concluded that relationships between size and latitude are more likely the product of selection differences between lineages and regions and not a direct response to abiotic conditions associated with latitude (Smith and Roy Reference Smith and Roy2006; Berke et al. Reference Berke, Jablonski, Krug, Roy and Tomasovych2013).
No consistent correlation between paleolatitudinal range with shell length was recovered for this dataset (Supplementary Fig. 7), though the underlying variability in fossil locality ranges and error in paleolatitude transformation limits the interpretation of any emergent patterns. The clearly observed pattern of reduced mean body size at higher latitudes in turritellines is likely the result of a directional shift during the Neogene (Fig. 5D). If the populations that seeded turritelline expansion into the Southern Hemisphere during the Neogene were derived from small-bodied species or local conditions advantaged small-bodied species, this could have provided an opportunity for the differential diversification of the clade into small body size during their range shift to temperate Southern Hemisphere latitudes (Uyeda et al. Reference Uyeda, Hansen, Arnold and Pienaar2011). A comprehensive phylogenetic treatment of southwestern Pacific species could determine whether this was itself an example of phyletic nanism (decreasing size during the history of the clade; Gould and MacFadden Reference Gould and MacFadden2004) or a phyletic radiation associated with maintenance of small size from small-bodied species that first arrived in the region.
Ecological Size Limitations
Turritelline gastropods appear to have reached both a minimum body size as well as a maximum body size, as continued evolution throughout the Cenozoic has not produced minimum or maximum shell lengths much outside the early evolutionary history of the lineage (Figs. 3A, 4). There are likely both physiological and ecological limits on the minimum effective size of the turritelline body plan, dependent as it is on withdrawal into the high-spired shell and mainly suspension feeding using an elongated mantle cavity, while increasingly larger sizes cannot be maintained by the metabolic rate and ecological strategy of the clade (Stanley Reference Stanley1973; Blanckenhorn Reference Blanckenhorn2000; Humphries Reference Humphries, Hildrew, Raffaelli and Edmonds-Brown2017; Anderson and Allmon Reference Anderson and Allmon2020). A life span longer than 2–3 years is rare in turritellines (Allmon Reference Allmon2011; Anderson and Allmon Reference Anderson and Allmon2020). This could be an additional limitation on evolution of larger body sizes, with very large size dependent on evolution of traits associated with longevity, which may show a degree of phylogenetic inertia (Saulsbury et al. Reference Saulsbury, Moss, Ivany, Kowalewski, Lindberg, Gillooly and Heim2019). Life-span variability is more common in bivalves (Moss et al. Reference Moss, Ivany, Judd, Cummings, Bearden, Kim, Artruc and Driscoll2016).
Campaniloid gastropods are some of the largest (lengths of tens of centimeters) and fastest-growing gastropods (300 cm3 of aragonite per year), with extant and fossil record sclerochronology indicating life spans up to 5 years (de Winter et al. Reference de Winter, Vellekoop, Clark, Stassen, Speijer and Claeys2020). In another example, gigantic cypraeid gastropods (lengths of tens of centimeters) have repeatedly evolved during the Cenozoic while the majority of the cowrie clade remains small (Dominici et al. Reference Dominici, Fornasiero and Giusberti2020). These fast-growing gastropods live in tropical, high-seasonality environments with warm summer temperatures that may support their large size (de Winter et al. Reference de Winter, Vellekoop, Clark, Stassen, Speijer and Claeys2020; Dominici et al. Reference Dominici, Fornasiero and Giusberti2020). As in the example of the largest turritelline species, T. abrupta, environments with both high nutrients and favorable conditions for calcification, including warm waters, may have been limited during turritellines’ evolutionary history, thereby limiting maximum size expansion (Anderson and Allmon Reference Anderson and Allmon2020).
The Neogene expansion of turritellines into temperate Southern Hemisphere latitudes with a corresponding decrease in body size suggests that the benefits of small body size (e.g., higher fecundity per adult mass, higher generational turnover, and/or larger population size) are selected for in this geographic region (Nekola et al. Reference Nekola, Barker, Cameron, Pokryszko, Smith and Lyons2013). It might also be the case that reduced predation in cooler-water habitats (Aronson and Blake Reference Aronson and Blake2001; Aronson et al. Reference Aronson, Thatje, Clarke, Peck, Blake, Wilga and Seibel2007; Freestone et al. Reference Freestone, Torchin, Jurgens, Bonfim, López, Repetto, Schlöder, Sewall and Ruiz2021) results in decreased selection for large body size during their Neogene expansion.
Environmental Trends through Time
Turritellines evolved and expanded their range and body size throughout the late Mesozoic. Given ecological opportunities for high-spired gastropods associated with increased Mesozoic food availability (Allmon and Martin Reference Allmon and Martin2014) and selective pressures associated with the Mesozoic marine revolution (Harper Reference Harper, Kelley, Kowalewski and Hansen2003; Tackett Reference Tackett2016), niche space was available for the diversification of small, high-spired gastropods (Vermeij Reference Vermeij1987) (Figs. 3A, 4). Vermeij (Reference Vermeij2010) advocated for a driven increase in size for eight guilds of suspension feeders (including turritellines) when comparing eight time bins of Cenozoic collections of maximum specimen size and argued that changes in nutrient availability and delivery favored the growth of suspension feeders. Our time series analysis of 11 time bins does not find support for a driven increase in mean or maximum turritelline shell length in the Cenozoic, nor do proxies of global environmental conditions (δ34S, 87Sr/86Sr, δ13C, δ18O, pH) correlate with turritelline shell length (Fig. 4, Supplementary Figs. 1, 2). Turritelline size changes are most strongly associated with regional environmental conditions as described earlier, and global binning of size data in comparison to global environmental proxy data has unsurprisingly failed to yield meaningful trends.
Conclusions
Globally and throughout turritelline gastropod history, their size evolution exhibits stasis, an increase in size variance (partially driven by increasing sample size), and no support for Cope's rule. The observed directional, selective decrease in turritelline minimum size in the Neogene runs counter to the assumptions of most size evolution models that originate with a minute ancestor that then passively diffuses or selectively evolves to larger mean and maximum sizes. The expectation that species should grow ever-larger conflicts with the evolutionary advantages of small size, namely faster generational turnover and larger population sizes, species-level traits that result in more opportunities for genetic variance. In the case of turritelline gastropods, the accumulation of size variance in their Mesozoic evolutionary history provided the opportunity for substantial decrease in average body size during a Cenozoic range shift into Southern Hemisphere temperate latitudes.
The increase in variance and the stable mean of turritelline gastropod clade-level body size is explained by the broad geographic range of the clade, which limited the opportunity for consistent directional selection. Stasis as the result of a balance between selection for increasing adult size to support resource acquisition versus fecundity in r-selected species is reinforced by the observation that even in high-nutrient, high-carbonate environments, turritellines only add a few years to their maximum life span (Anderson and Allmon Reference Anderson and Allmon2020). The heavily r-selected reproductive strategy of turritellines is an intrinsic limitation that may be responsible for preventing other life-history strategies (that may be associated with larger size) from being explored. Turritellines’ life-history traits of short life span, rapid development, and high reproductive output allow for population booms that characterize their abundant fossil record (Allmon Reference Allmon2007; Plotnick Reference Plotnick2018; Shin et al. Reference Shin, Allmon, Anderson, Kelly, Hiscock and Shin2020).
Turritellines’ latitudinal distribution throughout their evolutionary history suggests the clade responded (within limits) to changes in global climate regimes through range shifts with corresponding size changes. Turritellines’ moderate size and short life span persist across global climate regime changes, indicating physiological size limitations due to growth rate and longevity (Anderson and Allmon Reference Anderson and Allmon2020). A lack of correlation with environmental proxies suggests that local and regional ecological heterogeneity may be more important in shaping turritelline body-size distributions than conditions expected to vary with latitude (Anderson and Allmon Reference Anderson and Allmon2020; Shin et al. Reference Shin, Allmon, Anderson, Kelly, Hiscock and Shin2020). Turritelline gastropods’ morphological, reproductive, and life-history strategies remain almost unchanged over their 160 Myr history, suggesting their adaptive resilience (Allmon Reference Allmon2011; Anderson and Allmon Reference Anderson and Allmon2020). Reduced body size at high latitudes in turritellines contrasts with observations of decreased growth rate, increased longevity, and greater ultimate size for bivalves at higher latitudes (Moss et al. Reference Moss, Ivany, Judd, Cummings, Bearden, Kim, Artruc and Driscoll2016), revealing a major difference in approach to thriving in low-nutrient environments among suspension-feeding molluscan classes.
Multiple studies have addressed how body size changes through time and evaluated the latitudinal distribution of size. This work contributes a unique case of the evolution of a clade from a moderately sized, unspecialized ancestor and finds support for directional selection toward small body size accompanied by passive size increase as two processes driving the evolution of clade size through time. We find that regional habitat heterogeneity is a more important extrinsic driver for species size than environmental characteristics that vary with latitude.
Turritelline gastropods provide a taxonomically diverse, long-lasting, and geographically dispersed fossil record with which to examine size trends through time. Our study adds to a growing body of recent literature suggesting that directionless patterns of size evolution may be more frequent, especially in invertebrates, than commonly recognized (Klompmaker et al. Reference Klompmaker, Schweitzer, Feldmann and Kowalewski2015; Zhang et al. Reference Zhang, Augustin and Payne2015; Witts et al. Reference Witts, Landman, Hopkins and Myers2020, Reference Witts, Myers, Garb, Irizarry, Larina, Rashkova and Landman2022).
Acknowledgments
Thanks to A. Hendy for his turritelline holotype length contributions to the synoptic fossil dataset and to M. Goldenberg for assistance with the initial turritelline gastropod species database. C.P. appreciates discussions with G. Hunt regarding PaleoTS and also thanks M. Kosloski and U. Smith for rides to PRI and conversations about molluscan paleontology along the way. J. Bien of Cornell provided statistical guidance to M.G. B. D. Solomon consulted on permutation analyses. W. E. Bemis, J. S. Crampton, A. G. Drake, P. M. Monarrez, P. M. Novack-Gottshall, J. A. Scalfani, and two anonymous reviewers provided thorough and constructive comments on previous versions of this work. This work was supported in part by National Science Foundation grants EAR-0719642 and EAR-1053517 to W.D.A. and the donors to the Director's Discretionary Fund at the PRI.
Declaration of Competing Interests
The authors are not aware of any competing interests.
Data Availability Statement
Data available from the Dryad Digital Repository: https://doi.org/10.5061/dryad.p5hqbzkqc.


 Open access