
No CrossRef data available.
Article contents
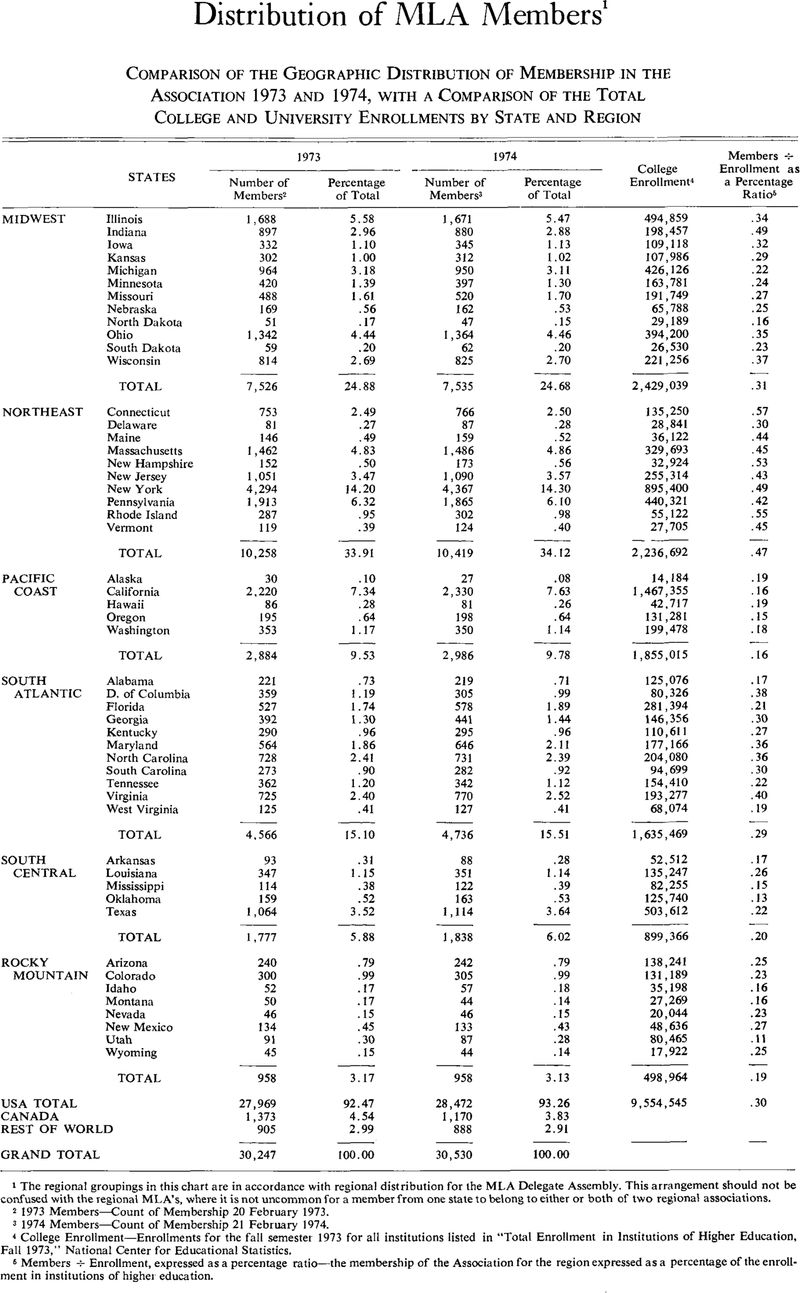
Distribution of MLA Members
Published online by Cambridge University Press: 01 December 2020
Abstract
An abstract is not available for this content so a preview has been provided. Please use the Get access link above for information on how to access this content.
- Type
- Other
- Information
- Copyright
- Copyright © 1974 by The Modern Language Association of America
Footnotes
1
The regional groupings in this chart are in accordance with regional distribution for the MLA Delegate Assembly. This arrangement should not be confused with the regional MLA's, where it is not uncommon for a member from one state to belong to either or both of two regional associations.
References
2 1973 Members—Count of Membership 20 February 1973.
3 1974 Members—Count of Membership 21 February 1974.
4 College Enrollment—Enrollments for the fall semester 1973 for all institutions listed in “Total Enrollment in Institutions of Higher Education, Fall 1973,” National Center for Educational Statistics.
5 Members ÷ Enrollment, expressed as a percentage ratio—the membership of the Association for the region expressed as a percentage of the enrollment in institutions of higher education.