

The American Political Science Association serves a diverse membership in the United States and around the globe. From 2015 onwards, APSA required members to opt in or opt out of providing demographic information. We compared APSA's administrative membership data for the period 2017–2019 (pre-COVID-19 pandemic) to data from the NSF's Survey of Earned Doctorates of PhDs awarded in political science or government for 2019. Our findings are illustrated below. ■
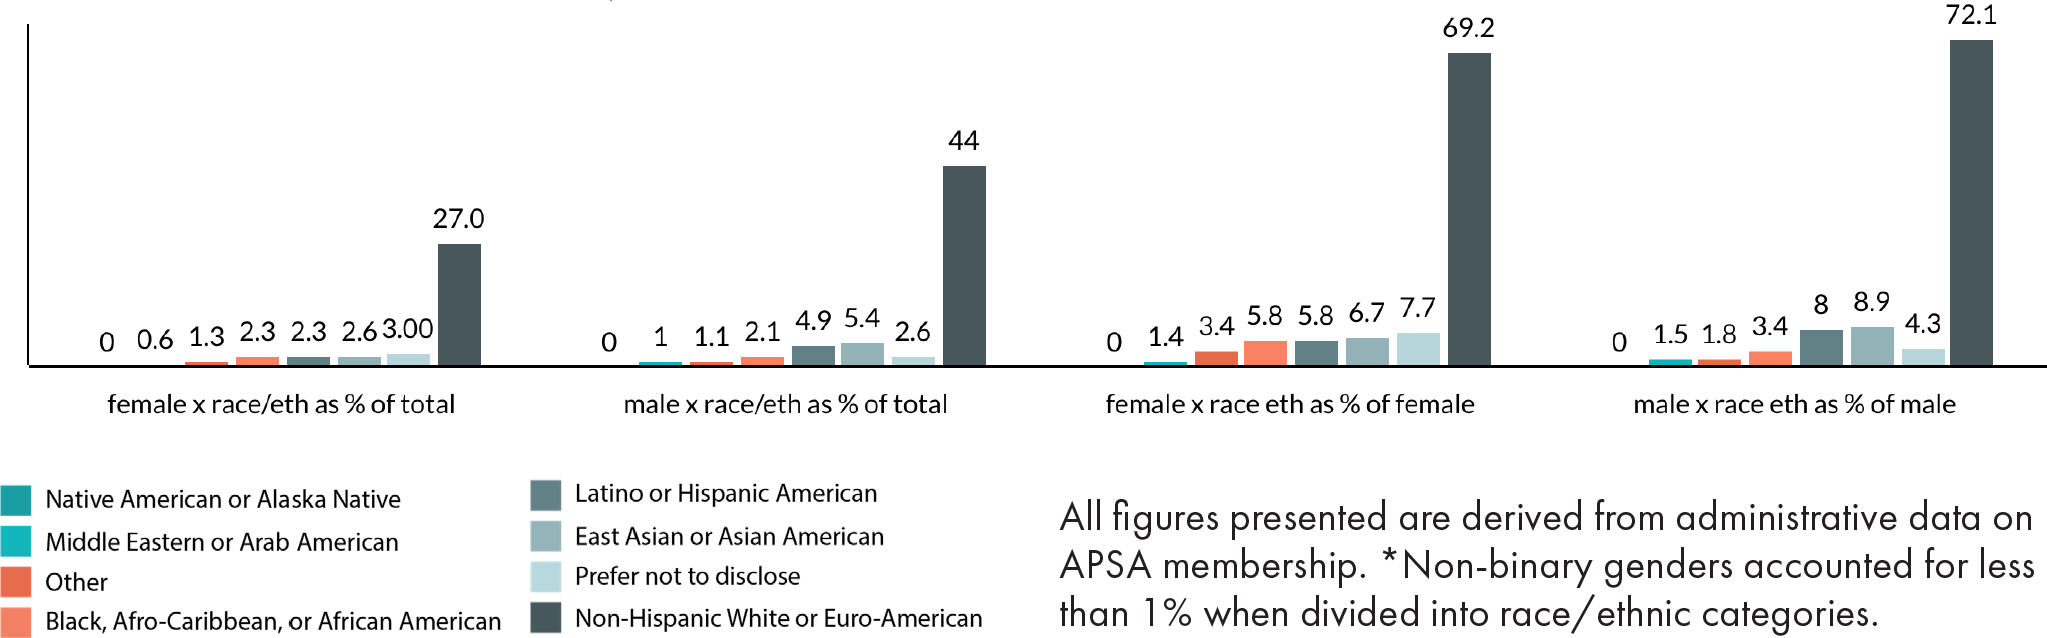
Figure 1 NSF Survey of Earned Doctorates: PhDs Awarded in Political Science or Government in 2019
Figure 2 Pre-COVID Proportions of Groups of Color Among Binary Genders, 2017–2019*
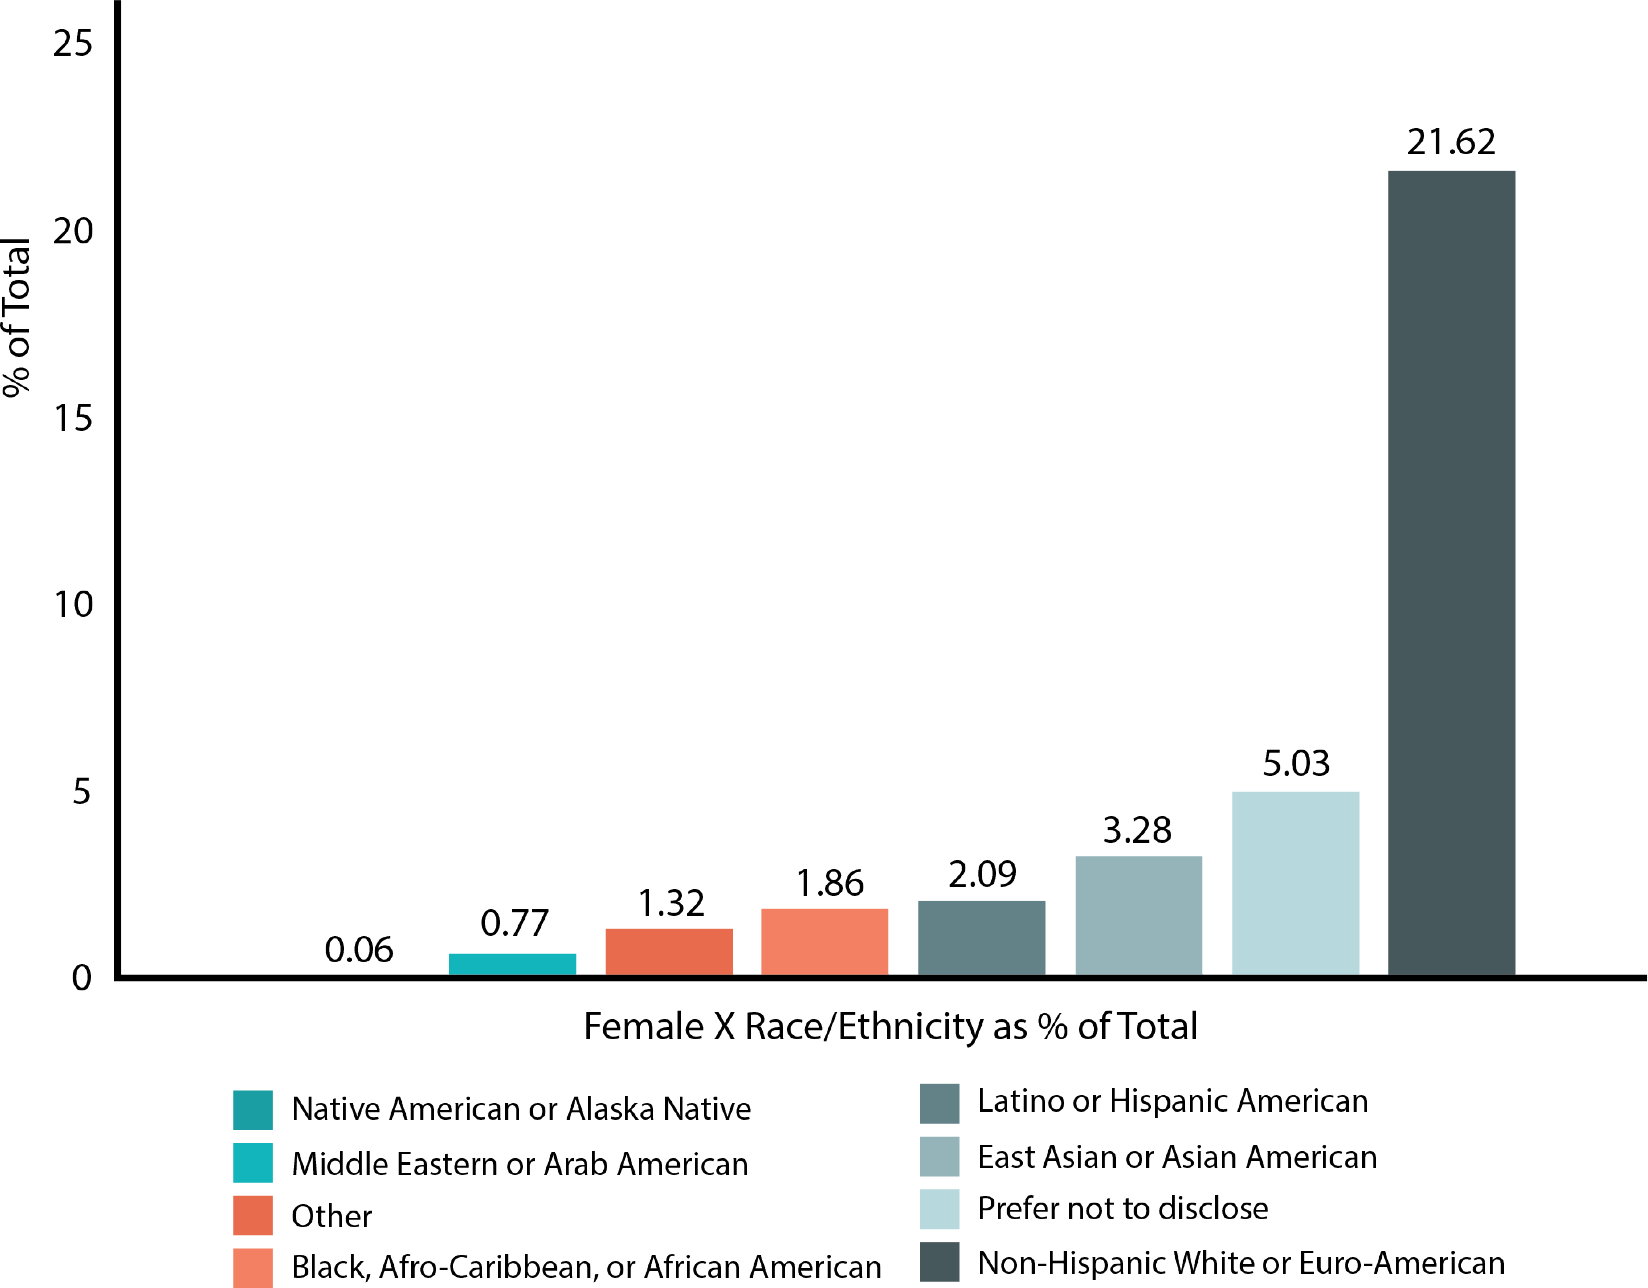
Figure 3 Female Race/Ethnicity as % of Total Membership
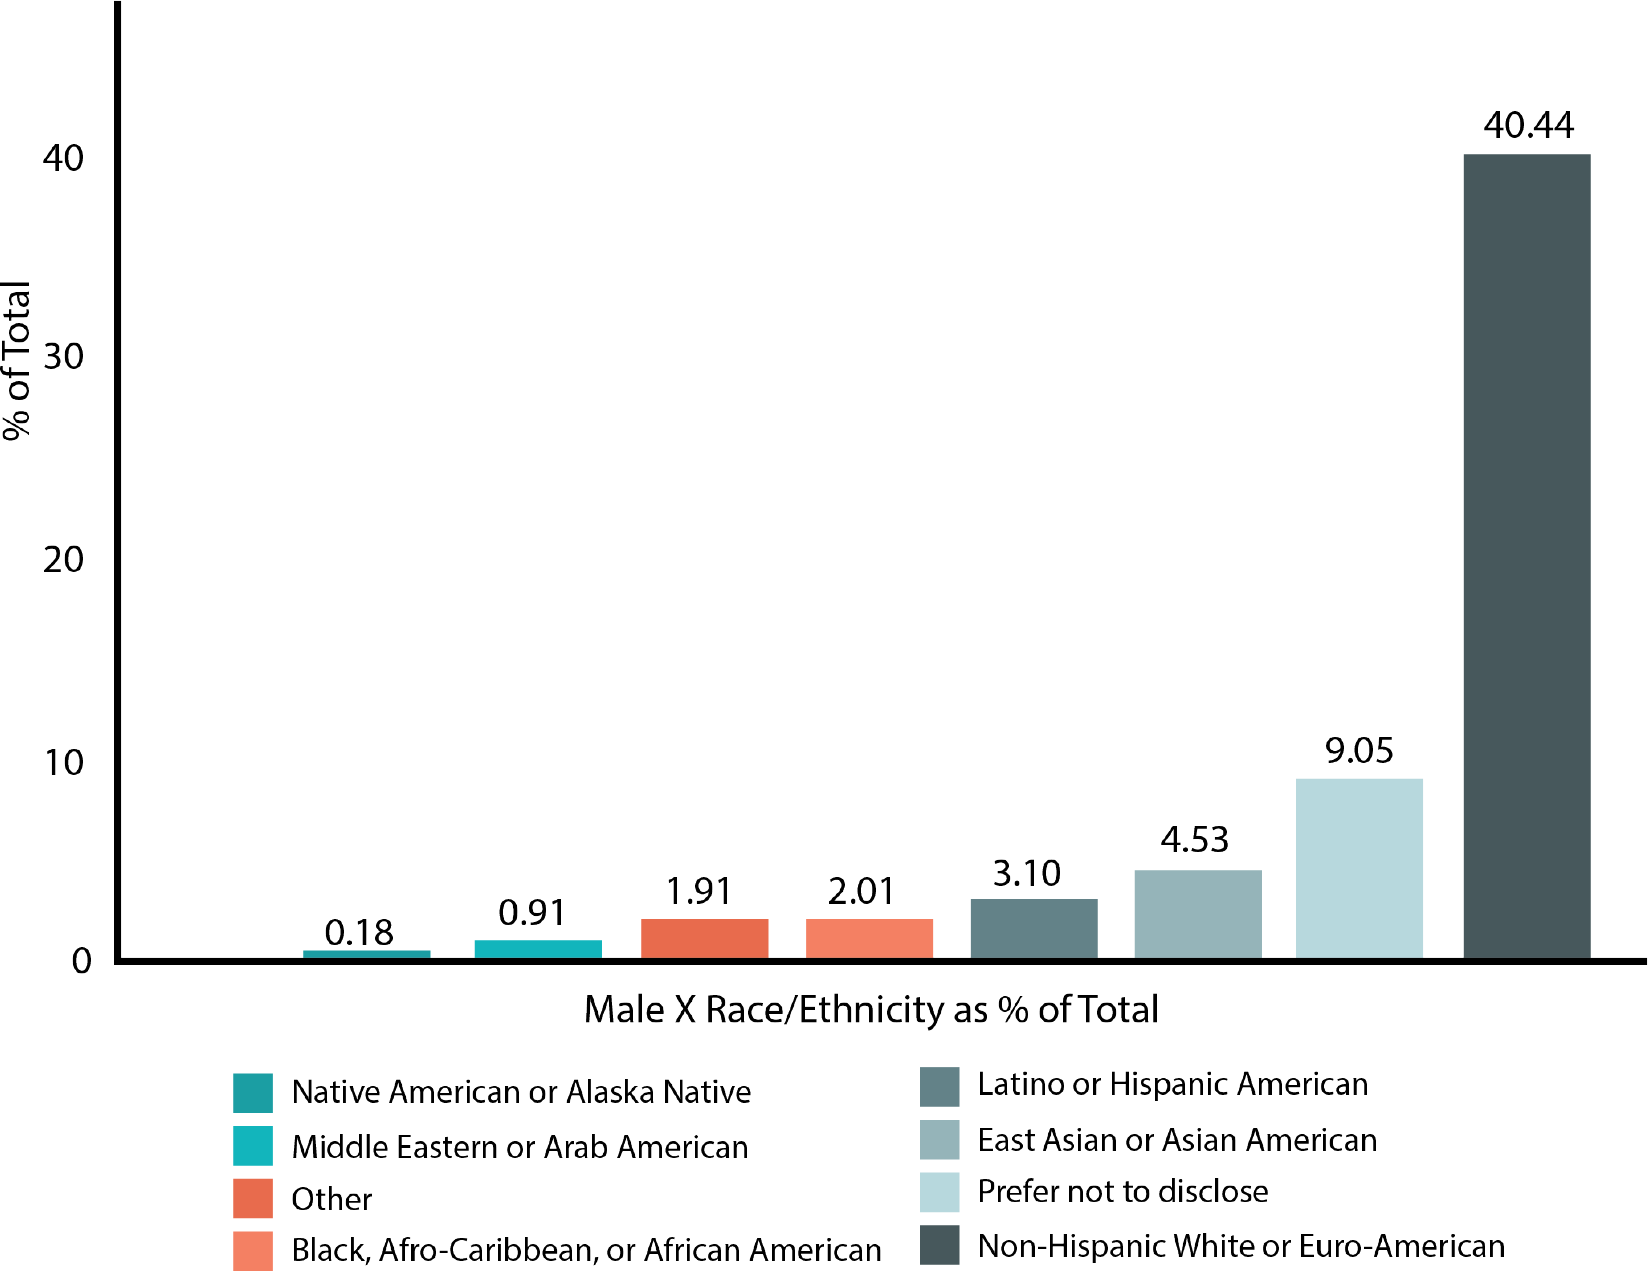
Figure 4 Male Race/Ethnicity as % of Total Membership


