
Editor-in-Chief
Victor Asal, University at Albany, State University of New York
Co-Editors
Mitchell Brown, Auburn University (Scholarship of Teaching and Learning Section)
Mark L. Johnson, Minnesota State Community and Technical College (Reflections Section)
Joseph W. Roberts, Roger Williams University (Political Science Instruction Section)
J. Cherie Strachan, Virginia Commonwealth University (Books, Teaching Tools, and Educational Resources Section)
Managing Editors
Grace Sorci, University at Albany, State University of New York
Olivia Vecchio, University at Albany, State University of New York
Editorial Assistants
Stephanie Bickerstaff, Auburn University
Chiara Sinigaglia, Roger Williams University
Editorial Board
Lawrence Baum, The Ohio State University
Elizabeth Bennion, Indiana University South Bend
John Berg, Suffolk University (Emeritus)
Jeffrey Bernstein, Eastern Michigan University
Marijke Breuning, University of North Texas
Ellen Claes, Katholieke University of Leuven
John Craig, Leeds Beckett
Michelle Deardorff, University of Tennessee Chattanooga
Rebecca Ann Glazier, University of Arkansas–Little Rock
Kim Quaile Hill, Texas A & M University
John Ishiyama, University of North Texas
Chris Lawrence, Middle Georgia State University
Darrell Lovell, Lone Star College
Elizabeth Matto, Rutgers University
Allison Rios Millett McCartney, Towson University
Mary McHugh, Merrimack College
Gabriela Pleschová, Comenius University
Chad Raymond, Salve Regina University
Grant Reeher, Syracuse University
Erin Richards, Cascadia Community College
Mark Carl Rom, Georgetown University
Dick Simpson, University of Illinois at Chicago
James Sloam, University of London- Royal Holloway
Dan Smith, NW Missouri State
Nancy Thomas, Tufts University
Sherri Wallace, University of Louisville
Carol Weissert, Florida State University
Support for the journal is provided by Taylor & Francis, University at Albany, State University of New York, Auburn University, Minnesota State Community and Technical College, University of South Dakota, Roger Williams University, and Central Michigan University.
INTRODUCTION
The editorial team for The Journal of Political Science Education has now been running the journal for the last six years with support from APSA and specifically from Jon Gurstelle, director of publications for APSA. This is our final year. We will be turning over the journal to the new team on July 31st of 2022. In our last year, we believe our efforts have continued well, and we would like to thank our team of managing editors and editorial assistants at the University at Albany, at Auburn University, and at Roger Williams University, all of whom have done a very good job. We have very much enjoyed our time working on the Journal of Political Science Education and look forward to the excellent work that Charity Butcher and her team—Alasdair Blair, Tavishi Bhasin, Elizabeth Gordon, Maia Carter Hallward, Alison Rios Millett McCartney, and Simon Usherwood—will do during their tenure as editors.
HIGHLIGHTS OF OUR YEAR
In our last year, we continued to get excellent submissions from a variety of authors across all four sections. Once again, the Scholarship of Teaching and Learning (SoTL) section received the most submissions—but only by a small margin of 2% over the Political Science Instruction section. We continued to get relatively the same amount of submissions to the Books, Teaching Tools, & Educational Resources section as we did last year, but significantly fewer submissions for the Reflections on Teaching and the Academy section. We continue to use our twitter handle (@JPSE_Editors) to tweet out articles as they are released, as well as other political science related pedagogy tweets. This year, we have 982 followers, which is 170 greater than last year.
In terms of our articles, we received 45% percent from women—which again is a small decline from last year, which was 47% (Table 1). We continued to get submissions from a wide variety of authors by rank, with similar submissions from all ranks, but the most submissions overall from associate professors (Table 12). Once again, the majority of our submissions have come from people at public universities. We would very much like to thank our reviewers—not one of whom rejected a request for a review. We would also like to thank our editorial board, who were once again very helpful with reviewer suggestions and the reviewing process.
Table 1: Authors by Gender (percentage of total—includes co-authors)

STAFFING
Our staff at the Journal of Political Science Education consists of five co-editors, who split their time between working as a team and managing their own sections of the journal. Two student managing editors and two editorial assistants work part time on the journal. Our current managing editors are Grace Sorci and Olivia Vecchio. Both managing editors are students at the University at Albany SUNY, while our editorial assistant, Chiara Sinigaglia, is a student at Roger Williams University.
PRODUCTION AND DELIVERY: AUTHOR DEMOGRAPHICS
The demographic distribution of the Journal of Political Science Education authors are reported in tables 1, 2, and 3. Currently, 45% of our article authors are women and 55% are men—nearly an even split. Our authors are spread across different ranks, with associate professors being responsible for more submissions than any other rank again this year, accounting for 22% of our authors. As visible in table 3, 21.3% of our submissions came from authors overseas, which is consistent with the previous year. Submissions came from seven countries other than the United States. Table 4 shows the distribution of authors by type of institution for accepted papers. Of this year’s authors, 65.4% were affiliated with public institutions.
Table 2: Authors by Rank (percentage of total—includes co-authors, all original submissions)

Table 3: Author by Country of Submission (percentage of total—includes co-authors, all accepted original submissions)
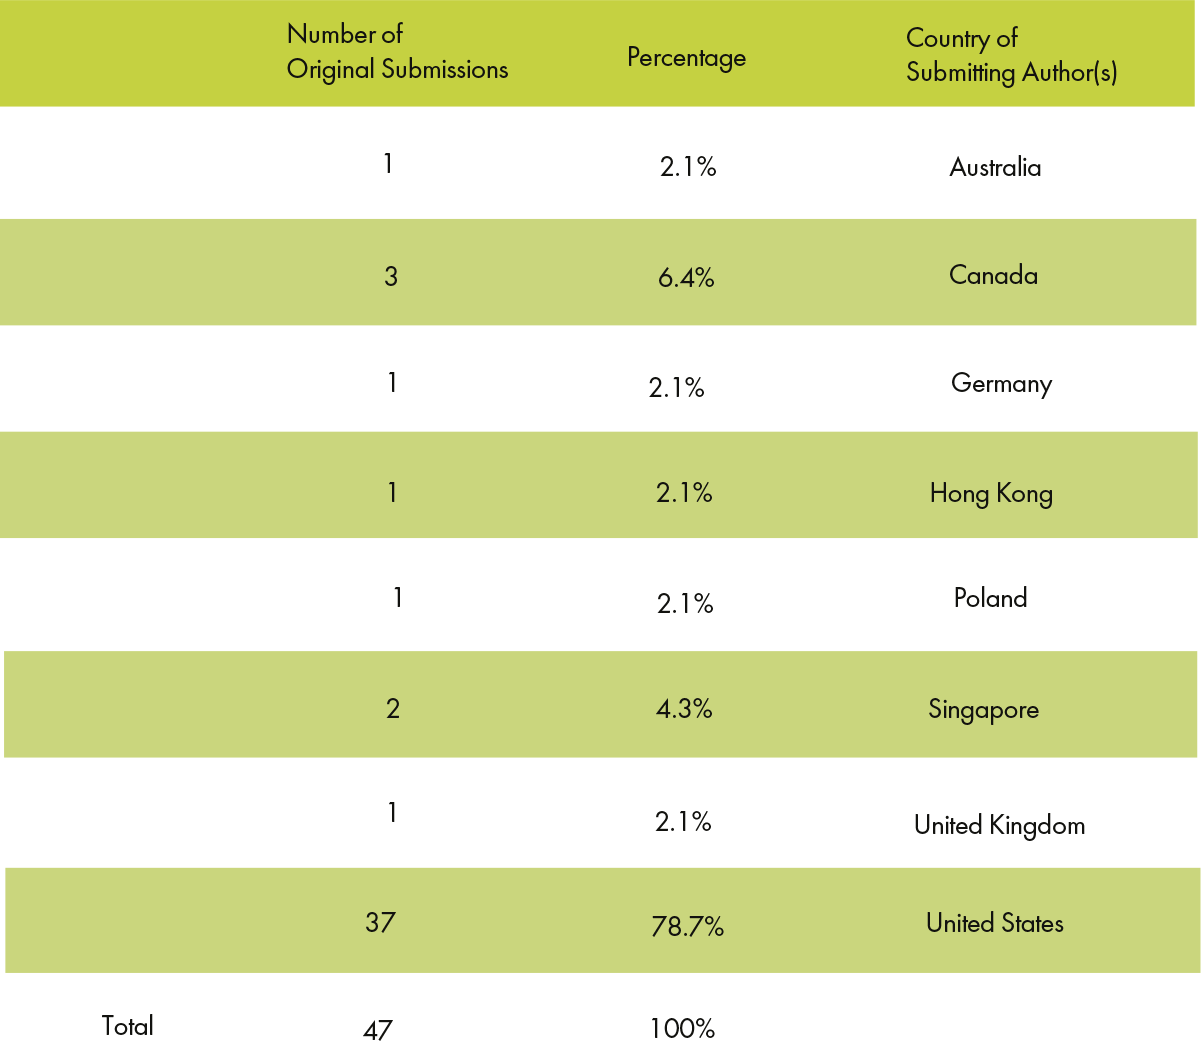
Table 4: Distribution of Authors by Type of Institution (Percentage of Total - Includes Co-Authors)

CONTENT AND TREATMENT OF MANUSCRIPTS
Table 5 shows the percentage of articles submitted that were directed at being submitted as original articles (both SoTL and Political Science Instruction sections), review articles and reflection articles. The number of manuscripts submitted was 47 this year. Table 6 shows the manuscript decisions for manuscripts. Our current rejection rate is 31.9%. Table 7 presents information on reviewer statistics. The percentage of completed reviews is 100% this year. Table 8 provides data on average reviewer turnaround time. This year on average, our editorial board’s turn around rate was 30 days and our reviewer turn around date was 31 days, down from 47 and 42 days, respectively, last year. We had somewhat fewer submissions this year as well. ▪
Table 5: Types by Submission (Percentage of Total, Original Submissions)

Table 6: Manuscript Decision—Total Submission Decision (Original)

1. This is the percentage of all rejected manuscripts, not of all new manuscripts
Table 7: Reviewer Statistics
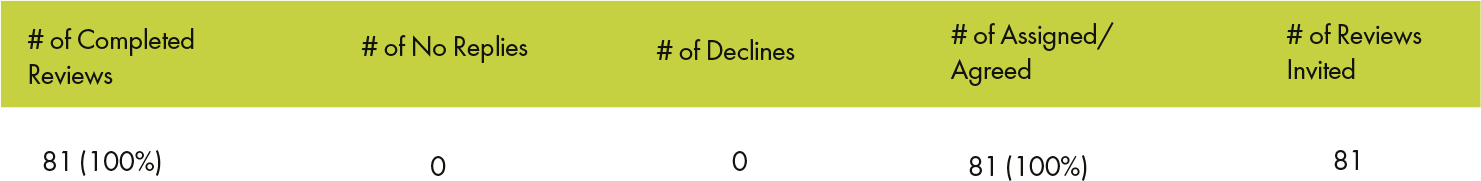
Table 8: Average Reviewer Turnaround Time

Table 9: Editorial Board by Gender
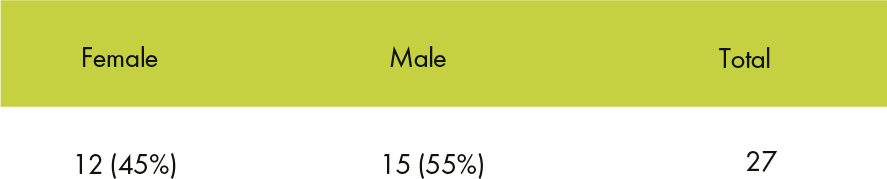
Table 10: Distribution of Editorial Board by Type of Institution (percentage of total)

Table 11: Editorial Board by Location (percentage of total)

Table 12: Editorial Board by Rank (percentage of total)

Table 13: Editorial Board by Rank (percentage of total)

Table 14: Comparison


