


I. INTRODUCTION
The laboratory based divergent beam X-ray diffractometer can provide a wealth of structural and microstructural information about a wide variety of materials. However, to successfully interpret the data, the operator must have an aligned instrument and properly take into consideration the aberrations inherent to the para-focusing optics. One method to accomplish this is to use standards to evaluate instrument performance. The National Institute of Standards and Technology (NIST) certify a variety of standard reference materials (SRM) to address specific aspects of the instrument performance. This paper describes SRM 640d (NIST, 2009), the fifth generation of this powder diffraction standard, which is certified with respect to the lattice parameter. It consists of approximately 7.5 g of silicon powder specifically prepared to have minimal line broadening and is commonly used for calibrating powder diffractometers for the line position and line shape.
II. MATERIAL
The silicon feedstock for SRM 640d was prepared from ultrahigh purity, float-zone intrinsic silicon obtained from Siltronic AG, Munich, Germany. (Certain commercial equipment, instruments, or materials are identified in this in order to adequately specify the experimental procedure. Such identification does not imply recommendation or endorsement by the National Institute of Standards and Technology nor does it imply that the materials or equipment identified are necessarily the best available for the purpose.) Lattice parameter measurements of the single-crystal silicon boules were performed on the NIST lattice comparison apparatus (Kessler et al., Reference Kessler, Henins, Deslattes, Nielsen and Arif1994). This provided a test of the material uniformity as well as a measurement of the lattice parameter from the as-supplied material that is traceable to le Système International d’unités (SI). A total of 11 crystal samples were taken from the boules and a total of 32 lattice comparison measurements were performed covering the longitudinal and radial boule directions. The relative lattice variation, Δd/d, of the input material inferred from these measurements was ±4.8×10⁻⁸ (95% confidence level) indicating the material was sufficiently uniform for use as a powder line position SRM to be certified for the lattice parameter. The boules were then crushed and jet milled to produce a narrow particle size distribution in the 1–10 μm range. Typical particle size data from laser scattering measurements are shown in Figure 1. The low end of the distribution is above 1 μm ensuring that diffraction data from SRM 640d would not display the effects of size broadening. The resulting powder was annealed in 31 lots of approximately 200 g each to remove the crystallographic defects that would otherwise lead to the strain broadening. Annealing was performed in quartz boats in gettered argon at a temperature of 1000 °C for 2 h (van Berkum et al., Reference van Berkum, Sprong, de Keijser, Delhez and Sonneveld1995). The furnace was evacuated and backfilled three

Figure 1. (Color online) Particle size distribution of silicon feed stock.

Figure 2. (Color online) The CDDBD is shown above with a horizontal cut away view below.
times before the start of each annealing run. Bottling was performed under argon to protect against humidity.
III. INSTRUMENTATION
The certification of SRM 640d was performed utilizing the NIST-built, ceramics division divergent beam diffractometer (CDDBD). This is a divergent beam diffractometer of Bragg–Brentano geometry that incorporates several advanced design features as discussed below. A rigorous analysis of data from this instrument requires knowledge of both the diffraction angle and the effective source-to-sample-to-detector distance. The determination of this distance is generally not possible as it is dependent on both the depth to which the X-rays penetrate the sample, which is in turn dependent on the packing density of the powder sample, and the z height. Models for both of these effects can be incorporated into the data analysis procedures. However, results are then dependent on the efficacy of these models, which cannot be tested until suitable parallel beam data are realized. Therefore, while the strict SI traceability of the results may be debated, an analysis using the fundamental parameters approach (Cheary and Coelho, Reference Cheary and Coelho1992) does link the refined lattice parameter to the emission spectrum of Cu K α thereby establishing plausible linkage to the SI.
The CDDBD, shown in Figure 2, is a θ-2θ diffractometer of essentially conventional layout, although it is built with several features not typically found in commercial equipment of this nature. The goniometer assembly consists of a pair of Huber 420 rotary stages each utilizing a worm gear driving a ring gear to produce a 360:1 gear ratio. These stages are mounted concentrically with the rotation axes horizontal allowing an automatic sample changer/spinner to be mounted. The goniometer was assembled using a specialized jig that aligned the two rotation axes to within the manufacturer’s specifications for both concentricity (3 μm) and parallelism (14 μrad). The optics, X-ray generator, tube shield, and sample changer were originally components of a Siemens D5000 diffractometer, ca. 1992. The detector arm also carries an adjustable counterweight to counteract the torque applied by the weight of the various detector configurations. Both stages incorporate Heidenhain optical encoders to measure the angle of the ring gear, to which the sample and detector stages are mounted. These encoders provide 36 000 features per rotation with ±4.8 μrad (±1 arcsec) accuracy. The output from both encoders was further subdivided to ≈1024 points per feature using the Heidenhain IK220 interpolation electronics resulting in ≈102 400 features per degree or ≈0.17 μrad (0.035 arcsec) precision. The use of optical encoders on both axes circumvents the inherent limit on angular accuracy, 121 μrad (25 arcsec), of the Huber 420 stage.
The CDDBD uses a sealed copper tube with a long fine focus operated at a power of 1.8 kW. The instrument is equipped with a variable divergence incident beam slit, 40-position sample changer/spinner, a graphite postsample monochromator, and a scintillation detector. The source size was approximately 12 mm×0.04 mm and the goniometer radius is fixed at 217.5 mm; the variable divergence slit was set nominally to 14 mrad (0.8°) for the collection of certification data. A 2-mm antiscatter slit was placed approximately 113 mm in front of the receiving slit of 0.2 mm corresponding to a divergence of 0.87 mrad (0.05°). The operation of the CDDBD was provided through control software written in LABVIEW. This software provides for a number of scan configurations including full range scans and individual peak scans with up to 25 separate peaks. It also provides for separate control of the θ and 2θ axes, which is required to perform a variety of alignment procedures. The X-ray tube is mounted so as to provide an adjustment of the source position vertically, the X-ray takeoff angle, and alignment of the line source with respect to the goniometer rotation axis. The entire apparatus is mounted on an optical table within a temperature controlled laboratory space where the nominal short-range control of temperature is ±0.1 K. The performance of the CDDBD was validated by the procedure described in Cline (Reference Cline, F. H. and Smith2000). An individual profile fitting of SRM 660a (NIST, 2000), LaB6, is used to evaluate the performance of the goniometer while a Rietveld analysis of SRM 676a (NIST, 2008), alumina, is used to evaluate the optics.
IV. DATA COLLECTION AND ANALYSIS
Certification data were recorded for two samples prepared from the material extracted from each of 11 randomly selected bottles for a total of 22 samples. Data were collected from selected regions of the diffraction pattern, each region including only one of the 11 allowed reflections accessible within the 2θ range of 25° to 140°. The (444) peak was not measured as it was outside the scan range of the goniometer. The scan parameters are given in Table I. The angular widths
TABLE I. The scan parameters for Si peaks.
of the scan ranges were approximately 15 times the observed FWHM values of the profiles. The step width was chosen to include at least eight data points above the FWHM. The count time spent on each profile was inversely proportional to the observed diffraction intensity and calculated so that the total collection time for each sample was about 12 h. The certification data were recorded with the X-ray tube operating at an accelerating voltage of 45 kV and a current of 40 mA. The source slit was set so that at the lowest θ angle, the projected size of the source was just less than the sample size. This geometric consideration gives a value of 0.8° for the setting of the equatorial divergence slit. A Soller slit with a divergence of 2.2° further defined the incident beam in the axial direction. The source was allowed to equilibrate at operating conditions for at least 1 h prior to recording any calibration data. The samples were selected in an arbitrary order and typically four samples were run as a group. The temperature within the radiation enclosure was monitored and the variation in temperature over the course of any scan was typically less than 0.1 K.
The certification data were analyzed using the fundamental parameters approach for Rietveld refinement (Rietveld, Reference Rietveld1967; Rietveld, Reference Rietveld1969) as implemented in TOPAS (Bruker AXS GmbH, 2008). The analysis used the Cu K α 1/K α 2 emission spectrum from Hölzer et al. (Reference Hölzer, Fritsch, Deutsch, Härtwig and Förster1997) including a satellite component (Maskil and Deutsch, Reference Maskil and Deutsch1988). The refined parameters included the scale factors, first order Chebyshev polynomial terms, the lattice parameters, the intensities and position of the K α 2 and satellite components of the Cu K α emission spectrum, terms indicating the position and intensity of the “tube tails” (Bergmann et al., Reference Bergmann, Kleeberg, Haase, Breidenstein, A. J., Delhez and Mittemeijer2000), a Soller slit value in the “full” axial divergence model (Cheary and Coelho, Reference Cheary and Coelho1998a; Cheary and Coelho, Reference Cheary and Coelho1998b), specimen displacement, an absorption term, and a size-broadening term of a Lorentzian profile.
An examination of the individual profiles revealed a difficulty in the analysis of the low-angle peaks. This is illustrated in Figure 3. The data are shown to deviate to the low angle relative to the model. This indicates either a flaw in the model or an error in the equipment. While the source of the problem may well have multiple origins, it is well known that low-angle profiles are more prone to error than high-angle lines as the optical aberrations affecting their position are more complex. To investigate this difficulty, the data were analyzed using the same fundamental parameters approach

Figure 3. (Color online) Low-angle Rietveld fit of the 111 line of SRM 640d: showing that the model is shifted to high angle with respect to the data.
as before, but with the lattice parameters allowed to refine independently for each profile. The differences between the constrained, Rietveld, lattice parameter, and the individually refined parameters are plotted in Figure 4. One can see that the low-angle lines are most significantly different. The low-angle lines were then sequentially eliminated from the Rietveld analyses and the results replotted. These are shown in Figure 4 as the “minus 111” and “minus 111 and 220” data. It was judged that with the removal of the 111 and 220 lines that the spread of the remaining data was within acceptable limits. Therefore, the 22 data sets were analyzed with the Rietveld method, but with the 111 and 220 lines omitted.
The data were analyzed and assigned a statistical type A uncertainty and a type B uncertainty based on knowledge of the nature of errors in the measurements to result in the establishment of robust uncertainties for the certified values (ISO, 1993; Taylor and Kuyatt, Reference Taylor and Kuyatt1994). The statistical analysis of the data indicated that the mean of the measurements was 0.543 157 53 nm with a k=2 type A expanded uncertainty of ±0.000 000 64 nm. The intervals defined by a value and its uncertainty are approximate 95% confidence intervals for the true value of the mean in the absence of systematic error. A type B uncertainty due to systematic error must be incorporated
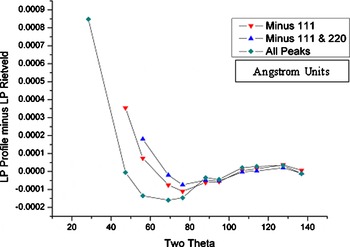
Figure 4. (Color online) Lattice parameter difference data from the constrained (Rietveld) vs unconstrained (profile) analyses for Sample No. 31a (the first sample from the first bottle).
into the error bounds of the certified lattice parameter due to the fact that the measurements themselves are not metrological in nature. The variation in lattice parameter, as illustrated in Figure 4, needs to be addressed with an assignment of a type B uncertainty.
It is thought that this variation may be due to both faults in the model used for data analysis and to flexing of the goniometer leading to errors in angle measurement. Flexure of the detector arm can be caused by the cantilevered loads from the detector mounting bracket and the monochromator and detector assembly. Flexure will vary as a function of diffraction angle since the projection of the gravitational force will vary with 2θ angle, for our instrument a maximum at 30° and a minimum at 120°. Similarly, flexure in the goniometer bearing could occur as the torque on the bearing changes. Flexure of the goniometer and detector arm was investigated by measuring both the displacement of the detector arm and changes in encoder position as a series of weights was added to the detector arm at the detector position. A dial gauge was used to measure the linear displacement of the receiving slit as a function of load and the optical encoder value was used to measure changes in angle. Even though a custom counterweight was used to offset as much as possible the effects of the cantilevered load, an estimated 1 kg or so variation occurs, as for example, when the diffracted beam monochromator is added or removed. A 1 kg mass added at the detector position produced a linear displacement of 4 μm, the equivalent of an angular displacement of 0.001°. The encoder only measured an angular displacement of 0.0003° implying an uncorrected shift of 0.0007°. While these displacements may seem rather small, the effect on the data is quite profound particularly since this flexure results in an uncertainty of the goniometer zero position. The impact of this uncertainty can be estimated by looking at the maximum change in the lattice parameter that results from a change in the diffraction angle. For silicon the (620) line occurs at 127.5135°, very nearly the position of zero offset. For this line, a change in 2θ of 0.0007° will change the calculated lattice parameter by 0.000 01 nm.
Considering the spread in the high-angle data used in the certification, shown in Figure 4, and the effects of the detector arm flexure, leads to an assignment of a type B uncertainty of ±0.000 02 nm. The mean value of the lattice parameter requires a correction for the ≈1 K temperature difference between the laboratory during data collection and the reference temperature for the certified value. Using the formula in Bergamin et al. (Reference Bergamin, Cavagnero, Mana and Zosi1997) yields a value of 0.543 158 93 nm. Therefore, the certified lattice parameter at a temperature of 22.5 °C is
V. CONCLUSION
A NIST-built divergent beam diffractometer, incorporating many advanced design features, has been used to certify the lattice parameter of silicon powder for Standard Reference Material 640d. The silicon powder was specifically prepared to produce strain-free particles in the size range between 1 and 10 μm to eliminate size-broadening effects. Both type A, statistical, and type B, systematic, errors have been assigned to yield a certified value for the lattice parameter of a=0.543 159±0.000 020 nm.


