


INTRODUCTION
The laboratory based divergent-beam X-ray diffractometer can provide a wealth of structural and microstructural information about a wide variety of materials. However, to successfully interpret the data, the operator must have both a properly aligned instrument and take into consideration the aberrations inherent to the para-focusing optics. One method to accomplish this is to use standards to evaluate instrument performance. The National Institute of Standards and Technology (NIST) certifies a suite of Standard Reference Materials (SRMs) to address specific aspects of powder diffractometer performance. This report describes SRM 660b, the third generation of this powder diffraction standard, which is certified with respect to unit-cell parameter. It consists of approximately 6 g of LaB6 powder specifically prepared to have minimal line broadening and is commonly used for calibrating powder diffractometers for line position and line shape.
MATERIAL
The lanthanum hexaboride feedstock for SRM 660b was manufactured specifically for NIST with a dedicated processing run. One of the precursor components, boron carbide, was enriched with the 11B isotope to a nominal 99% concentration. At natural abundance, the large fraction of 10B results in an extremely high neutron absorption cross section, rendering the lanthanum hexaboride made from it essentially opaque to neutrons and therefore not suitable for neutron diffraction experiments. Use of the 11B isotope yields a feedstock that is applicable to the neutron diffraction community. After synthesis, the feedstock was annealed to minimize crystallographic defects that would otherwise lead to strain broadening. The powder sintered to a small extent during the annealing process and the material, lightly ground in a mortar and pestle, was passed through a 44 μm sieve. Typical particle size data from laser scattering measurements are shown in Figure 1. The low end of the crystallite size distribution being above 0.5 μm ensured that diffraction data from SRM 660b would not display the effects of size broadening. Bottling was performed under argon.
INSTRUMENTATION
The certification of SRM 660b was performed utilizing the NIST-built, Ceramics Division Divergent Beam Diffractometer (CDDBD) that incorporates several advanced design features, as discussed below. The optical layout is that of a conventional divergent-beam diffractometer of Bragg–Brentano geometry. Rigorous analyses of data from this geometry require knowledge of both the diffraction angle and the effective source-sample-detector distance. Two additional models must therefore be included in the data analyses to account for the factors that affect the distances critical in the use of this geometry. The inclusion of these models places
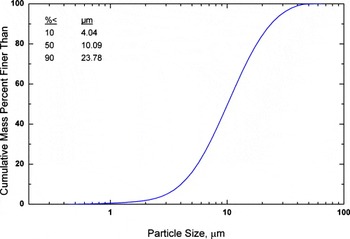
Figure 1. (Color online) Particle size distribution of lanthanum hexaboride feed stock.
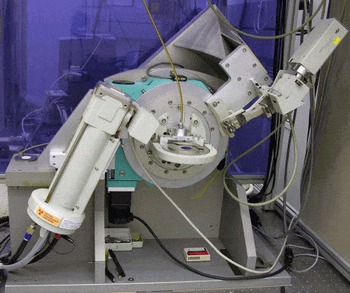
Figure 2. (Color online) CDDBD.
additional uncertainties on the certified unit-cell parameters relative to those determined from a parallel beam instrument. Linkage to the International System of Units (SI) is established via the emission spectrum of CuK α radiation employed as the basis for constructing the diffraction profiles via the fundamental parameter approach (FPA) (Cheary and Coelho, Reference Cheary and Coelho1992) method of data analysis.
The CDDBD, shown in Figure 2, is a θ-2θ diffractometer of essentially conventional layout, although it is built with several features not typically found in commercial equipment of this nature. The goniometer assembly consists of a pair of Huber 420 rotary stages each utilizing a worm gear driving a ring gear to produce a 360:1 gear ratio. These stages are mounted concentrically with their rotation axes horizontal, allowing an automatic sample changer/spinner to be mounted. The goniometer was assembled using a specialized jig that aligned the two rotation axes to within the manufacturer’s specifications for both concentricity (3 μm) and parallelism (14 μrad). The optics, X-ray generator, tube shield, and sample changer were originally components of a Siemens D5000 diffractometer. The cable attached to the sample stage visible in Figure 2 is a flexible drive for the sample spinner; the remote location of the drive motor isolates the sample and machinery from the heat of the motor. Figure 3 illustrates the highly rigid detector arm and counter weight positioned to minimize the off-axis torque applied to the 2θ stage. This required that the detector arm be balanced about three axes by the counterweight, with each of the various detector configurations. Both stages incorporate Heidenhain optical encoders to measure the angle of the ring gear,
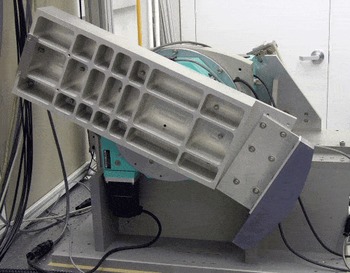
Figure 3. (Color online) Rear view of the CDDBD illustrating stiff and balanced detector arm.
to which the sample and detector stages are mounted. These encoders provide 36000 features/rotation with ±4.8 μrad (±1 arcsec) accuracy. The output from both encoders was further subdivided to ≈1024 points/feature using the Heidenhain IK220 interpolation electronics resulting in ≈102400 features/deg, or ≈0.17 μrad (0.035 arcsec) precision. The use of optical encoders on both axes circumvents the inherent limit on angular accuracy, 121 μrad (25 arcsec), of the Huber 420 stage.
The CDDBD uses a sealed copper tube with a long fine focus, operated at a power of 1.8 kW. The instrument is equipped with a variable divergence incident beam slit, sample spinner, a graphite post-sample monochromator, and a scintillation detector. The source size was approximately 12×0.04 mm2, the goniometer radius is fixed at 217.5 mm; the variable divergence slit was set nominally to 14 mrad (0.8°) for the collection of certification data. A 2 mm anti-scatter slit was placed approximately 113 mm in front of the receiving slit of 0.2 mm, corresponding to a divergence of 0.87 mrad (0.05°). Operation of the CDDBD was provided through control software written in LABVIEW. This software provides for a number of scan configurations, including full range scans and individual peak scans with up to 25 separate peaks. It also provides for separate control of the θ and 2θ axes which is required to perform a variety of alignment procedures. The X-ray tube is mounted so as to provide adjustment of the source position vertically, the X-ray take off angle, and alignment of the line source with respect to the goniometer rotation axis. The entire apparatus is mounted on an optical table within a temperature controlled laboratory space where the nominal short-range control of temperature is ±0.1°C. The performance of the CDDBD was validated by the procedure described in Cline (Reference Cline, Chung and Smith2000). Individual profile fitting of SRM 660a (NIST 2000), LaB6, is used to evaluate the performance of the goniometer while a Rietveld analysis (Rietveld, Reference Rietveld1967, Reference Rietveld1969) of SRM 676a (NIST 2008), alumina is used to evaluate the optics.
DATA COLLECTION AND ANALYSIS
Ten units of SRM 660b were selected in a stratified random manner from the population of units during the bottling of the feedstock. Certification data were recorded for 2 specimens prepared from material extracted from each of the 10 bottles, for a total of 20 specimens. Data were collected from selected regions of the diffraction pattern, each region including only 1 of the 24 allowed reflections accessible within the 2θ range of 20°–150°. The scan parameters are given in Table I. The angular widths of the scan ranges were approximately 15 times the observed FWHM values of the profiles. The step width was chosen to include at least eight data points above the FWHM. The count time spent on each profile was inversely proportional to the observed diffraction intensity and calculated so that the total collection time for each sample was about 22 h. Certification data were recorded with the X-ray tube operating at an accelerating voltage of 45 kV and a current of 40 mA. The source slit was set so that at the lowest θ angle, the projected size of the source was just less than the sample size. This geometric consideration gives a value of 0.8° for the setting of the equatorial divergence slit. A Soller slit with a divergence of 2.2° further
TABLE I. Run-time parameters for collection of certification data from SRM 660b.
defined the incident beam in the axial direction. The source was allowed to equilibrate at operating conditions for at least 1 h prior to recording any calibration data. Samples were selected for data collection in a random order. The temperature within the radiation enclosure was monitored and the variation in temperature over the course of any scan was typically less than 0.1°C.
The certification data were analyzed using the fundamental parameters approach for Rietveld refinement (Rietveld, Reference Rietveld1967, Reference Rietveld1969) as implemented in TOPAS (Bruker, 2008). The analysis used the CuK α 1/K α 2 emission spectrum from Hölzer et al. (Reference Hölzer, Fritsch, Deutsch, Härtwig and Förster1997) including a satellite component (Maskil and Deutsch (Reference Maskil and Deutsch1998)). The refined parameters included the scale factors, first order Chebyshev polynomial terms, the unit-cell parameter, the intensities and position of the K α 2 and satellite components of the CuK α emission spectrum, terms indicating the position and intensity of the “tube tails” (Bergmann et al., Reference Bergmann, Kleeberg, Haase, Breidenstein, Böttger, Delhez and Mittemeijer2000), a Soller slit value in the “full” axial divergence model (Cheary and Coelho, Reference Cheary and Coelho1998a, Reference Cheary and Coelho1998b), specimen displacement, an absorption term, and a size broadening term of a Lorentzian profile.
A second analysis was performed absent the structural model wherein the profile positions were refined in an unconstrained manner. In this case, the unit-cell parameter was determined for each profile. When these results are compared with those obtained from the Rietveld refinement, a difficulty is revealed in the low-angle profiles. This is illustrated in Figure 4. Below 40° 2θ there is a clear deviation; the increased sensitivity of unit-cell parameter with respect to 2θ at low angles is well known. A small shortcoming in the model can result in a large deviation, though a mechanism change in the sub 40° 2θ data is clearly indicated. Above 40° 2θ, however, the deviation is notably small: ±5×10⁻⁶ nm. A clear trend in these data is apparent that calls for modeling. However, the error in profile position is nonetheless exceedingly small, on the order of ±0.003° 2θ. It was decided to eliminate the low-angle reflections, the 100 and 110 lines, from the analyses used to generate the certification data.
The value of unit-cell parameter requires a correction for the temperatures at the time of data collection for each sample, and the reference temperature stated on the certificate of 22.5°C, typically ∼1°C correction. The formula in Sirota (Reference Sirota, Novikov, Vinokrov and Paderno1998) was used for this purpose. The data were analyzed and assigned a statistical type A uncertainty and a type
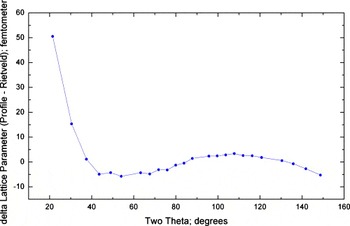
Figure 4. (Color online) Unit-cell parameter difference data from the constrained (Rietveld) vs unconstrained (profile) analyses for SRM 660b.
B uncertainty based on knowledge of the nature of errors in the measurements, to result in the establishment of robust uncertainties for the certified values (ISO, 1993; Taylor and Kuyatt, Reference Taylor and Kuyatt1994). A statistical analysis of the data indicated that the mean of the measurements was a=0.41569118 nm with a k=2 type A expanded uncertainty of 0.00000044 nm. The intervals defined by a value and its uncertainty in this certificate are an approximate 95% confidence intervals for the true value of the mean in the absence of systematic error. However, a type B uncertainty due to systematic error must be incorporated into the error bounds of the certified unit-cell parameter. Consideration of the spread of the high-angle data used in the certification leads to an assignment of a type B uncertainty of ±0.000008 nm. Therefore, the certified unit-cell parameter at the temperature of 22.5°C is
CONCLUSION
A NIST-built divergent-beam diffractometer, incorporating many advanced design features, has been used to certify the unit-cell parameter of lanthanum hexaboride powder for Standard Reference Material 660b. The powder was specifically prepared to minimize the effects of size and strain broadening. Both type A, statistical, and type B, systematic, errors have been assigned to yield a certified value for the unit-cell parameter of a=0.415691(8) nm at 22.5°C.
DISCLAIMER
Certain commercial equipment, instruments, or materials are identified in order to adequately specify the experimental procedure. Such identification does not imply recommendation or endorsement by the National Institute of Standards and Technology, nor does it imply that the materials or equipment identified are necessarily the best available for this purpose


