


I. INTRODUCTION
The laboratory-based divergent-beam X-ray diffractometer can provide a wealth of structural and microstructural information about a wide variety of materials. However, to successfully collect and interpret the data, the operator must have both a properly aligned instrument and take into consideration the aberrations inherent to the para-focusing optics. One method to accomplish this is to use standards to evaluate instrument performance. The National Institute of Standards and Technology (NIST) certifies a suite of Standard Reference Materials (SRMs) to address specific aspects of powder diffractometer performance. This report describes SRM 660c, the fourth generation of this powder diffraction standard, which is certified with respect to lattice parameter. It consists of approximately 6 g of lanthanum hexaboride (LaB6) powder specifically prepared to have minimal line broadening. It is commonly used for determination of the instrument contribution to the observed line profile, the instrument profile function (IPF), and calibrating powder diffractometers with respect to line position.
II. MATERIAL
The lanthanum hexaboride feedstock for SRM 660c was manufactured for NIST with a dedicated processing run (H.C Starck GmbH, Goslar, Germany, now Höganäs AB, SE-263 83 Höganäs, Sweden). (Certain commercial equipment, instruments, or materials are identified in this in order to adequately specify the experimental procedure. Such an identification does not imply recommendation or endorsement by NIST, nor does it imply that the materials or equipment identified are necessarily the best available for the purpose.) One of the precursor materials, boron carbide, was isotopically enriched with the 11B isotope to a nominal concentration of 99% (Ceradyne Boron Products LLC, Quapaw, OK, USA, now Ceradyne, Inc., a 3M company). The 10B isotope has a neutron capture coefficient nearly six orders of magnitude larger than 11B and at the naturally occurring abundance of nearly 20% results in extremely high neutron absorption, rendering a lanthanum hexaboride made from it essentially opaque to neutrons and therefore not applicable to diffraction experiments. The use of the 11B isotope eliminates this problem and yields an SRM that is relevant to both the X-ray and neutron diffraction communities. Estimates of the actual 10B content and bulk powder transmission properties were derived from small-angle neutron scattering (SANS) experiments as will be described later. The LaB6 powder was annealed at 1700 °C under argon for 1 h in an induction furnace to remove crystallographic defects and grow the crystallites to minimize sample-induced broadening (Cerac Inc., Milwaukee, WI, USA, now Materion Corporation). The powder sintered to a small extent during the annealing process and, therefore, was lightly ground in a mortar and pestle and passed through a 44 µm sieve to remove any remaining large particles. Figure 1 shows typical particle size data from laser scattering measurements. Each individual unit of SRM 660c was bottled under argon gas.

Figure 1. (Colour online) Particle size distribution of lanthanum hexaboride feedstock.
III. EXPERIMENT
X-ray powder diffraction data were collected on a NIST-built diffractometer that incorporates several advanced design features, such as high accuracy optical encoders and temperature control <0.1 K. A full discussion of this instrument, its alignment and calibration can be found in Cline et al. (Reference Cline, Mendenhall, Black, Windover and Henins2015, Reference Cline, Mendenhall, Black, Windover, Henins, Gilmore, Kaduk and Schenk2019). The optical layout is that of a conventional Bragg-Brentano divergent-beam diffractometer, utilizing a Cu X-ray source, a sample spinner, a graphite post-sample monochromator, and a scintillation detector. Linkage to the International System of Units (SI) (BIPM, 2006) is established via the emission spectrum of CuKα radiation, which forms the basis for constructing the diffraction profiles in the fundamental parameters approach (FPA) method of data analysis (Cheary and Coelho, Reference Cheary and Coelho1992). The models for the geometric component of the profiles included source and receiving slit width, flat specimen error and axial divergence. Rigorous analysis of data from this divergent-beam diffractometer requires knowledge of both the diffraction angle and the effective source–sample–detector distances. Therefore, two additional models, specimen displacement and X-ray attenuation, must be included in the data analysis as these factors affect the distances critical in the use of this experimental geometry. Data were analyzed in the context of both Type A uncertainties, assigned by statistical analysis, and Type B uncertainties, based on knowledge of the nature of systematic errors in the measurements, to result in the establishment of robust uncertainties for the certified values (Taylor and Kuyatt, Reference Taylor and Kuyatt1994; JCGM 100, 2008).
A random stratified selection process was used to extract ten bottles of SRM 660c from a total population of 1096 bottles in stock. Two samples were prepared from each bottle, for a total of 20 samples. Certification data sets were collected from 24 regions of the diffraction pattern, with each region including only one of the 24 allowed reflections accessible within the diffractometer 2θ range of 20°–150°. The scan parameters for each peak are given in Table I. The angular width of each region was selected to be approximately 15 times the observed full-width at half-maximum (FWHM) of the profile, and the step width was chosen to include at least eight data points above the FWHM. The dwell time for each profile was inversely proportional to the observed diffraction intensity and calculated, so that the total collection time for each sample was about 22 h. Certification data were recorded with the X-ray tube operating at an accelerating voltage of 45 kV and a current of 40 mA. The source size was approximately 12 mm × 0.04 mm, and the goniometer radius was 217.5 mm. The divergence slit was nominally set to 0.8°, so that at the lowest θ angle, the projected size of the source was just less than the sample size. Samples were spun, about the normal to their surface, at 0.5 Hz during data collection. A Soller slit with a divergence of 2.2° further defined the incident beam in the axial direction. A 2 mm anti-scatter slit was placed approximately 113 mm in front of the receiving slit of 0.2 mm (0.05°). The source was allowed to equilibrate at operating conditions for at least an hour prior to collecting any data, and samples were selected for data collection in a random order. The temperature and humidity within the diffractometer enclosure were recorded during data collection using Veriteq SP 2000 monitors with a stated accuracy of ±0.15 K. The variation in temperature over the course of any scan was typically less than 0.1 K.
TABLE I. Run time parameters for the data collection from SRM 660c.

In order to assess the crystallite size of SRM 660c, several data sets were collected at the Advanced Photon Source (APS) on the 11-BM high-resolution powder diffractometer (Wang et al., Reference Wang, Toby, Lee, Ribaud, Antao, Kurtz, Ramanathan, Von Dreele and Beno2008). The resolution of this machine is sufficiently high that a credible analysis of the crystallite size broadening of the LaB6 could be performed. TOPAS (Bruker, 2017) was used to analyze the data using the FPA method with Pawley fits to the data (Pawley, Reference Pawley1981). Included in the refinements was a parameter for Lorentzian broadening varying as 1/cosθ interpreted as crystallite size-induced broadening. This resulted in a volume-weighted mean crystallite size, ⟨L vol⟩, of 500 nm, based on an assumption of spherical crystallites. This degree of crystallite size broadening is undetectable on laboratory X-ray equipment.
A bottle was chosen at random to determine the neutron transmission for a cylindrical vanadium cell of 6 mm internal diameter commonly used for neutron powder diffraction measurements. The packing density of the powder was determined from the mass of powder in a known volume that was tapped in a similar fashion as the sample in the vanadium cell (1.08 g cm−3). The NG-7 SANS instrument at the NIST Center for Neutron Research was configured for standard transmission measurement with an aperture in a Cd mask placed in front of the sample that was 4 mm wide and 15 mm tall. The SANS instrument was configured with 15.3 m sample-to-detector distance, 8 guides inserted, and 4 attenuators. A velocity selector is used to provide a wavelength of 6 Å with Δλ/λ of ≈15%. The direct beam covers approximately 40 pixels × 50 pixels on the detector. The counting time for an empty vanadium cell and one filled with La11B6 were 180 s each with a nominal neutron flux of 6.6 × 10⁶ n cm−2 s−1.
The ratio of integrated neutron detector counts for the La11B6 in the vanadium cell to that of the empty vanadium cell at a wavelength of 6 Å results in a transmission of 17.2%. Using the estimated packing density, we calculate (NCNR, 2019) an approximate isotopic purity of 98.8% 11B, close to the nominal 99% given from the manufacturer. For a neutron wavelength of 1.54 Å, the calculated transmission is 63%, within the range commonly used for crystallography measurements. To improve the transmission to 90% at this wavelength, we calculate that an isotopic purity of 99.9975% 11B is needed.
IV. DATA ANALYSIS
The certification data were analyzed using the FPA method with a Rietveld refinement as implemented in TOPAS. A NIST developed Python-based code that implements the FPA method (Mendenhall et al., Reference Mendenhall, Mullen and Cline2015) was also used in a Pawley analysis. With the Python-based code, the 20 data sets from SRM 660c were analyzed simultaneously in a global refinement. This approach allowed the analysis of specific parameters of the IPF to be carried out in the context of highly favorable Poisson counting statistics. The analysis used the energy of the CuKα emission spectrum as characterized by Hölzer et al. (Reference Hölzer, Fritsch, Deutsch, Härtwig and Förster1997) and included a satellite component (Maskil and Deutsch, Reference Maskil and Deutsch1988) and the “tube tails” (Bergmann et al., Reference Bergmann, Kleeberg, Haase and Breidenstein2000). However, as reported by Cline et al. (Reference Cline, Mendenhall, Black, Windover and Henins2015), the graphite post-monochromator imposes a bandpass on the diffracted beam that reduces the apparent breadth of the CuKα emission spectrum from the values reported by Hölzer by approximately 20%. Therefore, it was desired to refine the breadth with a global refinement to realize the benefits of the favorable Poisson counting statistics.
In the global refinement, parameters specific to each sample, such as displacement and attenuation terms, were allowed to refine independently. While parameters specific to either SRM 660c, such as the lattice parameter, or the instrument, were constrained to a single, refined value. The breadths of the four Lorentzian profiles used to describe the CuKα emission spectrum were refined in order to assess the impact of the post-monochromator. In these analyses, the FWHM values of the two pairs of profiles in the emission spectrum were constrained, Kα 11 with Kα 12 and Kα 21 with Kα 22, to preserve the overall shape as reported by Hölzer. This refinement included the intensities and positions of the satellite lines and the “tube tails”. A Soller slit value, constrained to be identical for both the incident and diffracted beam, using the “full” axial divergence model (Cheary and Coelho, Reference Cheary and Coelho1998a, Reference Cheary and Coelho1998b), was also refined. In this manner, highly credible values for parameters specific to the IPF were obtained and fixed for subsequent refinements to obtain the certified lattice parameters. Additionally, the IPF parameters obtained from fits to individual data sets essentially duplicated those of the global approach.
The IPF parameters obtained with the global fit were used in the Rietveld analyses using TOPAS. The refined parameters included the scale factors, Chebyshev polynomial terms for modeling of the background, the lattice parameters, specimen displacement and attenuation terms, structural parameters and a term for Lorentzian size broadening. With these analyses, the refinements were performed on the individual scans resulting in 20 values for the lattice parameter that were used to obtain the certified values. The goodness of fit parameter was about 1.3. The lattice parameter obtained from the Python-based FPA global refinement and the average of the 20 values obtained individually from the TOPAS FPA analysis agreed to within 2 fm. This lends credibility to the premise that both codes are working in correspondence to published FPA models. The refined lattice parameters were adjusted using the coefficient of thermal expansion values found in Sirota et al. (Reference Sirota, Novikov, Vinokrov and Paderno1998) to values at 22.5 °C and are given in Table II.
TABLE II. Certification data for SRM 660c.

The efficacy of the FPA models can be evaluated by examining the variation in refined lattice parameter as a function of 2θangle. This variation is due primarily to the asymmetry of the X-ray line profiles which varies in both the degree and direction over the full 2θ range. This is illustrated in Figure 2, wherein the left (low-angle side) and right (high-angle side) half-width at half-maximum (HWHM) of the line profiles are shown as a function of 2θ angle. These values were obtained by fitting individual peaks of the certification data with a split pseudo-Voigt profile shape function with unity weighting (Cline et al., Reference Cline, Mendenhall, Black, Windover and Henins2015). The angular dispersion, dθ/dλ, will result in increasing FWHM values with tanθ, as is apparent in the data of Figure 2. Furthermore, the discontinuity observed for the (100) peak at 21.4° is due to low angular dispersion at this angle and the apparent “merging” of the contributions of the copper Kα 1 and Kα 2 lines; this biases the profile fitting procedure to yield nonphysical results. Axial divergence broadens the peaks to the low-angle side below ≈110°, and to the high-angle side above this value (Cheary and Coelho, Reference Cheary and Coelho1998a, Reference Cheary and Coelho1998b), as illustrated in Figure 2. The effects of the incident beam slit will also asymmetrically broaden the low-angle lines to the low-angle side. Thus, the region of minimal FWHM values is observed to be 40°–70°, while the region of minimal asymmetry will be 90°–120°; both effects are in conjunction with expectations.

Figure 2. (Colour online) Left and right HWHM values obtained via a refinement using a split pseudo-Voigt profile shape function with unity weighting.
The use of the FPA for the fitting of X-ray line profiles generally entails the refinement of models across the full 2θ range; this ensures the most accurate representation of the various contributions to the observed line shape. If the FPA model was working “perfectly”, i.e., faithfully representing all physical parameters of the instrument, the lattice parameters obtained from FPA fits to the individual profiles would be uniform with respect to diffraction angle. To examine this behavior, the optimum IPF parameters obtained by the global FPA fit to the 20 data sets using the Python-based code were used. These values were then fixed, and the lattice parameter of each peak then refined independently, permitting optimization in 2θ space alone, yielding 24 lattice parameter values for each scan. Figure 3 illustrates the difference between the single lattice parameter obtained with the global Pawley fit and those obtained with fits to the individual profiles. This plot can be considered in the context of Bragg's law, diffraction optics, and the properties of nonlinear least-squares fitting. Dispersion in d with respect to θ, d(d)/d(θ), follows 1/tanθ; hence, the high sensitivity of d values at lower 2θ angles. The symmetric, broad peaks in the 90°–120° region effectively anchor the refined lattice parameter due to their relative independence on the model and small values of 1/tanθ. The peaks in the 40°–70° range also anchor the lattice parameter as they are intrinsically narrow and are only affected by modest values of 1/tanθ. It is observed that the scatter in the data points above 40° in Figure 3 is relatively modest reflecting a reduced uncertainty in the reported values. This is in sharp contrast to the low-angle lines which are adversely affected by both the axial divergence and a large 1/tanθ dependence. These low-angle peaks display a larger scatter in their values. While we do not show formal error values (σ) derived from the variance–covariance matrix, the large scatter of the low-angle points is nonetheless consistent with the large σ associated with these values. Since the contribution of points to χ 2, which is minimized in least-squares fitting, is inversely weighted by the σ 2 from the variance–covariance matrix, the large uncertainty at low angles implies that these points have very little effect on the final fit values.
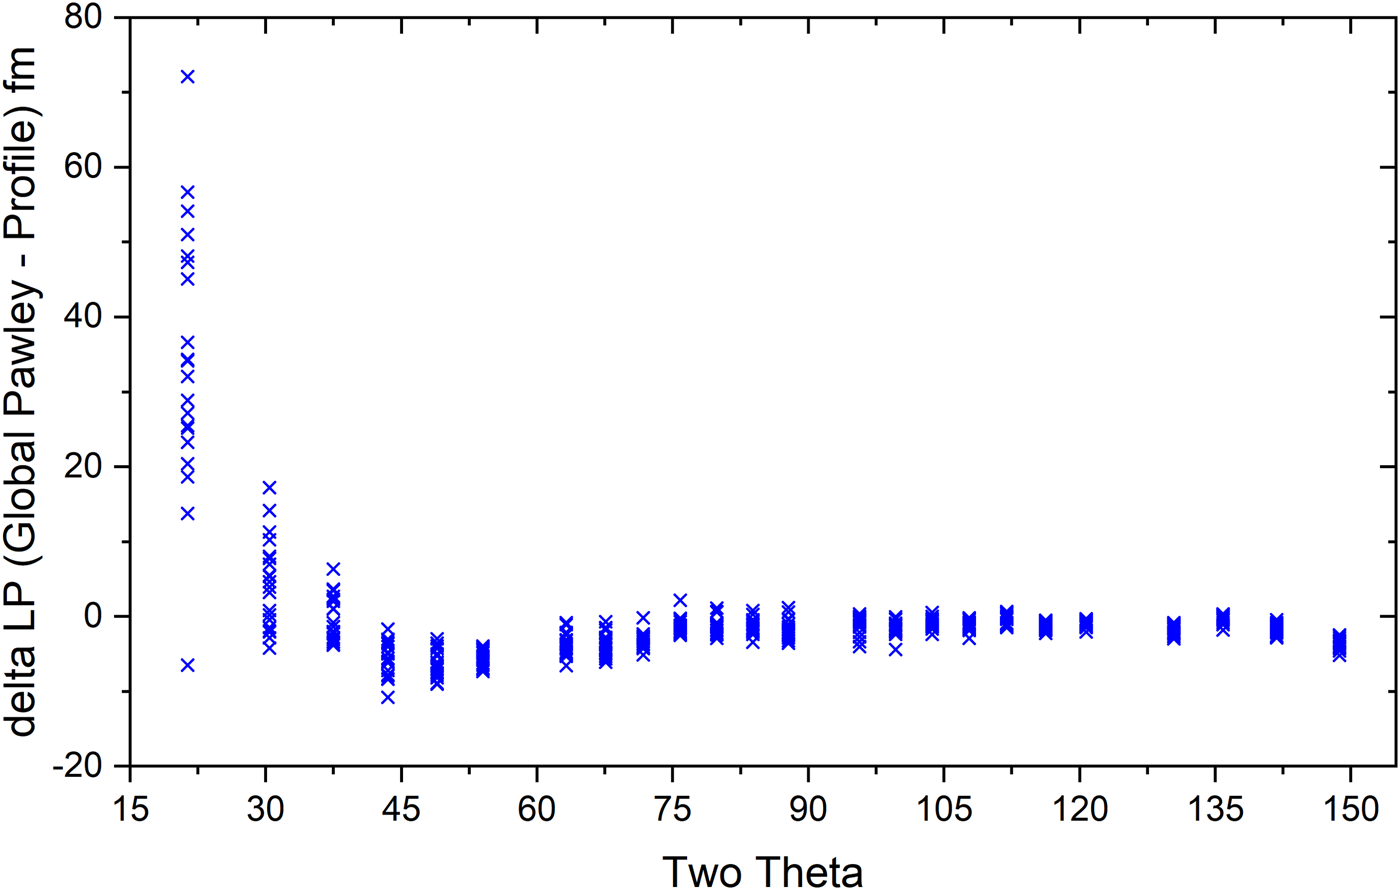
Figure 3. (Colour online) Lattice parameter difference between the value obtained via a global FPA Pawley analysis vs. values obtained via the refinement of individual profile position with the FPA parameters frozen at the global values.
A statistical analysis of the data indicated that the mean of the measurements was a = 0.415 682 6 nm with a k = 2 Type A expanded uncertainty of 0.000 000 37 nm. However, a Type B uncertainty due to systematic uncertainty must be incorporated into the uncertainty bounds of the certified lattice parameter. While every effort has been taken to understand and take into account the nature of the uncertainties in the experimental procedure and in the data analysis process, unspecified uncertainties certainly exist. Insight into the magnitude of possible systematic uncertainties can be gained by examining Figure 3. As discussed above, the large scatter of the low-angle data results from well-understood causes and as such they do not contribute to an understanding of additional systematic uncertainty. Except for a single value, all data for the peaks between 40° and 120°, which includes the range of both minimum FWHM and highest symmetry, fall between ±8 fm. This leads to an assignment of a Type B expanded uncertainty (95% confidence) of ± 0.000 008 nm and a final certified lattice parameter of a = 0.415 682 6 ± 0.000008 nm.
V. CONCLUSION
A NIST-built divergent-beam diffractometer, incorporating many advanced design features, has been used to certify the lattice parameter of LaB6 powder for SRM 660c. The powder was specifically prepared to minimize the effects of size and strain broadening to facilitate the development of the IPF. Both Type A, statistical, and Type B, systematic, uncertainties have been assigned to yield a certified value and 95% confidence uncertainty for the lattice parameter of a = 0.415 682 6 ± 0.000 008 nm at 22.5 °C.
ACKNOWLEDGEMENTS
The use of the Advanced Photon Source at Argonne National Laboratory was supported by the U.S. Department of Energy, Office of Science, Office of Basic Energy Sciences, under Contract No. DE-AC02-06CH11357. We thank Mr. Jeff Krzywon for help in obtaining the SANS data.


