


Food advertising, with food commercials shown on television being one of the most important channels, affects children’s knowledge about nutrition and health, preferences, purchase and consumption behaviour, and hence their eating behaviour, social acceptability and peer modelling of behaviours(Reference Cairns, Angus and Hastings1–Reference Sadeghirad, Duhaney and Motaghipisheh3). The prevalence of obesity among children and adolescents in the United States has been steady and over 15% since 2001(Reference Ogden, Carroll and Lawman4). Meanwhile, it was estimated that the number of children with overweight or obesity increased by 1·3 million per year in Europe(Reference Jackson-Leach and Lobstein5). Food marketing to children poses a problem for childhood obesity, as it is composed largely of messages for foods dense in energies but poor in nutrients(Reference Folta, Goldberg and Economos6–Reference Harris, Pomeranz and Lobstein8). By analysing the data from the National Health and Nutrition Examination Survey in the USA with a mathematical simulation model, it was estimated that one in seven up to one in three children could be saved from developing obesity if the exposure to food commercials on television was reduced to zero(Reference Andreyeva, Kelly and Harris9). Echoing this finding, a meta-analysis concluded that experimental short-term exposure to food commercials would lead to an addition of 251·04 kJ dietary intake compared with nonfood commercials(Reference Russell, Croker and Viner10). Indeed, pictures and videos of foods were found to exert a similar effect size to real food exposure in terms of inducing food craving(Reference Boswell and Kober11).
In recent years, researchers have started to use functional MRI (fMRI) to investigate the neural correlates of food commercials in children and adolescents(Reference Gearhardt, Yokum and Stice12), which may foster a better understanding of the neurobiology of how food commercials affect food choice and eating behaviour. As the literature has continued to accumulate, a meta-analysis could be conducted to pool data across relevant papers to identify brain regions that were consistently reported to involve in processing information from food commercials. Hence, a meta-analysis was performed on fMRI studies with the activation likelihood estimation approach, which used a probability distribution model(Reference Eickhoff, Bzdok and Laird13,Reference Eickhoff, Laird and Grefkes14) to determine the consistency of activated brain regions, in the format of standard brain coordinates, reported by multiple experiments. This approach successfully meta-analysed neuroimaging studies on taste and food stimuli in previous reports(Reference Yeung, Goto and Leung15–Reference Yeung17). The reason for conducting the current analysis on top of the existing meta-analyses was that the previous ones were based on visual food cues that involved static food images well designed for experiments, instead of naturalistic audiovisual footages that are exposed to children everyday through the television.
Methods
Literature search and screening
Following the preferred reporting items for systematic reviews and meta-analyses guideline, papers were searched in multiple electronic databases, namely PubMed, Web of Science and Scopus, in March 2020. The following string was used to search for the titles, abstracts and keywords of papers: (‘food commercial*’ OR ‘commercial* of food’ OR ‘food ad’ OR ‘food ads’ OR ‘food advertisement*’) AND (‘functional MRI’ OR fMRI OR ‘functional magnet* resonance’). Reference lists of relevant publications were also searched to identify missed papers.
The search initially yielded thirty-one papers. After excluding duplicates, twelve remained. Five of them were excluded after further screening because of being a review paper (n 1), food commercials being merely mentioned but not involved in the actual experiments (n 3) and having no brain activation results from whole-brain analysis (n 1). Finally, seven studies remained (Fig. 1).
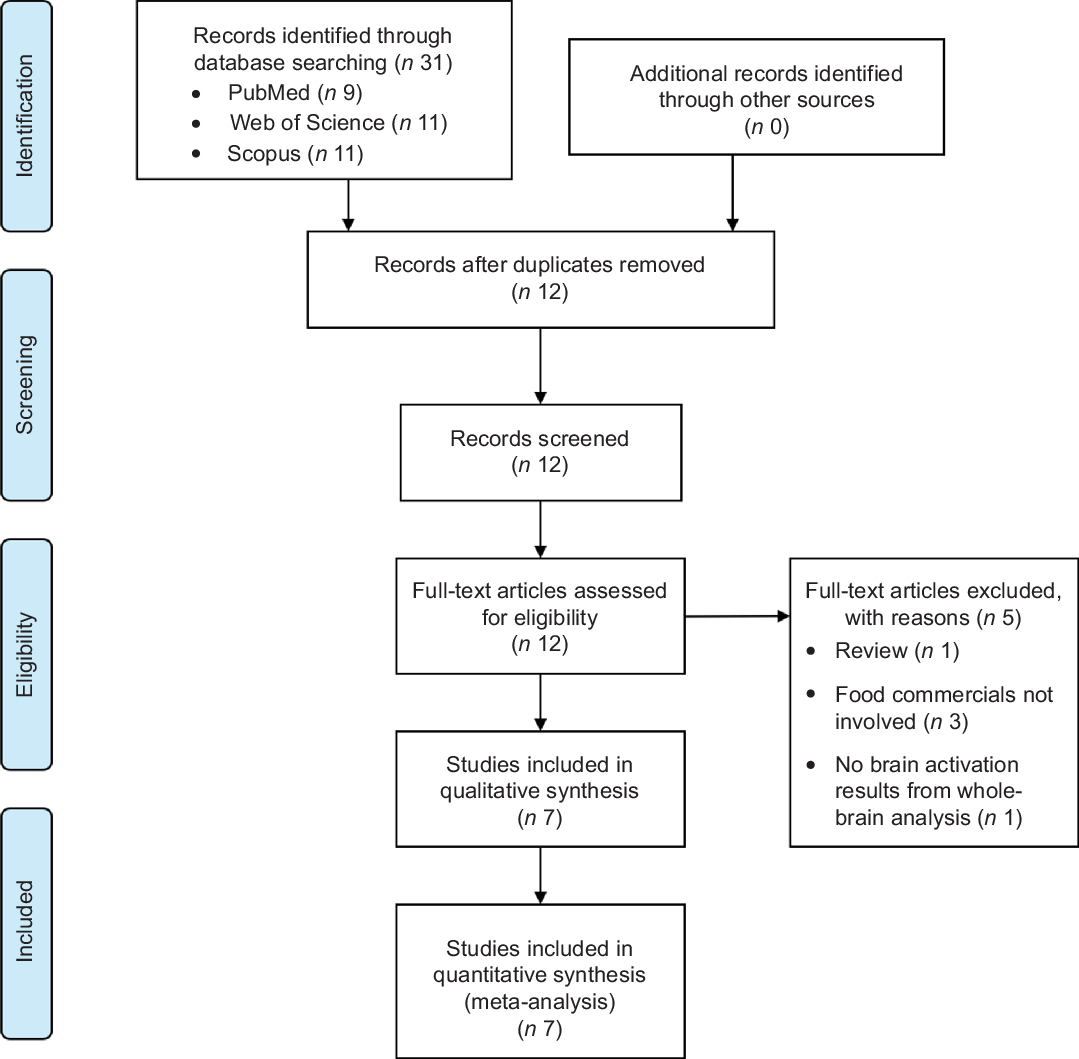
Fig. 1 Flow diagram for literature search
Information recorded from the analysed papers
A number of items were extracted from the analysed papers, such as patient age, sex and BMI, commercials used as the control, statistical threshold used to report fMRI results, the number of brain coordinates reported and whether food or nonfood commercials activated the brain more (Table 1).
Table 1 Details of the seven meta-analysed papers
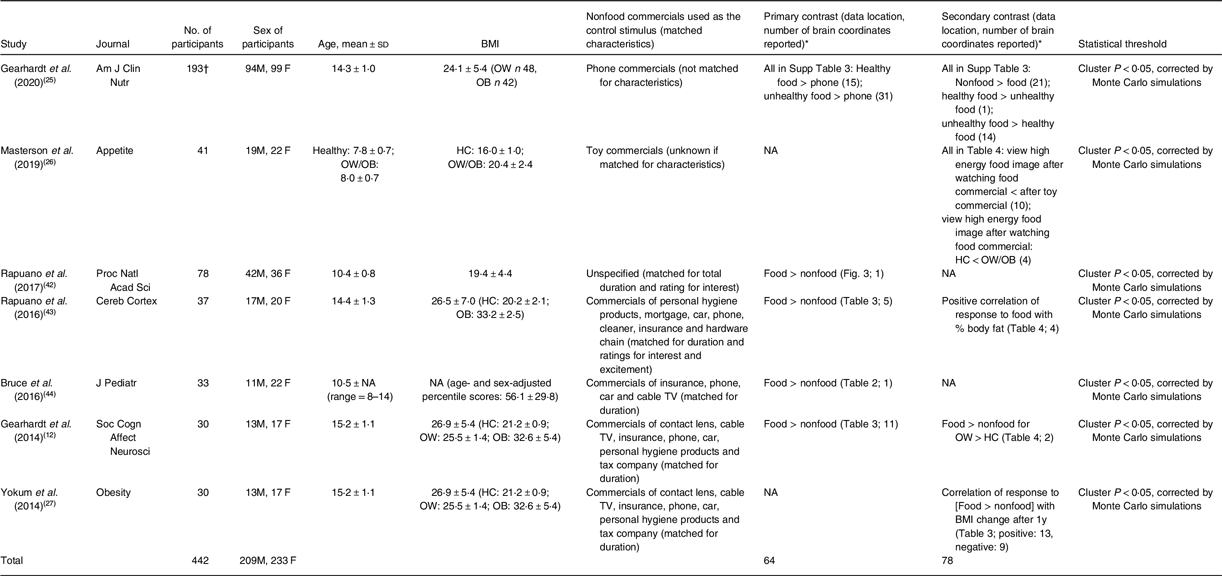
HC, healthy controls. OB, participants with obesity. OW, participants with overweight.
* Unless otherwise specified, food and nonfood mean food and nonfood commercials, respectively.
† The reported results were based on 171 participants (after 22 were excluded) without detailed final sample composition.
Activation likelihood estimation meta-analysis
The ALE method is one of the most popular approaches of coordinate-based meta-analysis that pools data from included papers to identify brain regions that are consistently activated in terms of probability distribution modelling(Reference Eickhoff, Laird and Grefkes18). In summary, the standard coordinates of reported brain regions with activation were extracted. There are two common systems of brain coordinates – Talairach and Montreal Neurological Institute (MNI). To make it consistent, coordinates reported in the former system were converted to the MNI system by Lancaster transform(Reference Lancaster, Tordesillas-Gutiérrez and Martinez19). The software GingerALE 3.0.2 (freely available from http://brainmap.org/ale/) was used to conduct ALE meta-analysis. Subject-based full-width half-maximum values were applied(Reference Eickhoff, Laird and Grefkes18). The more conservative mask instead of the dilated one was used. A cluster of brain voxels was considered significantly activated in the meta-analysis if it had a cluster P < 0·05 (corrected by familywise error rate, FWE-corrected) with a primary cluster-defining threshold of P < 0·001. This threshold followed the latest recommendations of using GingerALE for ALE meta-analysis(Reference Eickhoff, Nichols and Laird20–Reference Yeung, Wong and Lau22). The thresholded ALE maps were overlaid onto the Colin brain template in MNI space(Reference Holmes, Hoge and Collins23) and visualised with Mango 4·0 (freely available from http://ric.uthscsa.edu/mango/mango.html).
Automated regional behavioural analysis
Each identified significant cluster was subject to automated regional behavioural analysis(Reference Lancaster, Laird and Eickhoff24), which considered the data indexed in the BrainMap database (http://brainmap.org/) that involved fifty-one behavioural sub-domains under five main domains (namely action, cognition, emotion, interoception and perception). In brief, for every behavioural sub-domain, the fraction of brain coordinates falling into the region covered by the significant cluster was computed and compared with the expected fraction if the coordinates had a uniform distribution across the entire brain. A large difference between these fractions (z-score ≥3·0) would imply a significant behavioural association.
Results
Study characteristics
There were seven papers entering the meta-analysis, published in between 2014 and 2020 in journals with impact factor. The number of participants per study ranged from 30 to 193. Regarding the mean age of the participants, the means reported from the studies fell within the range of 7·8–15·2 years (Table 1). They all recruited participants in nearly equal sex ratio. The mean BMI from the studies fell within the range of 19·4–26·9 kgm−2, and many of the studies recruited participants across the spectrum of normal weight, overweight and obesity. The nonfood commercials varied in context but were usually matched for duration. Meanwhile, only one paper reported results of nonfood > food commercials(Reference Gearhardt, Yokum and Harris25), whereas most papers reported that food commercials triggered larger brain responses than nonfood commercials.
Activation likelihood estimation meta-analysis results: food commercials > nonfood commercials
There were two significant clusters covering the cuneus on both hemispheres, with the cluster on the right side extended to the middle occipital gyrus (Fig. 2, Table 2). No significant association was found by automated regional behavioural analysis.
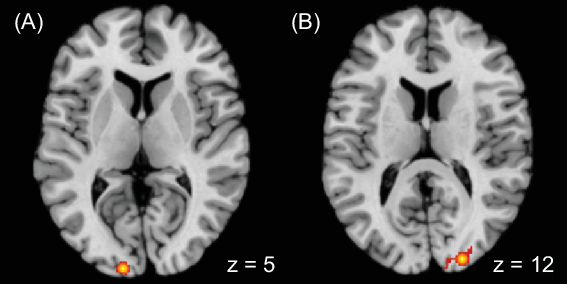
Fig. 2 Meta-analytic results showing brain regions having larger responses to food commercials than nonfood commercials at (A) left cuneus and (B) right middle occipital gyrus to cuneus
Table 2 Meta-analytic results of brain locations having larger responses to food commercials than nonfood commercials
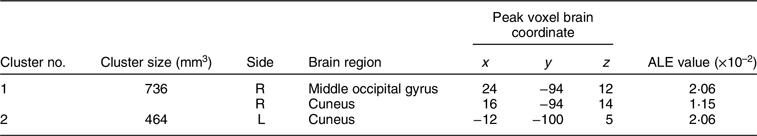
Brain coordinates are reported in Montreal Neurological Institute standard.
Activation likelihood estimation meta-analysis results: overall analysis
There were three significant clusters that cover the left culmen and middle occipital gyrus and the right superior parietal lobule (Fig. 3 A–C, Table 3). Cluster 1 (left culmen) was contributed by (i) food commercial > nonfood commercial(Reference Gearhardt, Yokum and Stice12); (ii) participants with overweight/obesity > healthy controls in response to viewing high energy food cue after watching food commercials(Reference Masterson, Bermudez and Austen26); (iii) unhealthy food commercials > healthy food commercials(Reference Gearhardt, Yokum and Harris25) and (iv) unhealthy food commercials > nonfood commercials(Reference Gearhardt, Yokum and Harris25). Clusters 2 and 3 were commonly contributed by (i) negative correlation of food commercials > nonfood commercials with BMI change 1 year later(Reference Yokum, Gearhardt and Harris27) and (ii) unhealthy food commercials > healthy food commercials(Reference Gearhardt, Yokum and Harris25). Cluster 2 was additionally contributed by nonfood commercials > food commercials(Reference Gearhardt, Yokum and Harris25), whereas cluster 3 was by food commercials > nonfood commercials(Reference Gearhardt, Yokum and Stice12) and unhealthy food commercials > nonfood commercials(Reference Gearhardt, Yokum and Harris25). Automated regional behavioural analysis revealed that the sub-domain of attention (from the main domain cognition) nearly reached a significant association at the left culmen (z = 2·96). No significant association was found for left middle occipital gyrus and right superior parietal lobule.
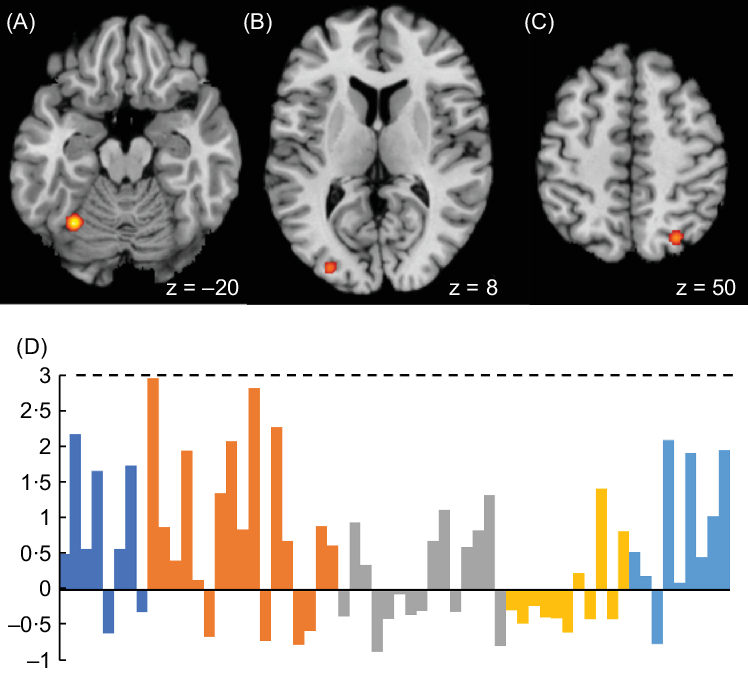
Fig. 3 Meta-analytic results showing brain regions with significant responses from overall analysis at (A) left culmen, (B) left middle occipital gyrus and (C) right superior parietal lobule. (D) Automated regional behavioural analysis showed that the sub-domain of attention (from the main domain cognition) nearly reached a significant association at the left culmen (z = 2·96)
Table 3 Meta-analytic results of brain locations from the overall analysis
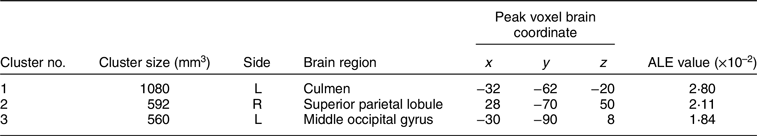
Brain coordinates are reported in Montreal Neurological Institute standard.
Discussion
This is the first meta-analysis on fMRI studies regarding brain responses to food commercials. Results have shown that food commercials caused larger brain responses than nonfood counterparts in the cuneus on both hemispheres among children and adolescents. Other brain regions involved in food commercials processing included the left culmen, left middle occipital gyrus and the right superior parietal lobule.
The cuneus is a visual processing area in the occipital lobe of the cerebrum. It played a role in dietary self-control and modulation of food craving in visual food cue processing(Reference Han, Boachie and Garcia-Garcia28,Reference Ihssen, Sokunbi and Lawrence29) . Among adolescents with normal weight, the response level in the cuneus upon receiving real milkshake was found to positively correlate to weight gain after 3 years(Reference Winter, Yokum and Stice30) and was higher for those with obesity prone genotype relative to their non-obesity prone counterparts(Reference Stice, Yokum and Voelker31). Similarly, the heightened activation in the cuneus in response to food commercials relative to nonfood counterparts positively correlated to weight gain after 1 year among adolescents regardless of their weight status(Reference Yokum, Gearhardt and Harris27). Meanwhile, adolescents with overweight had a higher response level in the cuneus in response to food commercials than nonfood counterparts relative to those with obesity and those who were lean(Reference Gearhardt, Yokum and Stice12). Since this(Reference Gearhardt, Yokum and Stice12) was the only study to report weight group differences in response to food commercials, it was not possible to conduct a meta-analysis on this. Future studies should further elucidate the differences between adolescents in different weight groups. Besides food craving and weight gain, cuneus was also associated with addictive behaviours. For instance, the activity level of cuneus in subjects addicted to Internet gaming was heightened relative to healthy controls during the exposure to game cues(Reference Han, Hwang and Renshaw32). Poor treatment outcomes in alcoholics were also associated with abnormal gray matter volume and functional connectivity in the cuneus(Reference Wang, Fan and Dong33). In the future, perhaps the activation of the cuneus may serve as a biomarker, such that the viewing of the proposed food commercials should not largely activate the cuneus of the review panel members before they are allowed to be broadcasted.
A large-scale meta-analysis concluded that the culmen, middle occipital gyrus and superior parietal lobule were commonly activated by drug, gambling, food and sexual cues, indicating their roles in the network that processed reward, emotional responses and habit formation(Reference Noori, Linan and Spanagel34). A previous meta-analysis reported that culmen and middle occipital gyrus were activated more in response to high energy food images than low energy counterparts(Reference van der Laan, De Ridder and Viergever35). In the current study, the activation of culmen was partly contributed by unhealthy food commercials > healthy food commercials and unhealthy food commercials > nonfood commercials, rendering it consistent to the previous findings in the sense that unhealthy food commercials advertised food with high energy. There seemed to be an association of culmen with food craving, as leptin was found to reverse the weight loss-induced alterations in the neural responses of culmen to food images among patients with obesity who had reduced 10% body weight(Reference Rosenbaum, Sy and Pavlovich36). Meanwhile, occipital and parietal cortices were activated more upon viewing food logos than nonfood logos(Reference Bruce, Lepping and Bruce37).
The processing of taste and food information is a complex issue and has multiple facets. In terms of the nature of the stimuli, the five senses of visual, auditory, gustatory, olfactory, tactile or any combinations among the five could be involved. Indeed, a meta-analysis of food perception found that visual food cues (images) activated the more posterior areas responsible for visual processing such as the occipital and cerebellar regions, whereas gustatory and olfactory food cues activated the more anterior areas responsible for visceral sensations(Reference Huerta, Sarkar and Duong38). Meanwhile, the evaluation of food involved numerous aspects, such as affective value, intensity and taste quality, which involved different areas of the limbic system(Reference Yeung, Goto and Leung15). None of the seven analysed papers gave specific instructions to the participants as they watched the food commercials, so that participants were not controlled to focus on a particular aspect of food perception as described above. Therefore, the activations could be interpreted as a general observation that food commercials led to more visual attention and food reward perception, as supported by the findings from the existing literature as well as automated regional behavioural analysis.
There were several limitations of this meta-analysis. First, the participants involved in the analysed papers were all children and adolescents with the maximum mean age of 15·2 years. The results might not be generalised to the adult population. Compared with adults, children might tend to have larger head motion, with the framewise displacement in the range of 1–1·5 mm for children of 7–8 years to around 0·25 mm for children of 11–13 years(Reference Engelhardt, Roe and Juranek39). In addition, there were few original papers identified, so that potential meta-analyses such as to compare healthy food commercials v. unhealthy food commercials could not be conducted. Besides, as commercials were compared, the stimuli were naturalistic instead of those audiovisual footages designed and used in other psychological fMRI experiments such as in dental phobia, where the test and control stimuli were matched for multiple parameters, including the foreground–background ratio, speed of zooming, sound level and so on(Reference Yeung, Lee and Tanabe40). As a result, it might be difficult to attribute the differential brain responses to a particular aspect of the commercials. A merit of the analysed studies was that all of them recruited subjects from both sexes, making them distinctive from the general food and taste fMRI studies(Reference Yeung, Wong and Eickhoff41). Meanwhile, ALE meta-analysis computes the consistency of brain locations involved across studies but not the effect size(Reference Eickhoff, Bzdok and Laird13).
Within the limitations of this meta-analytic report, it was concluded that food commercials caused larger brain responses than nonfood counterparts in the cuneus on both hemispheres among children and adolescents. Other brain regions involved in food commercials processing included the left culmen, left middle occipital gyrus and the right superior parietal lobule. These neural correlates may help explain the food choice and eating behaviours of children and adolescents that might be relevant to the development of obesity.
Acknowledgements
Acknowledgements: Not applicable. Financial support: Not applicable. Conflict of interest: None. Authorship: The author is responsible for all parts of the work. Ethics of human subject participation: Not applicable.


